COJ = 21 observations of the nearby galaxies Dwingeloo1 and Dwingeloo2
Abstract
We present an exploratory survey of the central regions of the nearby spiral galaxies Dwingeloo1 and Dwingeloo2 made in the COJ = 21 line at 230 GHz using the James Clerk Maxwell Telescope. In Dwingeloo1, which is probably the nearest grand–design barred spiral, the CO emission was sampled along a cross with its major axis aligned with the bar. The CO emission is an order of magnitude weaker (peak 70 mK) than in its neighbours IC342 and Maffei2 and appears to be confined to the nucleus, bar, and spiral arms. In Dwingeloo2, a small system quite likely to be a companion of Dw 1, a 3-sigma upper limit of 40 for the COJ = 21 emission from the nucleus was obtained.
Key words: galaxies: individual: Dw 1 — galaxies: individual: Dw 2 — galaxies: interstellar medium — galaxies: kinematics and dynamics: – galaxies: barred — galaxies: Local Group — (sub)millimeter lines
1 Introduction
Dwingeloo1 is a nearby barred spiral system discovered in the H i line by Kraan-Korteweg et al. (1994) during the Dwingeloo Obscured Galaxies Survey for galaxies hidden in the Zone of Avoidance. Subsequent optical and infrared observations by Loan et al. (1996), Aspin & Tilanus (priv. comm.), and McCall & Buta (1996), as well as interferometric H i observations by Burton et al. (1996), describe Dw 1 as of morphological type SBb at an inclination of , with a systemic velocity with respect to the LSR of , and at a distance estimated to be 3 Mpc. The small galaxy Dwingeloo2 was discovered by Burton et al. (1996) in the primary beam of the Westerbork observations as pointed towards Dw 1. In view of its angular and kinematic proximity to Dw 1, and in view of distortions in its velocity field, it seems likely that Dw 2 is a companion of the larger system. The two galaxies are probably members of the group containing Maffei1 & 2 and IC 342 and may influence the motions and morphology of that group and, by the group collectively, of our own Local Group.
There is yet but little information on the star-forming potential of Dw 1 and Dw 2. Loan et al. reported numerous H ii regions in Dw 1. Li et al. (1996) detected what they characterised as weak COJ=10 emission from the core of Dw 1. The ratio of CO–to–H i emissivity varies widely in galaxies, especially in barred galaxies (see e.g. Young & Scoville 1991). But Li et al. were not able to conclude from their single spectrum if the ratio in Dw 1 is unusally low, or if the galaxy belongs amongst those that show a central hole in the molecular gas distribution. The results of the exploratory survey reported here indicate that Dw 1 is not a strong CO emitter, but that both its CO emission and the CO–to–H i ratio fall within the range exhibited by ordinary galaxies. Rather than showing a central hole the molecular emission from the core is in fact more intense than that from beyond the core. We were unable to detect any CO emission from Dw 2.
2 Observations
The observations of Dw 1 and Dw 2 were made with the James Clerk Maxwell Telescope atop Mauna Kea in July and August of 1995. We used the A2 receiver which employs a lead–alloy SIS mixer and a Carlstrom–Gunn local oscillator; it has a noise temperature of about 95 K. The typical single–sideband system temperature is about 350 K at 230 GHz. The DAS digital autocorrelator backend was used with 2048 channels and configured for a total bandwidth of 500 MHz; during data reduction the velocity resolution was subsequently smoothed to 5 MHz, about 6.5.
The size of the beam of the JCMT 15–m attenna at the frequency (230.5380 GHz) of the COJ=21 transition is 21′′. The absolute pointing of the observations was good to about 2.5′′ rms; relative pointing was better than this. The Dw 1 spectra were obtained by position–switching the telescope to reference positions which were in general also located on that galaxy, but at the opposite side of the bar. Since galactic rotation shifts the signals from the two sides well apart in frequency, this strategy seemed a valid one to optimize the use of telescope time. In order to guard against accidental subtraction of emission due to an overlapping signal at the reference position, several different reference positions were commonly used with each ‘on’ position, and the profiles from each set carefully compared. The spectra were calibrated in units of the main–beam brightness temperature ( )111All reported CO intensities and derived molecular gas parameters are based upon , and corrected for sideband gains, for atmospheric emission in both sidebands, and for telescope efficiency. The rms surface accuracy of the JCMT is of order 30m. At the COJ = 21 frequency, the forward-scattering and spillover efficiency, , has a value of 0.8; the main-beam efficiency, , is 0.69. Residual baseline offsets were corrected by polynomal baseline removal.
We observed a total of 15 positions in Dw 1 with the inner 11 on a cross which had 34′′ spacings and was rotated over a position angle of 118∘ to align it with the central bar of Dw 1. The grid corresponds to an () cell of by . The center of Dw 1, our (0,0) position, was taken as (1950) = 02h53, (1950) = 58∘42′38′′ at an LSR velocity of 110, corresponding to the values determined initially by Kraan–Korteweg et al. (1994) and confirmed by the WSRT observations by Burton et al. (1996). The remaining 4 positions were located at larger distances at and along the direction of the bar.
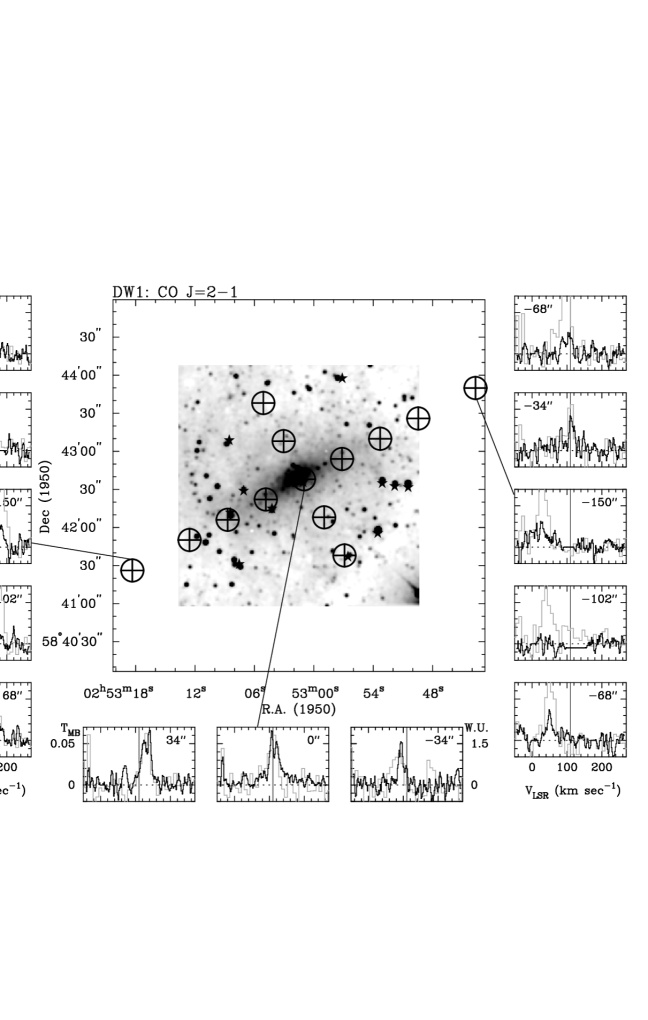
The JCMT CO spectra are shown in Figure1, superposed on the H i spectra observed by Burton et al. (1996) using the WSRT. The H i data were convolved to the spatial resolution of the current CO data prior to the extraction of the spectra. Shown in the center of the figure is a UKIRT K–band image of Dw 1 observed by Colin Aspin and Remo Tilanus and provided to us in advance of publication. Of the 15 positions searched for CO, 5 are located on the central bar. CO emission was detected at most of the positions observed with peak main–beam brightness temperatures of 70 mK. The kinematics revealed by the CO data are consistent with those seen in H i at the positions where both tracers were detected. It is interesting to note that the strength of the CO line relative to that of the H i line decreases with increasing distance from the nucleus; thus Dw 1 is generally not a strong molecular emitter, nor is it a galaxy with an anomalously low molecular component in the core.
The sky conditions on successive nights at the JCMT were quite variable, and thus so were the integration times invested in each observation; the rms noise level varies from profile to profile. The spectra have been smoothed in velocity to a resolution of 6.5 . The spectra have also been interpolated across a velocity range extending from to in order to blank out some CO emission contributed by a foreground molecular cloud located in the Milky Way; this foreground emission was also evident near zero velocity in the spectrum observed by Li et al. (1996). We cannot rule out additional contamination from low level Milky Way emission at velocities less than . In addition, the spectral values have been blanked at those velocities where a strong emission feature was present at the reference position.
It is necessary to have accurate positional information to assist superposition of data garnered at different wavelengths. Table 1 lists astrometric positions of stars located around the direction of Dw 1, as determined from POSS prints. The accuracy of the positions is about one second of arc.
| id | ||
|---|---|---|
| () | () | |
| 1 | 02 53 08.54 | +58 43 08.6 |
| 2 | 02 53 07.09 | +58 42 28.8 |
| 3 | 02 53 08.44 | +58 42 11.6 |
| 4 | 02 53 04.23 | +58 42 14.8 |
| 5 | 02 53 01.08 | +58 42 35.6 |
| 6 | 02 52 53.09 | +58 42 34.8 |
| 7 | 02 52 51.82 | +58 42 32.5 |
| 8 | 02 52 50.46 | +58 42 31.6 |
| 9 | 02 52 53.54 | +58 41 55.4 |
| 10 | 02 52 56.55 | +58 41 36.9 |
| 11 | 02 53 07.55 | +58 41 31.0 |
| 12 | 02 52 57.13 | +58 43 57.5 |
| 13 | 02 52 21.07 | +58 43 44.2 |
| distance | d | (H2) | remarks | |||
|---|---|---|---|---|---|---|
| (′′) | (′′) | (′′) | (K ) | 1020 cm-2 | ||
| Along bar: | ||||||
| 0 | 0 | 0 | 2.69 | 10.0 | ||
| 30 | -16 | 34 | 2.10 | 7.9 | ||
| -30 | 16 | -34 | 1.00 | 3.8 | ||
| 60 | -32 | 68 | 0.70 | 2.6 | ||
| -60 | 32 | -68 | 0.73 | 2.7 | ||
| 90 | -48 | 102 | 0.07 | 0.3 | ||
| -90 | 48 | -102 | 0.05 | 0.2 | ||
| 132 | -70 | 150 | 0.54 | 2.0 | ||
| -132 | 70 | -150 | 0.65 | 2.4 | contaminated by MW? | |
| 212 | -113 | 240 | 0.05 | 0.2 | ||
| -212 | 113 | -240 | 0.41 | 1.5 | contaminated by MW? | |
| Perpendicular bar: | ||||||
| 16 | 30 | 34 | 0.40 | 1.5 | ||
| -16 | -30 | -34 | 1.10 | 4.1 | ||
| 32 | 60 | 68 | 0.88 | 3.3 | ||
| -32 | -60 | -68 | 0.63 | 2.4 | ||
3 Discussion
The overall appearance of the CO J = 21 spectra supports the conclusion of Li et al. (1996) that the CO emission from the nucleus of Dw 1 is relatively weak, but only in the sense that it is much weaker (by an order of magnitude) than the strong CO emission from its neighbours, IC342 and Maffei2. Li et al. speculated that the CO emission from the nucleus of Dw 1 might not be typical of the galaxy as a whole, but that Dw 1 might be characterised by a central hole in the distribution of molecular gas. The present observations show, however, that the CO emission from the nuclear region is actually substantially more intense than that detected along the bar or from the spiral arms. Along the bar, there is a general decline of the CO emission towards the start of arms at the end of the bar. Just beyond the bar–arm intersections in the interarm regions the CO emission becomes undetectable. The profiles observed perpendicular to the bar at 68′′ distance from the nucleus, especially north, show some indication that CO emission is associated with the arms. Further support for this comes from the profiles observed along the bar at which may be located along the continuation of the spiral arms visible in the K–band image and show emission at the expected velocities. In contrast, the two positions closer in (), which are clearly interarm locations, show no detectable CO emission. However, the coverage of the current observations is insufficient to support a firm statement on the detailed association of CO emission with the spiral arms.
These conclusions are supported by Figure2, which shows the integrated CO emission as a function of galactocentric radius. Figure2 also shows the radial distribution of H i from the observations of Burton et al. (1996). The CO–to–H i ratio by mass observed in many other galaxies covers a wide range of values. The lower panel of Figure2 shows that in Dw 1 the H i and H2 masses are rather similar outside of the nucleus, where H2 dominates H i by a factor of about 2.5. The relative amount of atomic and molecular gas in Dw 1 is thus not very different from the situation pertaining in the more familiar galaxy M 33.

Figure3 shows the CO spectrum observed toward the nucleus of Dwingeloo1, together with a three–component Gaussian decomposition of the observation. The integrated intensity of K[ ] is about 45% higher than the value for the integrated COJ = 10 line found by Li et al. (1996) with a 55′′ beam (and after multiplying our number by / for the comparison). Their profile, which was smoothed to a resolution of 15, does not show the double–peaked structure which our observation does. The two principal Gaussians peak at 106.5 and 122.0, respectively, suggesting a systemic LSR velocity of about 114, which is a velocity close to the fitted center of the broad component, at 118, and which agrees well with the center of a single–component Gaussian fit, at 115. The single–component FWHM width is about 40. The +34′′ profile also is double–peaked like the nuclear profile. Most likely these spectra show non-circular streaming motions of the gas caused by the presence of a bar. The H i observations by Burton et al. (1996) place the dynamic center of the galaxy 5 arcseconds east and south of our (0,0) position.

If we adopt a value of the CO(21)/CO(10) intensity ratio of 0.8 as found for the Milky Way by Sanders et al. (1992) and the CO(10)–to–H2 conversion factor of Hcm2 advocated for the Milky Way by Scoville et al. (1987) and by Bloemen et al. (1986), we find that the average H2 column density222For details on the derivation of the numbers presented see the appendix to Kenney & Young (1989) with and the assumed CO(21)/CO(10) intensity ratio of 0.8 within the central 21′′ of Dw 1 is N(H2) cm-2 corresponding to a surface density of and a total H2 mass of . Correcting for an inclination of 50∘, one finds a deprojected average H2 surface density and total H2 mass for the central 300 pc of Dwingeloo1 of and , respectively.
We also attempted to detect COJ = 21 emission from Dwingeloo2. The small total velocity width of Dw 2 shown in the H i data of Burton et al. (1996), its small size (assuming it is located at the same distance as Dw 1), and the fact that it has been detected only at a weak level in the infrared, together lead one to expect that the CO signal, if detected at all, would be very weak. We confined the JCMT observations to integrations towards the nucleus of Dw 2, but were not able to detect CO emission above a 3– threshold of 40 mK.
4 Conclusions
The molecular emission observed from the nearby galaxy Dw 1 in the COJ = 21 line is relatively weak compared to its neighbours IC 342 and Maffei2, but is in the normal range for an ordinary galaxy. The emission could be followed in the JCMT observations reported here over the extent of the bar and into the spiral arms emanating from the ends of the bar. Thus it seems that Dw 1 does not belong to the category of barred systems with a central hole in the molecular distribution; the molecular emission is comparable throughout the galaxy, although relatively more intense in the core than in the bar or spiral-arm regions. Outside of the nucleus, where H2 dominates H i by a factor of about 2.5, the atomic and molecular masses are rather similar. We were unable to detect CO emission from the nucleus of Dw 2; this negative result is not unexpected for a dwarf companion system.
- Acknowledgements.
The James Clerk Maxwell Telescope is operated by the Observatories on behalf of the Particle Physics and Astrophysics Council of the United Kingdom, the Netherlands Foundation for Research in Astronomy, and the National Research Council of Canada. We are grateful to Chris Dudley (IfA, University of Hawaii) for help with the stellar astrometry, to Colin Aspin (UKIRT) for agreeing that we use the Aspin/Tilanus K–band image of Dwingeloo1, and to Marc Verheijen (Groningen) for providing the WSRT H i spectra in the form used here in Figure1. We also thank an anonymous referee for constructive comments.)
References
- 1 Bloemen J.B.G.M., Strong A., Blitz L., Cohen R.S., Dame T.M., Grabelsky D.A., Hermsen W., Lebrun F., Mayer-Hasselwander H.A., Thaddeus P., 1986, A&A 154, 25
- 2 Burton W.B., Verheijen M.A.W., Kraan-Korteweg R.C., Henning P.A., 1996, A&A 309, 687
- 3 Kenney J.D.P., Young J.S., 1989, ApJ 344, 171
- 4 Kraan-Korteweg R.C., Loan A.J., Burton W.B., Lahav O., Ferguson H.C., Henning P.A., Lynden-Bell D., 1994, Nat 372, 77
- 5 Li J.G., Zhao J.-H., Ho P.T.P., Sage L.J., 1996, A&A 307, 424
- 6 Loan A.J., Maddox S.J., Lahav O., Balcells M., Kraan-Korteweg R.C., Almoznino E., Brosch N., Goldberg E., Ofek E., 1996, MNRAS 280, 537
- 7 McCall M.L., Buta R.J., 1996, AJ (preprint)
- 8 Sanders D.B., Scoville N.Z., Tilanus R.P.J., Wang Z., Zhou S., 1992. In: S.S. Holt and F. Verter, eds, Back to the Galaxy, AIP Conference Proceedings 278, p. 311
- 9 Scoville N.Z., Yun M.S, Clemens D.P., Sanders D.B., Waller W.H., 1987, ApJS 63, 821
- 10 Young J.S., Scoville N.Z., 1991, ARA&A 29, 581