A catalogue of velocities in the cluster of galaxies Abell 85 ††thanks: Based on observations collected at the European Southern Observatory, La Silla, Chile
Abstract
We present a catalogue of velocities for 551 galaxies (and give the
coordinates of 39 stars misclassified as galaxies in our photometric
plate catalogue) in a region covering about 100’100’
(0.940.94 Mpc for an average redshift of 0.0555, assuming
H∘=50 km s-1 Mpc-1) in the direction of the rich cluster
ABCG 85. This catalogue includes previously published redshifts by Beers et al.
(1991) and Malumuth et al. (1992), together with our 367 new measurements.
A total of 305 galaxies have
velocities in the interval 13350-20000 km s-1, and will be considered as
members of the cluster. ABCG 85 therefore becomes one of the clusters
with the highest number of measured redshifts; its optical properties
are being investigated in a companion paper.
Key Words.:
Galaxies: clusters: individual: ABCG 85; galaxies: clusters of1 Observations and data reduction
1.1 Description of the observations
The observations were performed with the ESO 3.6m telescope equipped with MEFOS (see description below) during 6 nights on November 5-11, 1994 and 2 nights on November 24-26, 1995. The grating used with the Boller & Chivens spectrograph had 300 grooves/mm, giving a dispersion of 224 Å/mm in the wavelength region 3820-6100 Å. The detector was CCD #32, with 5122 pixels of m.
The catalogue of galaxy positions used in this survey was obtained with the MAMA measuring machine and is presented in a companion paper (Slezak et al., 1997). This catalogue gives approximate magnitudes in the bJ band, which were used to select the galaxies to be observed spectroscopically. CCD photometry of the central regions of the cluster in the V and R bands was later performed to recalibrate bJ magnitudes and obtain V and R magnitudes for the entire photometric sample. We observed spectroscopically a total number of 21 fields, with exposure times of 220 minutes for the two fields with galaxies all brighter than bJ=18, and 230 minutes for the other ones. We obtained 519 spectra in total (plus the same number of sky spectra).

Out of the 519 spectra obtained, we measured 421 reliable redshifts (the other ones were discarded due to insufficient signal to noise). Our catalogue includes these spectra, plus those previously published by Beers et al. (1991) and Malumuth et al. (1992). For galaxies observed twice, we chose the redshift with the smallest error (usually the Beers et al. data). The positions of the objects for which we obtained reliable spectra are shown in Fig. 1. These positions are relative to the following cluster center: . This center was chosen to coincide with that of the diffuse X-ray gas component as defined by Pislar et al. (1997).
1.2 Description of the MEFOS instrument
MEFOS uses the big advantage of the prime focus for fibre spectroscopy. The 3.6m ESO telescope has a prime focus triplet corrector delivering a field of one degree, the biggest at that time for a 4m class telescope. This will no longer be the case once the 2dF project at the AAT reaches completion in a very near future. The focal ratio is F/3.14, well suited for fibre light input, leading to negligible focal ratio degradation. MEFOS (Guérin et al. 1993) is sitting on the red triplet corrector and is made of 30 arms that sweep the 20 cm diameter (one degree) field.
Fig. 2 shows the general arm display. In fact, only 29 arms are positioned on astronomical objects, one arm being used for guiding. The arms are displayed around the field as “fishermen-around-the-pond”. The arms are moving radially and in rotation, in such a way that each arm is acting in a 15 degree triangle with its summit at the arm rotation axis and its base in the centre of the field. So, all arms may access an object in the centre of the field and only one can reach an object at the field periphery. This situation changes gradually from the centre to the edge of the field. Each arm has its individual electronic slave board and all the instrument is under control of a PC computer, independent from the Telescope Control System (TCS). The arm tips carry two fibres 1 arcmin apart, each one intercepting 2.5 arcsec on the sky. One is used for the object, and the second one for the sky recording, and both go down to the spectrograph. Object and sky can be exchanged; this allows to cancel the fibre transmission effects.
Coupled firmly to the arm tip is inserted an image conducting fibre bundle, that covers an area of 3636 arcsec2 on the sky. All the image bundles are projected on a single Thomson 10241024 thick CCD, Peltier cooled, connected to the same PC as the one driving the arms. Fig. 3 shows a galaxy field as seen by the 29 windows on the CCD, corresponding to the arm image bundles set on the object coordinates. This procedure, in opposition to blind positioning, is the only one, to our knowledge, that shows the objects on which the spectral fibre will be placed in a second step. By analyzing the real position of the object in the image fibre, and knowing the relative position of this image bundle and its connected spectral fibre, a precise offset is computed and the arm is sent to its working position. This offset takes care of all imprecisions due to the telescope, the instrument and the coordinate inaccuracy. Given the poor pointing of the telescope and the fact that the corrector and the instrument are frequently dismounted, blind positioning would be extremely dangerous. The positioning accuracy, as measured on stellar sources, is 0.2 arcsec. In the present stage, the spectral fibres, 135 mm in diameter and 21 m long, are going down from the prime focus to the Cassegrain, where the B&C ESO spectrograph is located. This spectrograph is fitted with a F/3 collimator to match the fibre output beam aperture, it has a set of reflection gratings and a Tek 512 x 512 thin CCD.
1.3 Data reduction
The spectra were reduced using the IRAF software. The frames were bias and flat field corrected in the usual way. Velocities were measured by cross-correlating the observed spectra with different templates : a spectrum of M31 (kindly provided by J. Perea) at a velocity of km s-1, and stellar spectra of the standard stars HD 24331 and HD 48381, which were each observed every night during our 1994 run. The cross-correlation technique is that described by Tonry & Davis (1979) and implemented in the XCSAO task of the RVSAO package in IRAF (Kurtz et al. 1991).
The positions of emission-lines, when present, were measured by fitting each line with a gaussian.
All the spectra were reduced by the same person (F.D.) in a homogeneous way. Redshifts of insufficient quality were discarded.
2 Quality of the data
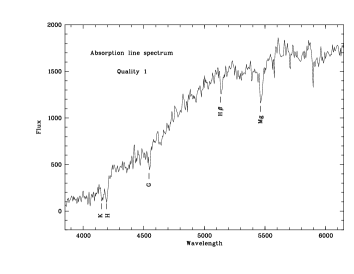
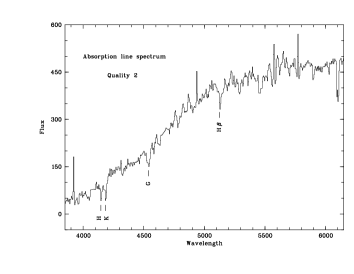
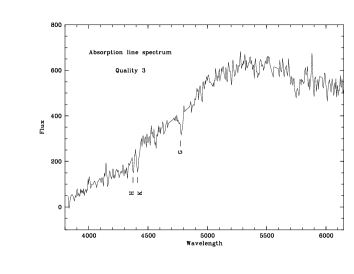
We classified our redshifts from 1 (best) to 3, according to their quality. For galaxies with absorption lines: spectra of quality 1 have at least three lines clearly visible; spectra of quality 2 have two; and spectra of quality 3 have only one. The signal to noise parameter R given by the cross-correlation measure is also given in Table 3. A histogram of this quantity is shown in Fig. 4.

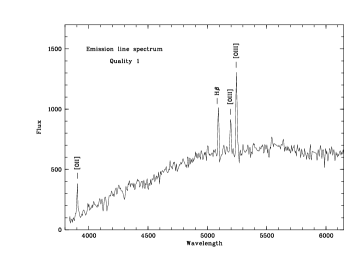
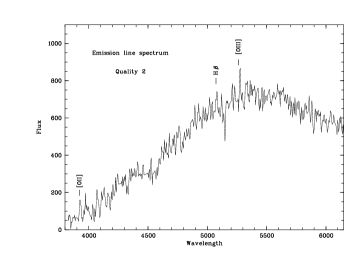
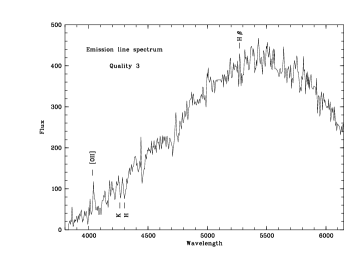
For galaxies with emission lines: spectra of quality 1 have all [OII]3727, H, and [OIII]4959-5007 lines clearly visible; spectra of quality 2 have at least two emission lines, and spectra of quality 3 have only one (usually [OII]3727); in that case, the identification of the emission line had to be confirmed by the shape of the continuum. The identification of a single line was made possible by the fact that all exposures were doubled, so we could remove cosmic rays and check that the emission line was indeed present in both spectra. Notice the high number of redshifts (100) obtained from emission lines.


| DFLS | DFLS | DFLS | Beers | Beers | Beers | Difference |
| position | velocity | error | position | velocity | error | |
| 0 41 28.112, -9 13 51.49 | 14102 | 92 | 0 41 27.202, -9 13 44.11 | 14233 | 46 | -131 |
| 0 41 28.112, -9 13 51.49 | 14102 | 92 | 0 41 29.000, -9 14 00.14 | 14022 | 33 | 80 |
| 0 41 50.396, -9 18 09.48 | 16719 | 81 | 0 41 49.767, -9 18 33.40 | 16536 | 44 | 183 |
| 0 41 50.396, -9 18 09.48 | 16719 | 81 | 0 41 50.070, -9 18 10.41 | 16734 | 48 | -15 |
| 0 41 50.157, -9 25 47.54 | 17224 | 78 | 0 41 50.240, -9 25 47.41 | 17360 | 69 | -136 |
| 0 41 53.400, -9 29 39.10 | 15331 | 48 | 0 41 53.625, -9 29 45.45 | 15392 | 34 | -61 |
| 0 42 12.944, -9 17 50.97 | 19950 | 75 | 0 42 12.750, -9 17 50.70 | 19758 | 59 | 192 |
| DFLS | DFLS | DFLS | Malumuth | Malumuth | Malumuth | Difference |
| position | velocity | error | position | velocity | error | |
| 0 40 31.650, -9 13 20.02 | 14102 | 42 | 0 40 31.550, -9 13 20.41 | 15410 | 91 | -1308 |
| 0 40 43.550, -8 57 27.33 | 16530 | 48 | 0 40 43.550, -8 57 27.33 | 16341 | 32 | 189 |
| 0 41 21.950, -9 03 31.18 | 16646 | 43 | 0 41 21.950, -9 03 31.18 | 16462 | 77 | 184 |
| 0 42 12.940, -9 17 50.85 | 19950 | 67 | 0 42 12.940, -9 17 50.85 | 19930 | 45 | -20 |
| 0 42 35.640, -9 03 48.28 | 16287 | 43 | 0 42 35.640, -9 03 48.28 | 16301 | 74 | -14 |
| 0 43 10.730, -9 26 18.43 | 28724 | 30 | 0 43 10.730, -9 26 18.43 | 28890 | 93 | -166 |
| Malumuth | Malumuth | Malumuth | Beers | Beers | Beers | Difference |
| position | velocity | error | position | velocity | error | |
| 0 38 30.1, -9 29 01 | 16256 | 96 | 0 38 30.0, -9 29 02 | 16213 | 48 | 43 |
| 0 38 33.7, -9 27 60 | 16617 | 83 | 0 38 33.7, -9 27 59 | 16725 | 64 | -108 |
| 0 38 55.2, -9 30 09 | 14178 | 109 | 0 38 55.4, -9 30 11 | 14233 | 46 | -55 |
| 0 38 56.9, -9 30 25 | 16530 | 61 | 0 38 57.2, -9 30 27 | 14022 | 33 | 2508 |
| 0 38 58.4, -9 32 13 | 13393 | 26 | 0 38 58.6, -9 32 15 | 13429 | 28 | -36 |
| 0 38 58.6, -9 30 33 | 16241 | 96 | 0 38 58.7, -9 30 35 | 16328 | 46 | -87 |
| 0 39 00.1, -9 36 29 | 13811 | 56 | 0 39 00.2, -9 36 30 | 13781 | 41 | 30 |
| 0 39 01.7, -9 25 51 | 18141 | 59 | 0 39 01.6, -9 25 52 | 18154 | 39 | -13 |
| 0 39 02.9, -9 38 17 | 14125 | 46 | 0 39 03.3, -9 38 19 | 14234 | 42 | -109 |
| 0 39 11.2, -9 42 50 | 16792 | 107 | 0 39 11.3, -9 42 49 | 16886 | 35 | -94 |
| 0 39 16.4, -9 33 30 | 15851 | 22 | 0 39 16.6, -9 33 31 | 15912 | 69 | -61 |
| 0 39 18.6, -9 34 38 | 16447 | 126 | 0 39 18.3, -9 34 37 | 16734 | 48 | -287 |
| 0 39 18.4, -9 42 15 | 17174 | 118 | 0 39 18.5, -9 42 14 | 17360 | 69 | -186 |
| 0 39 20.4, -9 46 42 | 17054 | 51 | 0 39 20.5, -9 46 43 | 17164 | 33 | -110 |
| 0 39 21.7, -9 46 13 | 15181 | 46 | 0 39 21.9, -9 46 12 | 15392 | 34 | -241 |
| 0 39 41.1, -9 34 17 | 19930 | 45 | 0 39 41.0, -9 34 17 | 19758 | 59 | 172 |
| 0 40 01.9, -9 27 05 | 16891 | 99 | 0 40 02.0, -9 27 07 | 16761 | 58 | 130 |
| 0 40 22.9, -9 30 20 | 22910 | 51 | 0 40 22.8, -9 30 16 | 5230 | 59 | 17680 |
In order to check the intrinsic quality of our velocity measurements, two velocity standard stars from the Maurice et al. (1984) list were observed each night. The errors, derived by cross-correlating the star spectra to the spectrum of M31, range (from night to night) from 16 to km s-1 for HD 24331, and from 17 to km s-1 HD 48381. The mean internal error on velocities derived from the accuracy in the wavelength calibration is 66 km s-1. The distribution of errors on velocities is displayed in Figs. 11 and 13 for absorption and emission line measurements respectively (these histograms only include the galaxies that we observed). For absorption lines, the correlation between the Tonry & Davis R parameter and the error on the velocity is displayed in Fig. 12 for the 262 galaxies for which we had both quantities. For emission line measurements, the errors on velocities were estimated from the dispersion on the velocities derived from the various emission lines present. When only one emission line was present we averaged the emission and absorption line redshifts whenever possible; if no reliable absorption line redshift was available, we estimated the internal error on a single emission line to be the intrinsic value of 66 km s-1 mentioned above.
In order to test the agreement of our redshifts with those of previous surveys, we reobserved 7 and 6 galaxies from the velocity catalogues by Beers et al. (1991) and Malumuth et al. (1992) respectively. The comparison of these various measurements are given in Table 1. Except for a few totally discrepant values, which are probably due to galaxy misidentifications, our values agree with those of the literature, with BWT mean differences of +8 and +35 km s-1 between our values and the Beers and Malumuth samples respectively, and corresponding BWT dispersions of 132 and 156 km s-1 (for the comparison with the Beers data, we kept the two first of our objects in the above Table which gave the smallest velocity difference with the Beers data). These values are comparable to the BWT mean ( km s-1 ) and BWT dispersion (125 km s-1 ) that we estimate between the Beers and Malumuth samples. However, the number of objects in common is of course small and may pervert statistics.
To check the consistency of our calibrations between the two observing runs, we reobserved in 1995 four galaxies already observed in 1994; the agreement between the various values is better than 100 km s-1 , confirming that the mean error on our velocities is smaller than 100 km s-1 .
The final redshifts given in the catalogue are those derived from the cross-correlation with M31, since this template gave the best results. A correction was applied to obtain heliocentric velocities.

The histogram of all the velocities in the catalogue is displayed in Fig. 14. It will be discussed in detail in a companion paper (Durret et al. in preparation).
| Limiting | 700 | 1000 | 1500 | 2000 | 2500 |
|---|---|---|---|---|---|
| diameter (”) | |||||
| Completeness | 88.5% (85/96) | 91.9% (137/149) | 87.6% (219/250) | 84.7% (316/373) | 77.4% (384/496) |
We have estimated the completeness of the spectroscopic catalogue presented here by comparing the numbers of galaxies with redshifts to the total number of galaxies from our photographic plate catalogue. Results are shown in Table 2.
3 The catalogues
Note that out of the 421 reliable redshifts that we obtained, 39 were those of stars misclassified as galaxies in our photometric plate catalogue. In order to show that most misclassifications were made on faint objects, we show in Figs. 15 and 17 the magnitude histograms for the galaxies with measured velocities and those for the 39 stars. Although this number may seem large, it corresponds to a percentage of contamination only 5% for bJ, in agreement with the verification made by eye on a portion of the catalogue. The contamination by foreground and background galaxies is illustrated in Fig. 16, which shows the histogram of the R magnitudes for the galaxies outside the velocity range 13350-2000 km/s corresponding to ABCG 85.


| Running | ||
|---|---|---|
| number | (J2000.0) | |
| 1 | 0 38 53.96 | -8 54 47.39 |
| 2 | 0 38 54.64 | -8 54 58.72 |
| 3 | 0 39 04.83 | -9 34 29.83 |
| 4 | 0 39 19.77 | -8 33 45.12 |
| 5 | 0 39 21.33 | -9 43 02.95 |
| 6 | 0 40 19.95 | -9 12 56.30 |
| 7 | 0 40 20.74 | -9 37 48.60 |
| 8 | 0 40 24.95 | -8 59 37.11 |
| 9 | 0 40 35.43 | -9 53 18.82 |
| 10 | 0 40 47.65 | -8 54 29.04 |
| 11 | 0 40 47.76 | -8 40 06.64 |
| 12 | 0 40 50.14 | -9 29 24.14 |
| 13 | 0 41 10.53 | -9 49 50.17 |
| 14 | 0 41 42.94 | -9 19 14.51 |
| 15 | 0 41 54.45 | -8 44 30.03 |
| 16 | 0 41 56.15 | -8 53 15.83 |
| 17 | 0 42 02.95 | -8 38 03.54 |
| 18 | 0 42 07.23 | -9 52 22.05 |
| 19 | 0 42 16.94 | -9 11 10.46 |
| 20 | 0 42 17.13 | -9 33 25.16 |
| 21 | 0 42 18.31 | -9 59 02.14 |
| 22 | 0 42 21.05 | -8 58 20.66 |
| 23 | 0 42 25.73 | -9 44 56.37 |
| 24 | 0 42 26.24 | -9 15 19.57 |
| 25 | 0 42 56.33 | -9 29 50.41 |
| 26 | 0 43 05.75 | -8 43 33.93 |
| 27 | 0 43 10.04 | -9 02 29.83 |
| 28 | 0 43 16.14 | -8 49 49.14 |
| 29 | 0 43 18.14 | -9 13 07.34 |
| 30 | 0 43 19.12 | -9 48 52.45 |
| 31 | 0 43 20.41 | -10 01 11.80 |
| 32 | 0 43 23.33 | -9 18 33.75 |
| 33 | 0 44 05.91 | -9 56 30.21 |
| 34 | 0 44 06.75 | -8 32 35.11 |
| 35 | 0 44 27.94 | -8 59 08.44 |
| 36 | 0 44 37.74 | -8 41 39.96 |
| 37 | 0 44 38.41 | -9 54 48.36 |
| 38 | 0 44 43.31 | -9 57 11.87 |
| 39 | 0 44 44.24 | -8 48 49.47 |
The coordinates (equinox 2000.0) of the 39 stars misclassified as galaxies are given in Table 3, to avoid further observations of these objects in galaxy surveys.
The velocity data for the galaxies in the field of ABCG 85 are given
in Table 4 (available in electronic form only). The signification of the
columns is the following:
(1) Running number;
(2) to (4): right ascension (equinox 2000.0);
(5) to (7): declination (equinox 2000.0);
(8): heliocentric velocity (cz) in km s-1 ;
(9): error on the velocity in km s-1 ; for velocities derived from absorption
lines, the error is either that stated in the literature or, for our own
measurements, that given by the RVSAO IRAF package; for velocities derived
from several emission lines, the error was estimated from the dispersion
between the velocities derived from the different emission lines; when
only one emission line was present and an absorption line redshift was
obtainable, the error on the velocity was taken to be the dispersion
between both measurements; finally, when only one emission line was present
and no absorption line redshift was available, the error on the velocity
was taken to be the mean internal velocity error;
(10): Tonry & Davis R parameter;
(11): label indicating the means of determination of the redshift: 0=derived
from absorption lines, 1=derived from emission lines;
(12): label indicating the quality of the data, from 1 (best) to 3 (0 for
data taken from the literature);
(13): label indicating the origin of the data: 1=Malumuth et al. (1992),
2=Beers et al. (1991), 3=our data;
(14) and (15): X and Y positions in arcseconds relative to the center
assumed to have coordinates
(equinox 2000.0);
(16) distance to the cluster center in arcseconds;
(17) to (19): magnitudes in the bJ, V and R bands respectively;
(20): reference to the galaxy number in the Beers et al. 1991 (B) and
Malumuth et al. 1992 (M) catalogues, as well as reference to the name given
to six galaxies identified as X-ray sources by Pislar et al. 1997
(their Table 1).
4 Conclusions
Our photometric catalogues, including both the large field catalogue obtained by scanning a photographic plate and the small CCD field catalogue, will be published in a companion paper (Slezak et al. 1997). All these optical data are used to give an interpretation of the properties of ABCG 85 (Durret et al. in preparation). They will be compared to the results already obtained from X-ray data in Papers I and II (Pislar et al. 1997, Lima–Neto et al. 1997).
Acknowledgements.
We are very grateful to Andrée Fernandez for her help during the preparation of the first observing run, to Paul Stein for helping us obtain a catalogue of guiding stars and to Cláudia Mendes de Oliveira for her cheerful and highly competent assistance at the telescope. We thank the anonymous referee for many useful comments. CL is fully supported by the BD/2772/93RM grant attributed by JNICT, Portugal.References
- (1) Beers T.C., Forman W., Huchra J.P., Jones C., Gebhardt K. 1991, AJ 102, 1581
- (2) Guérin J., Bellenger R., Dreux M., Felenbok P., Fernandez A., Rousset G., Schmidt R. 1993, in Fiber Optics in Astronomy II (ed. Gray P.M.) p. 145
- (3) Kurtz M.J., Mink D.J., Wyatt W.F., et al. 1991, in “Astronomical Data Analysis Software and Systems I”, ASP Conf. Ser., Vol. 25, eds. D.M. Worrall, C. Biemesderfer, & J. Barnes, p. 432-438
- (4) Lima-Neto G.B., Pislar V., Durret F., Gerbal D., Slezak E. 1997, A&A in press
- (5) Malumuth E.M., Kriss G.A., Van Dyke Dixon W., Ferguson H.C., Ritchie C. 1992, AJ 104, 495
- (6) Maurice E., Mayor M., Andersen J. et al. 1984, A&AS 57, 275
- (7) Pislar V., Durret F., Gerbal D., Lima-Neto G.B., Slezak E. 1997, A&A 322, 53
- (8) Slezak E., Durret F., Guibert J., Lobo C. 1997, A&AS in press
- (9) Tonry J., Davis M. 1979, AJ 84, 1511