THE COMA CLUSTER IN RELATION TO ITS ENVIRONS
Clusters of galaxies are often embedded in larger-scale superclusters with dimensions of tens or perhaps even hundreds of Mpc. Observational and theoretical evidence suggest an important connection between cluster properties and their surroundings, with cluster formation being driven primarily by the infall of material along large-scale filaments. Nowhere is this connection more obvious than the Coma cluster.
1 Historical Background
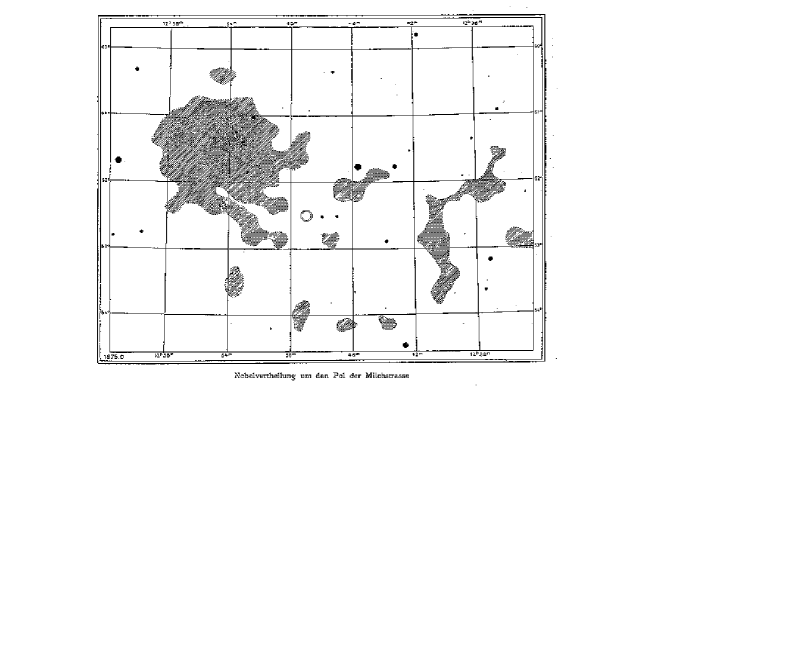
The Coma cluster’s surroundings have been discussed in the astronomical literature for nearly as long as the cluster itself. William Herschel (1785) discovered what he called “the nebulous stratum of Coma Berenices” and remarked that “I have fully ascertained the existence and direction of this stratum for more than 30 degrees of a great circle and found it to be almost every where equally rich in fine nebulae.” Coma’s sprawling galaxy distribution was also evident in Max Wolf’s (1902) catalogue of nebulae in and around Coma (see Figure 1). Shapley’s (1934) observations led him to conclude that “A general inspection of the region within several degrees of the Coma cluster suggests that the cluster is part of, or is associated with, an extensive metagalactic cloud…” Shane & Wirtanen (1954), on the other hand, argued that the Coma cluster is a single isolated entity which blends into the background at a projected distance of ( Mpc) from its centre. Yet even Zwicky (1957), who steadfastly denied the existence of structure on supercluster scales, nevertheless acknowledged that the Coma cluster extends to a projected radius of at least from the cluster centre, corresponding to distances of more than Mpc. Abell (1961) examined the distribution of the rich clusters that he had catalogued and suggested that Coma is one of six members of a supercluster that extends Mpc in diameter.
2 Coma’s Cosmic Neighbourhood
Modern galaxy catalogues and redshift surveys have helped bring our view of the Coma cluster’s environs into much clearer focus. As Figure 2 shows, Coma is the most conspicuous concentration in a highly structured large-scale galaxy distribution that is quite filamentary in appearance, with thin quasi-linear features extending over large portions of the sky. In particular, a prominent ridge of galaxies can be seen connecting Coma to the rich clusters A2197, A2199 and A1367, with several smaller filaments branching off in different directions. A closeup view of a degree region centered on the Coma cluster is shown in Figure 3. The cluster is clearly embedded in an elongated swath of galaxies extending along a projected position angle of .


Gregory & Thompson’s (1978) pioneering redshift survey of Coma’s environs provided the first direct evidence that this apparent feature in the projected galaxy distribution is in fact a genuine three-dimensional bridge linking Coma with its nearest neighbouring cluster, Abell 1367, which lies some Mpc away. A few years later the famed CfA redshift survey (de Lapparent, Geller & Huchra 1986; Geller & Huchra 1989) mapped the galaxy distribution surrounding Coma in exquisite detail, producing one of the most unforgettable astronomical images of the 1980s of a majestic Mpc long structure sweeping across the entire survey region (see Figure 4).

3 Great Walls or Great Filaments?
Many different adjectives have been used to describe the appearance of the large-scale galaxy distribution surrounding Coma. For example, Tago, Einasto & Saar (1984) proposed that the Coma-A1367 supercluster is characterized by a network of interconnected “cluster chains” or “filaments.” de Lapparent, Geller & Huchra (1986) on the other hand suggested that “the galaxies appear to be on the surfaces of bubble-like structures” and argued that any filamentary features are merely an artifact of viewing slices through these bubbles. Further extensions of the original CfA survey confirmed that the large-scale feature surrounding the Coma cluster remains coherent over adjacent slices in declination. Geller & Huchra (1989) described this structure as “sheet-like” or “sponge-like” and christened it the “Great Wall” noting that it has dimensions of at least Mpc Mpc but a line-of-sight thickness of only Mpc.
Is the large-scale galaxy distribution surrounding the Coma cluster filamentary, planar, bubble-like or some combination? These different descriptions of Coma’s environs are not merely an exercise in subjective semantics; the topology of the large-scale matter distribution is expected to be an important test of different models for the formation of structure in the universe, and hence an objective and accurate description is essential. Geller & Huchra (1989) argued that “the thin large-scale features in this region are cuts through two-dimensional sheets, not one-dimensional filaments” because if the Mpc long structure is a filament then “we would expect to see corresponding elongated structures in the distribution projected on the sky” and none is observed. However, Figure 2 shows that strikingly coherent filamentary structures are indeed visible when the image is “enhanced” to bring out the hightest density regions in the projected galaxy distribution. Similar filamentary features are also seen around other clusters, most notably the Perseus-Pisces supercluster (Haynes & Giovanelli 1986), where again a number of smaller filaments appear to merge into a larger one, like tributaries flowing into a larger river. Comparison of Figures 2 and 4 suggests that at least some of the “sheet-like” appearance found in the CfA survey may result from taking broad declination cuts across multiple interconnecting filaments, as the decreased resolution will inevitably tend to smear out individual thin linear structures. This is not to say that genuine wall-like features do not exist; clearly the space between filaments is not completely empty and the galaxy distribution appears to remain contiguous over these regions, however such walls may simply be the “webbing” between more prominent filaments (Bond, Kofman & Pogosyan 1996).
It is perhaps worthwhile to consider the namesake of the Great Wall of the CfA survey, the Great Wall of China. The Great Wall of China reached km in length, m in height and roughly m in width, for an approximate axial ratio of 1,000,000:1:1. For comparison, the most prominent large-scale feature in the the CfA survey extends at least Mpc in length, yet is only Mpc in projected thickness in its densest regions and Mpc along the line of sight, corresponding to an approximate axial ratio 30:1:1. Hence a plausible argument can be made that, despite their names, both the Great “Wall” of China and the Great “Wall” of the Coma cluster are in reality highly elongated filamentary-type structures!
Further evidence that the supercluster environment of Coma is best characterized by a filamentary rather than planar structure is presented in the next section.
4 The Cluster-Supercluster Connection
Mounting observational evidence suggests that the distribution of matter on supercluster scales exerts a profound influence on the formation of clusters and their member galaxies.
Binggeli (1982) first showed that the major axes of rich clusters exhibit a remarkable tendency to point towards neighbouring clusters, over separations of Mpc or more. This result has since been confirmed by numerous other studies (e.g., West 1989; Rhee, van Haarlem & Katgert 1992; Plionis 1994). This tendency for clusters to have preferred orientations with respect to their surroundings is readily seen in the Coma cluster, whose major axis (as determined from either the distribution of member galaxies or hot intracluster gas) lies along the same position angle as the prominent filament that surrounds it.
These observed alignments indicate an important connection between cluster formation and supercluster environment. West, Jones & Forman (1995) showed that the distribution of subclusters the building blocks from which clusters are assembled also reflects the surrounding filamentary distribution of matter, and they interpreted this as evidence that cluster formation proceeds via the anisotropic infall of material sheparded along these filaments. Theoretical arguments suggest that this sort of infall along preferred directions is likely to be a generic phenomenon of many models of structure formation (e.g., Bond 1987; Bond, Kofman & Pogosyan 1996; West 1994). In the Coma cluster the arrangement of its multiple subclusters clearly reflects the orientation of the surrounding supercluster filament (see Figure 5). It is worth emphasizing that in general one would not expect to observe frequent cluster-cluster alignments if superclusters are predominantly planar, since in that case clusters would presumably have random orientations along the surface of the sheet and hence neighbouring clusters would appear aligned only in instances when a sheet is viewed nearly edge on. A large-scale matter distribution with a filamentary pattern imprinted on it provides a much more natural explanation for the origin of the cluster alignments.
This “cross-talk” between clusters and superclusters appears to extend to even smaller scales. It has been known for some time that central dominant galaxies in clusters exhibit a marked tendency to share the same major axis orientation as their parent cluster (Sastry 1968; Binggeli 1982; Porter et al. 1991; West 1994), and hence they also tend to “point” along surrounding filaments. In the case of the Coma cluster, the orientations of the two central dominant galaxies, NGC 4889 and NGC 4874, as well as the projected separation vector between them, all share the same position angle of the Coma-A1367 filament.
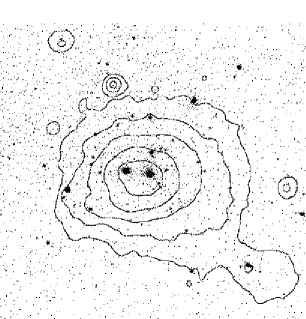

Interestingly, closer examination reveals that this galaxy alignment effect is not limited to only the brightest cluster member. Table 1 lists the major axis position angles of the brightest elliptical galaxies in the Coma cluster. There is a clear tendency for the orientations of these galaxies to be similar to the position angle defined by the Coma-A1367 supercluster filament, a fact which was first noted by Brown (1939). The probability that these galaxy orientations are random is only according to a Kolmogorov-Smirnov test. Hence the brightest ellipticals in Coma exhibit a statistically significant tendency to be oriented along the local large-scale filament. In fact, in some cases these alignments can be traced all the way to sub-kpc distances from the galaxy center (see Figure 6). The shape and orientation of both the Coma cluster and its brightest member galaxies clearly reflect the large-scale anisotropies in the surrounding matter distribution.
A similar effect is seen in the Virgo cluster (Table 1), where again the brightest elliptical galaxies appear to “know” about the principal axis of the cluster, which in this case lies along a projected position angle of . An intriguing possibility is that the Virgo, A1367 and Coma clusters are all members of a common filamentary network, with the Virgo cluster oriented along a filament that runs between it and A1367 (Zeldovich, Einasto & Shandarin 1982; West 1998). The tendency for bright elliptical galaxies to align with the surrounding large-scale structure appears to be a rather general phenomenon (Lambas, Groth & Peebles 1988; Muriel & Lambas 1992).
| Coma Galaxy | Position Angle |
|---|---|
| NGC 4816 | |
| NGC 4839 | |
| NGC 4841A | |
| NGC 4874 | |
| NGC 4889 | |
| NGC 4911 |
| Virgo Galaxy | Position Angle |
|---|---|
| NGC 4374 (M84) | |
| NGC 4406 (M86) | |
| NGC 4473 | |
| NGC 4478 | |
| NGC 4486 (M87) | |
| NGC 4564 | |
| NGC 4621 (M59) | |
| NGC 4649 (M60) | |
| NGC 4660 |
The alignments of galaxies and clusters with their supercluster surroundings indicates a remarkable coherence of structures over roughly four orders of magnitude in mass and demonstrates clearly that it is the filaments, and not the walls, that have influenced cluster formation most strongly.
5 Conclusions: Lessons to be Learned from Coma
-
•
Clusters of galaxies are often embedded in large-scale superclusters which may extend for tens of hundreds of Mpc.
-
•
The morphology of superclusters is primarily (though not exclusively) filamentary, with quasi-linear bridges of material connecting neighbouring clusters.
-
•
There can be little doubt that the formation of the Coma cluster, as well as its brightest member galaxies, has been driven by infall of material along filaments.
What lies in the future for Coma? Material will undoubtedly continue to flow into the cluster along filaments, and in fact one can even identify future subclusters from the surrounding distribution of groups (see Figure 7). Assuming a typical infall velocity of km/s into Coma (Bothun et al. 1992), Coma is likely to swallow a number of sizeable groups (Ramella, Pisani & Geller 1997) over the course of the next few billion years.

Acknowledgments
It is a pleasure to thank Alain Mazure, Florence Durret, Daniel Gerbal, Fabienne Casoli and everyone on the local organizing committee in Marseille for a most enjoyable and stimulating meeting. I gratefully acknowledge financial support from the meeting sponsors, NSERC of Canada and the Canadian Institute for Theoretical Astrophysics.
References
References
- [1] Binggeli, B., 1982, A&A, 107, 338.
- [2] Bond, J.R., 1987, in Nearly Normal Galaxies, ed. S. Faber (Berlin: Springer-Verlag), p. 389.
- [3] Bond, J.R., Kofman, L., & Pogosyan, D., 1996, Nature, 380, 603.
- [4] Bothun, G.D., Geller, M.J., Kurtz, M.J., Huchra, J.P., & Schild, R.E., 1992, ApJ, 395, 347.
- [5] Brown, F.G., 1939, MNRAS, 99, 534.
- [6] de Lapparent, V., Geller, M.J., & Huchra, 1986, ApJ, 302, L1.
- [7] de Vaucouleurs, G., et al., 1991, Third Reference Catalog of Bright Galaxies (New York: Spinger-Verlag).
- [8] Doi, M., Fukugita, M., Okamura, S., & Tarusawa, K., 1995, ApJS, 97, 77.
- [9] Geller, M.J., & Huchra, J.P., 1989, Science, 246, 897.
- [10] Gregory, S.A., & Thompson, L.A., 1978, ApJ, 222, 784.
- [11] Haynes, M.P., & Giovanelli, R., 1986, ApJ, 306, L55.
- [12] Herschel, W., 1785, “On the Construction of the Heavens” in Philosophical Transactions of the Royal Society of London, 75, 213.
- [13] Lambas, D.G., Groth, E.J., & Peebles, P.J.E., 1988, AJ, 95, 996.
- [14] Mellier, Y., Mathez, G., Mazure, A., Chauvineau, B., & Proust, D., 1988, A&A, 199, 67.
- [15] Muriel, H., & Lambas, D.G., 1992, AJ, 103, 393.
- [16] Plionis, M., 1994, ApJS, 95, 401.
- [17] Porter, A.C., Schneider, D.P., & Hoessel, J.G., 1991, AJ, 101, 1561.
- [18] Ramella, M., Pisani, A., & Geller, M.J., 1997, AJ, 113, 483.
- [19] Rhee, G., van Haarlem, M., & Katgert, P., 1992, AJ, 103, 1721.
- [20] Sastry, G.N., 1968, PASP, 80, 252.
- [21] Shane, C.D., & Wirtanen, C.A., 1954, AJ, 59, 285.
- [22] Shapley, H., 1934, Harvard College Observatory Bulletin 896, p. 3.
- [23] Tago, E., Einasto, J., & Saar, E., 1984, MNRAS, 206, 559.
- [24] Vikhlinin, A., Forman, W., & Jones, C., 1997, ApJ, L7.
- [25] Wolf, M., 1902, Heidelberg Pub., 1, 125.
- [26] West, M.J., 1989, ApJ, 347, 610.
- [27] West, M.J., 1994, MNRAS, 268, 79.
- [28] West, M.J., 1998, in preparation.
- [29] West, M.J., Jones, C., & Forman, W., 1995, ApJ, 451, L5.
- [30] Zeldovich, Ya.B., Einasto, J., & Shandarin, S.F., 1982, Nature, 300, 407.
- [31] Zwicky, F., 1957, Morphological Astronomy, (Berlin: Spinger-Verlag), p. 55.