The Peculiar Rotation Curve of NGC 157
Abstract
We present the results of a new H i, optical, and H interferometric study of the nearby spiral galaxy NGC 157. Our combined C- and D-array observations with the VLA show a large-scale, ring-like structure in the neutral hydrogen underlying the optical disk, together with an extended, low surface density component going out to nearly twice the Holmberg radius. Beginning just inside the edge of the star-forming disk, the line of nodes in the gas disk commences a 60∘ warp, while at the same time, the rotation velocity drops by almost half its peak value of 200 km s-1, before leveling off again in the outer parts. While a flat rotation curve in NGC 157 cannot be ruled out, supportive evidence for an abrupt decline comes from the ionised gas kinematics, the optical surface photometry, and the global H i profile. A standard ‘maximum-disk’ mass model predicts comparable amounts of dark and luminous matter within NGC 157. Alternatively, a model employing a disk truncated at 2 disk scale lengths could equally well account for the unusual form of the rotation curve in NGC 157.
keywords:
galaxies: individual (NGC 157) — galaxies: kinematics and dynamics — galaxies: spiral — radio lines: galaxies.1 Introduction
Observations of the neutral hydrogen in ‘normal’ spiral galaxies have frequently revealed new and surprising aspects of their structure. Structures in the gas such as warps, tails, and superbubbles point to a more turbulent history than that indicated by the stellar distribution. The nearby SAB(rs)bc galaxy NGC 157 is a striking example of this. Blue light photographs (Lynds 1974) show a dusty, flocculent disk of high surface brightness, which is reasonably symmetric and apparently undisturbed. In contrast, the H i aperture synthesis observations presented here show a kinematic warp and an unusual rotation curve, which may point to a strongly warped disk or a peculiar dark matter distribution.
Some hints of NGC 157’s distinctive qualities are contained in earlier optical studies. Blackman (1979) presented photographic UBVR luminosity profiles, which pointed to the presence of a second, outer exponential disk, with a longer scale length than the inner disk. He also conjectured (from modeling of the spiral arm morphology) that the rotation curve might be declining at large radii. The disk kinematics of NGC 157 were first investigated by Burbidge, Burbidge & Prendergast (1961), who derived a slowly-rising rotation curve and a total mass M⊙ on the basis of two long-slit spectra close to the galaxy’s major axis. Zasov & Kyazumov (1981, hereafter ZK) obtained long-slit spectra of NGC 157 at a number of position angles, and found good agreement with the Burbidge et al. rotation curve in the southwest part of the disk, but a significant drop in rotational velocity (up to km s-1) beyond a radial distance of 55 arcsec to the northeast. Further evidence of peculiar kinematics comes from the global H i profiles of NGC 157 obtained with the Jodrell Bank 76-m radio telescope by Staveley-Smith & Davies (1987; hereafter SSD), and with the Parkes 64-m telescope by Mathewson, Ford & Buchhorn 1992; hereafter MFB). Both spectra show a two-horned profile with a strange pair of shoulder-like features. All this is made the more curious by the fact that the galaxy is quite isolated. No close companions of comparable brightness are seen in the POSS images, and the nearest galaxy in the NED database within km s-1 is UGCA 14, at a projected distance of ( Mpc for Mpc; Tully 1988). In fact, there are only five catalogued galaxies within and km s-1.
There are also hints from the literature of strong internal forces acting on the galaxy. At the position of the peculiar motions seen by ZK, blue light photographs show no obvious signs of a perturbation or companion object. However, H images (ZK; Rozas, Beckman & Knapen 1996) reveal a ‘ring’ of H ii regions centered arcmin northeast of the nucleus of NGC 157 and some ( kpc) in diameter. A ring-shaped feature like this could be caused by propagating star formation on the periphery of an expanding H i ‘superbubble’. If so, then (relative to its parent galaxy) it would be one of the largest and most energetic examples found to date.
In order to unravel some of these mysteries, and to gain a better understanding of the morphology and evolution of NGC 157, we have made the first H i map of NGC 157; obtained new wide-field , , and H imaging; and mapped the kinematics in detail of the inner disk using H Fabry-Perot interferometry. Details of these observations, and their reductions, are given in Section 2. An analysis of the galaxy’s kinematical and morphological parameters is presented in Section 3. Our interpretation of these new results is discussed in Section 4, and a summary of our conclusions follows in Section 5.
2 Observations
2.1 H I Mapping
NGC 157 was observed with the two lowest-resolution configurations of the Very Large Array (VLA) of the National Radio Astronomy Observatory (NRAO). A total of 3.7 hours on-source integration time was obtained with the C-array on 1994 October 27, and a further 2.8 hours with the D-array on 1995 May 26. The primary flux density (and bandpass) calibrator was 3C48, assumed to have a flux density of 16.12 Jy at 1.413 GHz. The nearby radio source 0022002 (J2000) was used as a secondary calibrator to monitor variations in the gain and phase. To be sure of covering the full projected velocity width of NGC 157 (324 km s-1; SSD) at modest resolution (10.4 km s-1 after on-line Hanning smoothing), the two Intermediate Frequencies (IFs) were configured to 64 channels each with 1.56 MHz bandwidth. By tuning the IFs to two closely-spaced frequencies (Table 1) spanning that of the redshifted H i line, it was possible to accommodate the full profile width, with a few channels of continuum at either end of the band, and with 8 channels of overlap between the IFs.
| Parameter | Value |
|---|---|
| (J2000 pointing centre) | |
| (J2000 pointing center) | |
| Distance adopted | 20.9 Mpc |
| Natural-weighted beam FWHP | ( kpc) |
| Uniform-weighted beam FWHP | ( kpc) |
| Channel map rms noise (natural) | 0.6 mJy beam-1 |
| Channel map rms noise (uniform) | 1.3 mJy beam-1 |
| Continuum map rms noise (uniform) | 0.3 mJy beam-1 |
| IF 1 central frequency | 1412.9 MHz |
| IF 2 central frequency | 1411.6 MHz |
| Channel increment (unsmoothed) | 5.2 km s-1 |
The C-array and D-array -datasets were processed separately using implementations of the NRAO aips software at the NRAO Array Operations Centre and at the Australia Telescope National Facility. The visibility data were calibrated using standard VLA procedures, and bad data removed interactively. After combining the two datasets in the -plane, the imaging task MX was used to construct a cube of dirty channel maps for each of the two IFs, as well as cubes of the corresponding dirty beam shapes. At this stage, the two cubes were ‘sliced’ into their constituent channel maps, and then a ‘supercube’ was constructed by stacking all available maps in order of increasing frequency. After dropping some channel maps at either end of the IF bandpass with low signal-to-noise ratio, we were left with 112 usable channel maps in the supercube spanning 581 km s-1.
A total of 20 channels to either side of the main profile containing only continuum emission were averaged together to form a master dirty continuum image, and then this image was subtracted from every map in the supercube. Although continuum subtraction in the -plane is always preferable over subtraction in the image domain (Killeen 1993), the need to combine two IFs made this impractical. In any case, since , and the continuum emission from NGC 157 itself is not particularly strong, this method of continuum subtraction worked extremely well.
Because they highlight different structural features of NGC 157, two distinct supercubes were constructed using different weighting schemes in the imaging process. Uniform weighting yields the best possible spatial resolution, while natural weighting offers improved sensitivity to extended, low surface brightness emission, both of which turn out to be important in understanding the nature of NGC 157. In each case, the pixel scale was chosen to allow at least 3 pixels across the synthesized beam minor axis (Table 1), and the map size to match the VLA primary beam at 1.4 GHz ( arcmin). By comparing the total CLEANed flux density with the improvement in rms noise obtained, as a function of the number of CLEAN iterations performed using the APCLN task, we elected to perform 200 CLEAN iterations on each map of the natural-weighted supercube, while the uniform-weighted data was found to require no further CLEANing.
Following primary-beam corrections, and conversion from frequency to optical heliocentric velocity, moment maps (H i column density, velocity, and velocity width) were constructed from each of the two supercubes, using masks derived from a spatially and spectrally smoothed version of the supercube, and by setting a flux cutoff that just enabled a clean separation of the H i emission from background noise. Beam full-widths at half power (FWHP) and rms noise levels in the final CLEANed maps are summarised in Table 1.
2.2 Optical Imaging
NGC 157 was observed under photometric conditions with the Kitt Peak National Observatory 0.9-m telescope on 1995 July 3 UT. A Tektronix CCD was used at with the doublet corrector, making available a field of 23.2 arcmin 23.2 arcmin at 0.68 arcsec pixel-1. Two 500 s exposures in , and two 300 s exposures in were obtained, together with short bracketing exposures of Landolt’s (1983) Field 109. On the previous night, NGC 157 was observed once for 1000 s in the KP1564 (6618 Å central wavelength, 74 Å FWHM) H filter, and also for 1000 s in the KP808 (6411/88) red continuum filter. Images of Cygnus OB2 No. 9 (Massey et al. 1988) with the KP1564 filter served as a flux calibration for the H data.
Following removal of the bias level and structure, attempts were made to flatfield the data using dome flatfields, twilight sky flatfields, or both, but residual structure at the 5 per cent level was still apparent near the edges of the frames. Finally, low-order polynomial fits to these border regions were computed and used to normalise both the object and calibration frames. Aperture photometry of the broadband standards over a large range in airmass allowed us to compute photometric zero points, extinction, and colour-correction terms. Each pair of and images of NGC 157 were averaged together, after scaling to a common modal value in the central regions, and registration using field stars. The red continuum image of NGC 157 was convolved to the same stellar FWHM as the H image, registered using field stars, multiplied by a factor of 1.2 (the ratio of the continuum to line filter full widths), and then subtracted from the KP1564 image, leaving just the pure H emission.
2.3 H Fabry-Perot Interferometry
The two-dimensional velocity field for the ionized gas in NGC 157 was obtained at the 6-m telescope at the Special Astrophysical Observatory of the Russian Academy of Sciences on 1995 October 24, when the seeing averaged 2.5 arcsec. A scanning Fabry-Perot interferometer was installed in the pupil plane of a focal reducer which was attached to the prime focus of the telescope (yielding an output beam). The detector used was a pixel intensified photon-counting system. The interferometer was operated in the 501st order at 6562.8 Å, and a narrow-band (10 Å) filter at the appropriate H redshift served to block adjacent orders. A total of 32 images (each 4 arcmin 4 arcmin) were obtained with a velocity increment of 18.84 km s-1, with 3 minutes of integration at each velocity step. A neon emission line at 6598.95 Å was used for wavelength calibration. The raw observational data were rebinned to cubes of pixels, with an image scale of 0.92 arcsec pixel-1 and a spectral resolution of channels ( km s-1). Following the steps outlined in Le Coarer et al. (1992) and Laval et al. (1987), standard reduction procedures (corrections for phase shifting, subtraction of the night-sky emission-line spectrum, construction of the velocity field, etc.) were performed using the ADHOC Fabry-Perot software package developed at the Marseille Observatory (Boulesteix 1993).
3 Results and Analysis
3.1 H I distribution
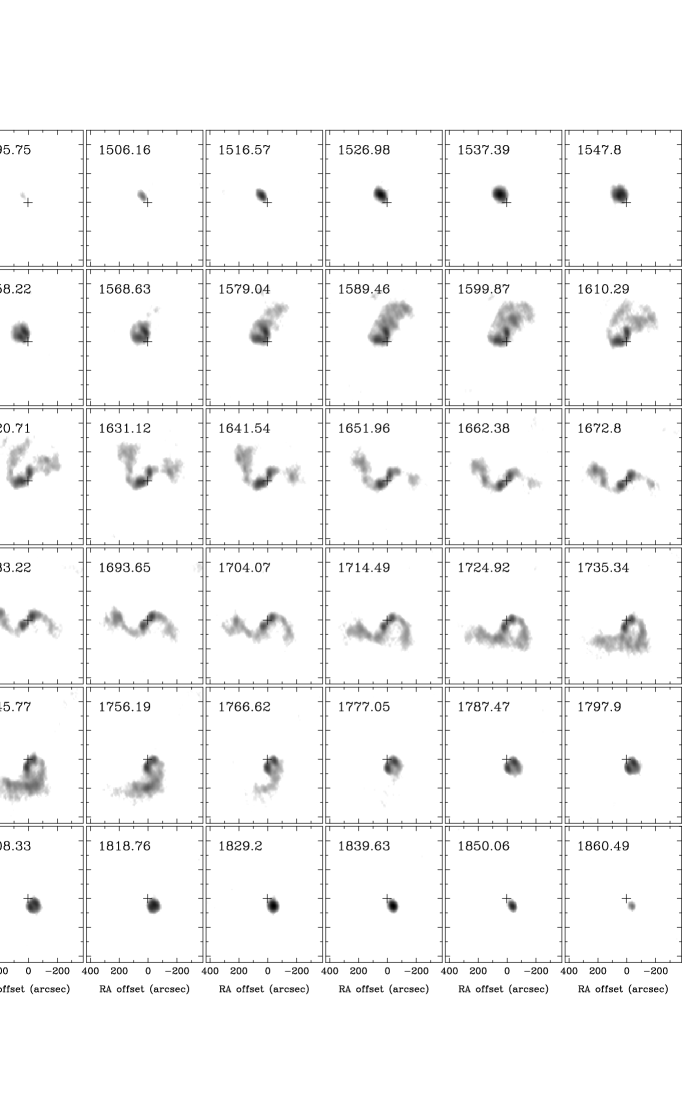
The resulting channel maps from the natural-weighted supercube are shown in Figure 1. Already, there are indications from this sequence of maps of some peculiarities in the H i structure and dynamics; namely the existence of an extended gas disk beyond the optical radius ( arcmin; de Vaucouleurs et al. 1991, hereafter RC3) of this galaxy, and from the bending of the isovelocity features, an associated warping of the gas disk.
Before considering this disk in more detail, it is prudent to examine the extent to which we may be losing flux and large-scale structure due to missing baselines. To do that, we have computed the global H i profile for NGC 157 by using a moving window to optimise the emission measured within each channel map of the natural-weighted supercube, and plotted the fluxes versus the respective map velocity in Figure 2. Our profile matches well the general form of those published by SSD and by MFB, particularly the ‘shoulders’ at km s-1 and km s-1, although our peak measured fluxes are slightly higher. A comparison of our profile moments (integrated flux, , etc.) with those from SSD and MFB appears in Table 2. We take the good agreement shown there as evidence that our VLA observations are not resolving out a significant low column density component, at least within the arcmin single dish beamwidths.
The shape of the spectrum can be shown to be the result of the superposition of two spatially distinct components in the gas distribution. The dotted and dashed lines in Figure 2 are spectra that were obtained by separately summing the regions inside and outside, respectively, of the mag arcsec-2 isophote. A similar result is obtained if the summation is done using a mask chosen to separate the ‘warped’ component of the H i (Section 3.2). The flux ratio of the two components is . Their systemic velocities differ slightly, being and km s-1 respectively.
A flux integral of Jy km s-1 corresponds to a total mass of H i of M⊙ for the distance of 20.9 Mpc (Tully 1988) adopted here. Taking the absolute blue magnitude for NGC 157 to be (Section 3.5), we therefore find , quite typical of an Sbc-type galaxy (Roberts & Haynes 1994).
| Parameter | Staveley-Smith & Davies 1987 | Mathewson et al. 1992 | This Study | |||
|---|---|---|---|---|---|---|
| Flux Integral (Jy km s-1) | 62.6 | 5.5 | 72.8 | 7.1 | 78.0 | 4.0 |
| (km s-1) | 1669 | 7 | 1655 | 7 | 1682 | 12 |
| (km s-1) | 324 | 14 | 336 | 14 | 326 | 10 |
aMean of velocities where the H i profile falls to 20 per cent of the peak flux (Staveley-Smith & Davies 1987; this study), or 50 per cent of the peak flux (Mathewson et al. 1992)
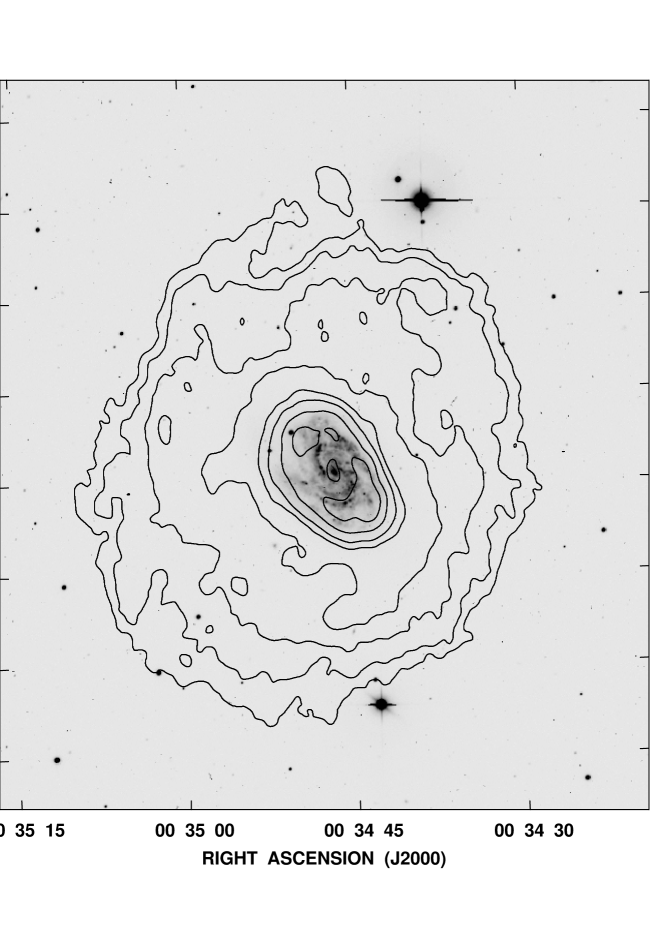
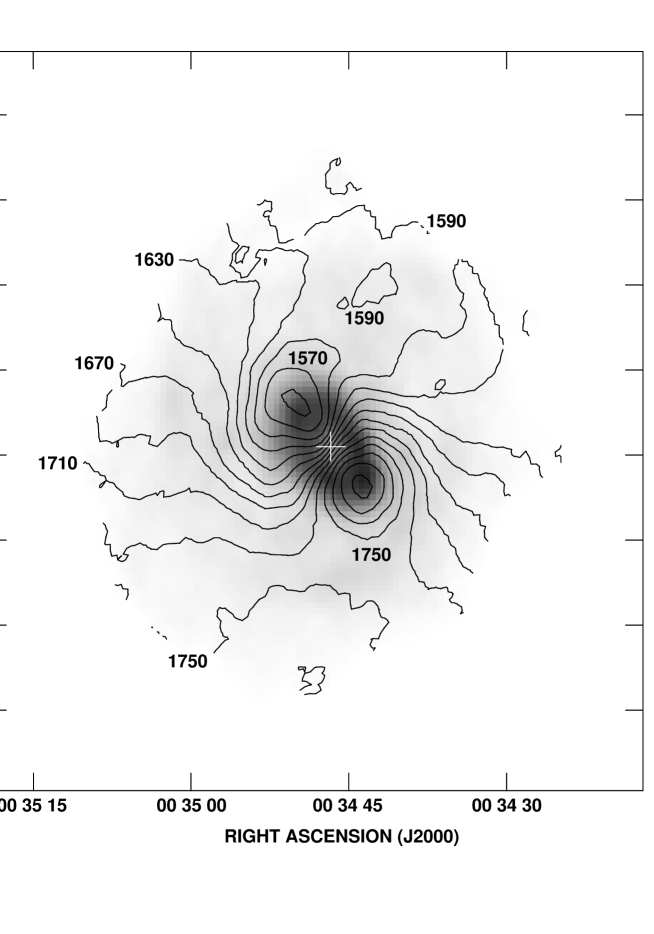
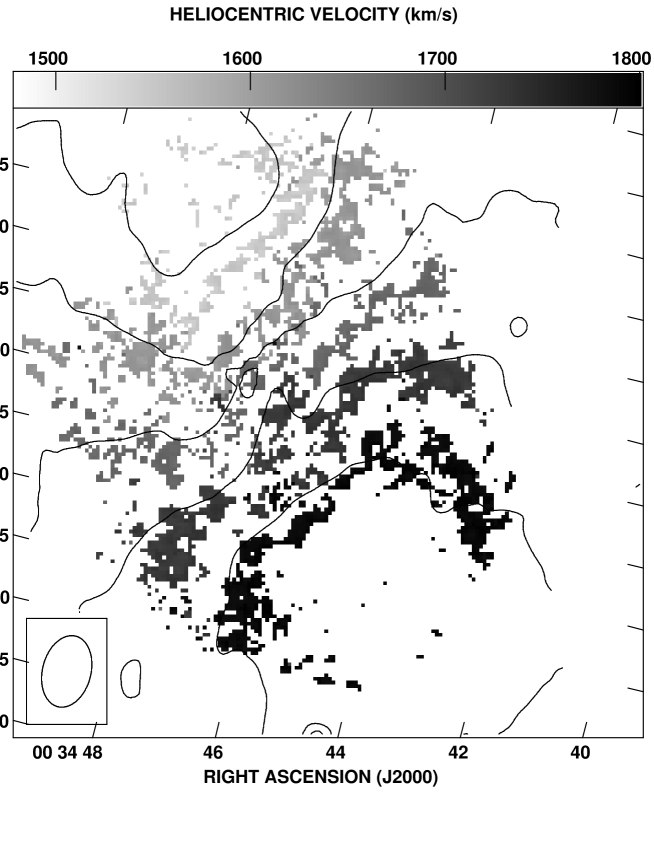
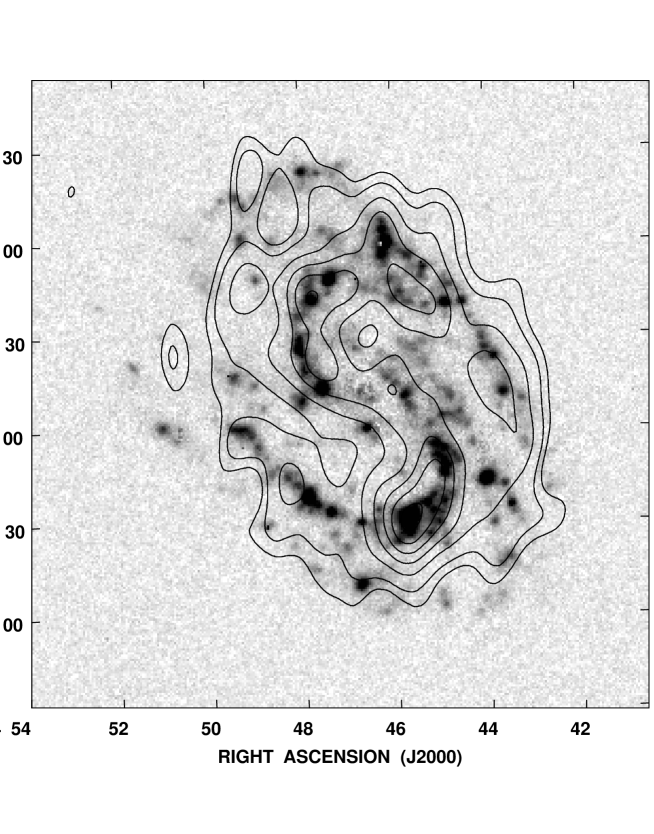
The H i column density distribution (zeroth moment) is shown as contours superimposed upon a section of the KPNO 0.9-m -band image in Figure 3, and as a grey-scale in Figure 4. The impression of an extended H i disk in NGC 157 gained from the channel maps is confirmed by these images, with the outermost contour, representing a projected H i column density of cm-2 (0.4 M⊙ pc-2) spanning some 11 arcmin, or over 2.5 times the optical diameter. The flux cutoff imposed in defining the edge of the H i disk is roughly at the noise level of the moment fitting; however, in blanking off the low signal-to-noise regions, we were guided also by the smooth continuity of the velocity field in the outer disk (Figure 4). NGC 157 possesses a central H i ‘hole’ of the sort commonly seen in spiral galaxies, and the projected gas column density reaches a peak in a ring underlying the spiral arms. An arm or tail-like feature appears to be breaking free from the northern edge of the H i disk in Figure 4.
The apparent offset between the major axis position angles of the optical and gas disks in Figure 3 seems to be the result of a change in the orientation of the disk orbits between the inner and outer disk. The isovelocity contours in Figure 4 show the kinematic line-of-nodes precesses through between the edge of the optical disk and the limits of the outer gas disk. At this resolution, the inner disk displays the characteristic pattern for an inclined disk in differential rotation, albeit with an abrupt turnover in the projected velocity as a function of radius (discussed in Section 4.3). In the outer disk, the isovelocity contours meander in a fashion typical of galaxies with a warp. There are also kinks in these contours consistent with the action of a density wave as mentioned earlier.
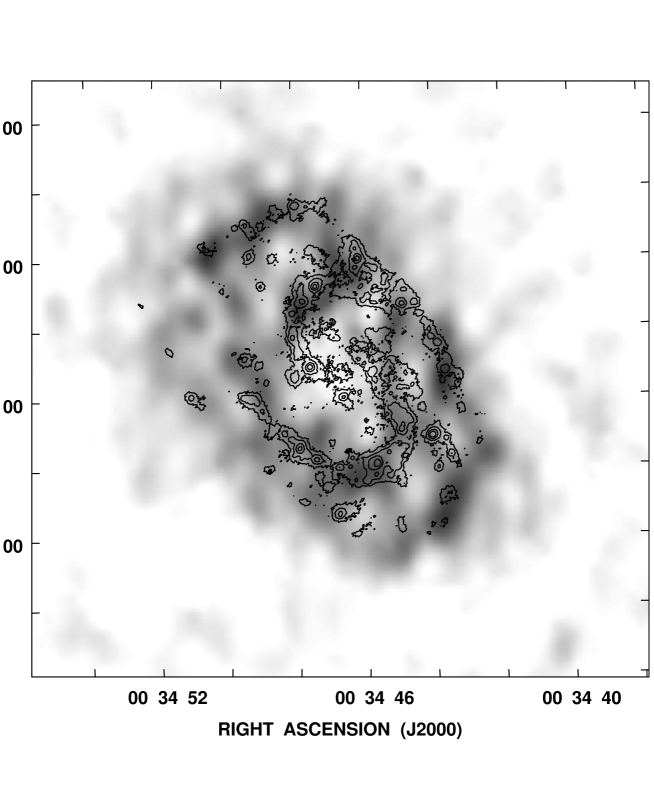
A higher resolution map made with uniform-weighting (Figure 5) resolves out nearly all of the extended outer H i disk, but does highlight some interesting structure within the inner disk. The inner gas ‘ring’ is now revealed to be composed of a honeycomb-like lattice of rings and cells. Although initially chaotic in appearance, the peaks in the gas surface density making up the ridge-lines of these ‘cells’ are shown to be intimately associated with the spiral arms and other sites of massive star formation, when contours of the H surface brightness are superimposed. The H ring to the northeast of the galaxy discussed by ZK is seen to have a distinct H i counterpart, as do many of the other major star-forming complexes in NGC 157. At the highest resolution offered by the H i data, the individual cells have diameters between 2 and 4 kpc, and deprojected H i column densities peaking at M⊙ pc-2 on the cell ‘walls’, dropping to as low as M⊙ pc-2 at the centres. The correlation of star formation activity with local gas surface density in NGC 157 is somewhat better than that typically observed in spiral galaxies (e.g., Ryder et al. 1995; Rownd et al. 1994), and is more like that observed in the shells of the dwarf irregular galaxy Holmberg II (Puche et al. 1992), although there is no suggestion that the gas ‘cells’ in NGC 157 are expanding coherently.
The azimuthally-averaged column density of H i as a function of radius in the naturally-weighted zeroth moment map is plotted in Figure 6. Since the intention here is to indicate the column density of gas in the disk of the galaxy that would be seen from ‘face-on’, we have adopted a fixed inclination ( based on the results of Sections 3.2 and 3.5 as well as Grosbøl (1985)) and position angle () and then calculated the deprojected column densities accordingly. The arrow in Figure 6 indicates the radius corresponding to the mag arcsec-2 isophote (), and just on half of the total H i content of NGC 157 lies outside this radius. The point at which the H i surface density falls below 1.0 M⊙ pc-2 equates to , an H i-to-optical extent bettered by only 5 of the 23 comparable galaxies studied by Broeils & van Woerden (1994; hereafter BvW).
3.2 H I kinematics
We determined a rotation curve from the velocity field by using an aips implementation of the ROTCUR algorithm (Begeman 1989) to fit rings of variable inclination and position angle under the assumption of uniform circular motion in each ring. To begin with, we analysed only the regions within the optical extent of NGC 157 using our highest resolution (uniform-weighted) velocity field, sampled at approximately one synthesized beamwidth (15 arcsec) intervals. By adopting starting values for the kinematical parameters (dynamical center position, systemic velocity, and disk tilt and position angle) drawn from RC3 and our own surface photometry (Section 3.5), and allowing all of these parameters to vary freely, we arrived at the following values for the dynamical center: km s-1, , . These results are in close agreement with the position of the optical centre (shown as the pointing centre in Table 1) and the systemic velocities from the midpoint of the global H i profile (Table 2).
The analysis was then repeated with the dynamical center held fixed at these values, so that the combinations of rotational velocity, inclination, and position angle (kinematic line-of-nodes) which minimised the systematic velocity residuals within each ring could be studied. Fixing the dynamical centre also allows us to compare the results from fitting the entire disk with those that come from fitting only the ‘receding’ side (i.e., mostly the southern half) or the ‘approaching’ (northern) side, which then highlights any asymmetries in the disk kinematics. This same procedure can be applied to the full H i disk kinematics as revealed by the natural-weighted data, although at a somewhat coarser resolution (35 arcsec). The dynamical centre in this case is found to lie within 2 arcsec and 1 km s-1 of that found earlier, so has been fixed at identical values.
The end result of both of these analyses is shown in Figure 7, in which points within 120 arcsec of the centre are drawn from the uniform-weighted fit, and those further out are from the natural-weighted data. Clearly, the continuity between these two is extremely good, and the major differences are in fact between the two halves of the disk. The principal feature of the rotation curve is a strong decline that begins just inside . The exact shape of the decline is somewhat uncertain because the fits to the northern (receding) half failed to converge in the transition region, and the two halves of the disk give rather different results for arcsec. However, the fits to the full disk and southern half do agree in the transition region, and all three fits agree for arcsec. At this point, the circular velocity seems to have settled to a constant value at km s-1 (55% of the maximum rotational velocity), and the inclination is only slightly higher than that attained in the inner disk.
Although the steady progression in position angle is characteristic of a warp, the rotational velocity drops by almost half in less than 1 arcmin, while the inclination varies by no more than in this region. The drop in velocity is even faster than Keplerian for arcsec, though such behaviour is permissible for a disk with a sharp edge (Section 4.4.2).
3.3 Ionised Gas Kinematics
Figure 8 shows a comparison of the H Fabry-Perot velocity field with the highest resolution velocity field available from the uniform-weighted H i data. Owing to the differing resolutions, and the complexity of the H velocity field, only selected velocity ranges and isovelocity contours for the H i data are shown. There appears to be a discrepancy between the velocity scales of perhaps km s-1, but this is within the spectral and spatial resolutions of the two datasets. Otherwise, the agreement between the neutral and ionised gas kinematics in tracing structure within the inner velocity field is remarkably good.
A rotation curve was derived from the two-dimensional velocity field using the ROTCUR algorithm described in Section 3.2. Preliminary fits indicated a rotation centre again coincident with the optical nucleus, but a systemic velocity of km s-1, consistent with the velocity offset just mentioned and still within the range of H i systemic velocities in Table 2. Keeping these parameters fixed, the best-fitting combination of rotation velocity, inclination and position angle have been evaluated, and plotted as solid lines in Figure 7. Unusual structure in the nuclear velocity field, possibly associated with a bar (Section 4.2), makes fitting the rotation curve there difficult, but in the range arcsec, consistency between the H, H i, and photometric orientation parameters is excellent.
The H rotation curve rises relatively slowly, as a higher inclination is initially favoured, but then accelerates as the inclination drops toward the angle of the inner disk. It then levels off at the same peak velocity ( km s-1) attained by the H i. A bulge component may be responsible for the steep central velocity gradient. It is worth noting, however, that the inner maximum of the rotation curve cannot be accounted for by a combination of a King-profile bulge (even if it is sharply truncated) and the disk, but can be fit by the combination of a steep, inner exponential disk and a flatter, outer disk (Blackman 1979; Section 4.4.2).
3.4 1.4 GHz continuum
Since only one of the IFs contained a significant number of line-free channels, the aips task MX was used for both imaging and CLEANing of the 1.4 GHz continuum (in preference to the continuum map yielded as a by-product in Section 2.1, which was formed by averaging in the image plane of non-contiguous channels, and which could only be CLEANed over a limited area). A total of 17 channels was extracted from IF 2 of the -dataset, Fourier transformed to the image domain using uniform-weighting, and then subjected to 1000 iterations of the CLEAN algorithm using a similarly-extracted dirty beam. Contours of the 1.4 GHz continuum emission have been superimposed on top of the H image of NGC 157 in Figure 9.
As was the case with the H i (Section 3.1), there is a close, though not strict correspondence of the radio continuum flux density with the H surface brightness. A continuous ridge of emission underlies both the major spiral arms, passing through the nucleus and reaching a peak midway along the southern arm, but with an abrupt break shortly thereafter. Diffuse emission is seen to fill the entire optical disk, but does not extend much beyond this. All of this is consistent with the origin of the continuum emission being mostly from relativistic electrons diffusing along galactic magnetic field lines, but with some contribution from the thermal component from H ii regions. Interestingly, the radio continuum contours conform also to the shape of the northern ring seen in H i and in H.
An unresolved radio continuum source of some 146 mJy lies just over 5 arcmin southeast of the nucleus of NGC 157. It has no counterpart in existing radio or optical catalogues. The source lies well outside the optical disk, but is just inside the detectable limit of the H i disk. Because of the high galactic latitude of NGC 157 (), this object is almost certainly at a greater redshift than NGC 157. This opens up the tantalising possibility of measuring H i absorption, and thus the gas spin temperature, in a part of the gas disk where such measurements are rare.
We have searched for signs of such absorption in both the full -dataset, and in the continuum-subtracted cube, but to no avail. Such a null result is perhaps to be expected, given the conclusion of Dickey, Brinks & Puche (1992) that even the longest baselines of the VLA C- and D-arrays (3 km maximum) are inadequate for resolving out the H i emission fluctuations across the continuum source. Followup observations with the VLA A- or B-array may yet however succeed in placing limits on the gas temperature in the very outer parts of the gas disk in NGC 157.
3.5 Surface photometry
The gasp software package was used to compute radial surface brightness profiles and disk orientation parameters for NGC 157 in a manner similar to that described by Ryder & Dopita (1994) for a large sample of southern spiral galaxies. The , , and continuum-subtracted H images were first block-averaged to 1.36 arcsec pixel-1, after which the cores and extensive halos of the two bright foreground stars visible in Figure 3 were masked out. The sky background was determined from the modal peak of the histogram of all data values within 20 pixels of the image border, and found to be and mag arcsec-2 in and respectively.
For a given semi-major axis, gasp iteratively attempts to fit ellipses to the galaxy image, varying the ellipticity and position angle (while holding the ellipse centre fixed at the position of the nucleus) so as to minimise residuals about the mode of the pixel values around the ellipse perimeter. The semi-major axis is increased by 15 per cent each time (the increased number of pixels sampled at each radius partly compensating for the reduced signal-to-noise in the outermost pixels), until a level equal to the measured sky background is reached.
The modal surface brightnesses from separate and analyses, corrected for atmospheric (but not Galactic or internal) extinction, are plotted in Figure 10. Also shown on this plot is the mean surface brightness in H (with mag arcsec-2 being equivalent to an H flux density of ergs cm-2 s-1 arcsec-2) computed at each radius using the ellipse parameters from fitting to the -band image. The variation in ellipse inclination and position angle as a function of radius in the band (less affected by dust than ) has also been plotted in Figure 7 for comparison with those determined from the gas kinematics.
Blackman (1979) reported the presence of an extra linear outer component, in addition to the inner bulge and exponential disk. His reduced luminosity profiles are not directly comparable to our radial surface brightness profiles, but Figure 10 does confirm the existence of a second exponential disk in the range ( arcsec), with a longer scale length than the inner exponential disk, which covers ( arcsec). This outer exponential disk also coincides with the transition region between the inner and outer H i disks, as well as the region of most rapid turnover in the rotation curve.
The integrated intensity out to the sky background yields apparent magnitudes in and of and respectively. After corrections for Galactic extinction (A; Burstein & Heiles 1984) and for extinction internal to NGC 157 at an inclination of (Tully & Fouqué 1985), we arrive at corrected total magnitudes (in the RC3 convention) of and . Adopting the same distance (20.9 Mpc) as used for the total H i mass determination yields an absolute magnitude M, and thus a total blue luminosity of . Our value is consistent with equivalent tabulations in RC3 and Tully (1988), although the individual magnitudes and extinction corrections do differ. MFB found some 0.3 mag fainter than us, though the integrated magnitudes are in much better agreement, so much of the difference lies in the (still contentious) corrections for extinction.
The continuum-subtracted H data was similarly integrated out to , resulting in a total flux in the H line of ergs cm-2 s-1 ( for the adopted distance). This includes a correction for atmospheric extinction, as well as the 1.1 mag of internal extinction applied by Kennicutt (1983) in his study of the star formation rate (SFR) in normal disk galaxies. Using the same conversion formulae from H luminosity to SFR as Kennicutt, we estimate a total SFR for massive stars () of 1.6 M⊙ yr-1, and over all stellar masses (0.1 M M⊙) to be yr-1. Normalising yields the following (distance-independent) quantities: ; ; and . Consequently, although the absolute present-day SFR is not unusual for its type (Sbc), relative to its size and mass, NGC 157 is nearly twice as active in forming stars as galaxies of similar type and colour (Ryder 1993).
This enhancement of H emission is confirmed by the far-infrared to H luminosity ratio, . The value of obtained from data after reducing to the adopted distance is 10.34 (Young et al. 1989); hence , whereas for bright galaxies of a similar colour, typical ratios are in the range (Zasov 1995). Note that , observed in NGC 157, is quite normal for late-type spiral galaxies (Young et al. 1989; Zasov 1995), in contrast to the normalised H star formation rates. Using the relationship between star formation rate and far-infrared luminosity (; Zasov 1995), we obtain yr-1. No H emission was detected in the extended H i disk, to a limit of ergs cm-2 s-1 arcsec-2, implying that the massive star formation rate ( M⊙) there cannot exceed M⊙ pc-2 Gyr-1.
4 Discussion
4.1 A superbubble in NGC 157?
Given that one of the primary motivations for this study was the possible existence of a major H i superbubble in the disk of NGC 157, how convincing is the new evidence for or against such a feature? Normally, the strongest evidence for such superbubbles comes from the localised distortions they introduce to the global velocity field (Ryder et al. 1995), and yet the isovelocity contours in Figure 4 (as well as the higher resolution images) exhibit a remarkable degree of symmetry about both the major and minor axes. Examination of the position-velocity diagrams in this region also indicates no unusual profile splitting or deviations attributable to the action of an expanding superbubble, although the fact that the projected rotation velocity is changing rapidly in this particular region complicates such an analysis.
How then are we to explain the abrupt change in velocity across the northeast ring seen by ZK in H? We have made cuts through the uniform-weighted H i cube at similar position angles (e.g., ; Figure 11), and find that beyond 45 arcsec along the northeastern (approaching) axis, there is indeed a drop of almost 40 km s-1 in velocity which, when deprojected by the same inclination () used by ZK and Burbidge et al. (1961), results in a total drop of km s-1, as reported by ZK. The H i cut however shows a similar drop on the opposite axis beyond 60 arcsec, by which point ZK were unable to detect any more optical emission. Thus, the velocity discontinuities reported by ZK are real, but are caused by something other than the action of an H i superbubble.
4.2 The bar in NGC 157
Surface photometry in the near infrared () bands has recently been published by Elmegreen et al. (1996a, b), who make the case for a bar component, with a flat luminosity profile going out to one-quarter of . Sempere & Rozas (1997) have carried out numerical simulations of the interstellar medium in NGC 157 under the action of a bar-driven spiral density wave, and predicted the locations of several resonances accordingly.
In an effort to see how the kinematics may be influenced by the action of a bar, we have sampled both the H and H i velocity fields along the kinematic minor axis (), and binned the data into 15 arsec intervals, to match the resolution of the H i data. As Figure 12 shows, both the neutral and ionised gas components exhibit almost sinusoidal variations about the systemic velocity along the minor axis. Assuming the spiral arms to be trailing, then the observed rotation pattern implies that the southeast side of the disk is closest to us. Consequently, the negative velocity residuals in Figure 12 along the southeast half of the minor axis indicate gas flowing towards the observer, and therefore an outflow, rather than the gas inflow more commonly assumed to be associated with the action of a bar. Thus the nuclear kinematics appear to be dominated by the presence of a mild starburst, rather than any associated bar.
4.3 The turnover in the rotation curve of NGC 157
The extent and abruptness of the decline in rotation velocity in NGC 157 would, if proved, make it one of the most unusual rotation curves yet seen. The prevalence of flat rotation curves as seen in the ionised gas (Rubin, Ford & Thonnard 1978) and in the extended H i (Bosma 1978) has been taken as one of the strongest arguments in favour of the existence of a dark matter halo around all spiral galaxies. To date, only a handful of galaxies are observed to have truly declining H i rotation curves, consistent with having reached the edge of the total mass distribution; these include NGC 2683 and NGC 3521 (Casertano & van Gorkom 1991), NGC 7793 (Carignan & Puche 1990), NGC 1365 (Jörsäter & van Moorsel 1995), and NGC 4244 (Olling 1996). However, NGC 157 is somewhat more unique, in the sense that the decline in rotation velocity is both rapid and severe, and yet the outermost part of the rotation curve is still relatively flat, indicating that the mass distribution continues well beyond the last measured point.
There are a few galaxies where optical observations have also revealed a decline in the line-of-sight velocities; for example NGC 4303, NGC 4321 (Distefano et al. 1990), NGC 4254, and NGC 4536 (Sperandio et al. 1995; Afanasiev et al. 1992). However, none of these cases show a decline as abrupt as we have found in NGC 157. More importantly, in all cases cited, the decline is seen only on one side of the nucleus, and often the decline is not visible in the H i rotation curve (e.g., NGC 4254; Distefano et al. 1990). In contrast, our H i data are in good agreement with ZK’s measurements, and while the optical decline is seen on only one side of the galaxy, the decline is seen at the same radius on both sides of the galaxy in H i.
Before attempting to model the mass distribution, we must be confident that Figure 7 is a fair and accurate representation of the disk rotation and orientation parameters in NGC 157. It could be argued that a more likely scenario is that the rotation curve stays flat, and the change in projected rotation velocity seen in the outer disk is entirely due to variations in and . In Figure 13, we have fixed at 200 km s-1 (close to the maximum value attained in the inner disk) for arcsec, and used the ROTCUR routine to again find the combination of and that minimises the circular velocity residuals. These residuals average 9.6 km s-1, only slightly larger than the 7.9 km s-1 residuals attained with the free fit shown in Figure 7.
The warp behaviour of the line-of-nodes is almost unchanged, but the inclination is forced to drop as low as in order to sustain such a high rotation velocity. Requiring a constant rotation velocity of only 180 or 160 km s-1 results in a minimum inclination of and respectively. The field galaxy calibration of the Tully-Fisher relation (Pierce & Tully 1992) for M implies a still higher maximum rotational velocity of km s-1. To match this velocity with a flat rotation curve would require in the inner disk, dropping to as low as at arcsec. Thus, it appears that the outer H i velocity is unusually low, rather than the inner H i velocity peak being anomalously high, for a galaxy of this magnitude. These low inclinations are consistent with the axis ratios of the outer H i contours (Figure 3), but countering this is the fact that the -band surface photometry does not support such low inclinations in the region arcsec. At these radii, the spiral arms do not strongly disturb the isophotes, and to account for the difference by intrinsic ellipticity of the disk requires , an extreme value (cf. 0.05; Rix & Zaritsky 1995). Thus, unless the gas and the stars are somehow ‘decoupled’ (e.g., Section 4.4.2), and orbit in totally different planes, the rotation curve must decline significantly in this region.
One other possibility is that gas orbits in the outer disk of NGC 157 are intrinsically elliptical, violating one of the principal assumptions of the ROTCUR analysis, and casting doubt on the derived inclinations. Non-circular gas motions are often seen in the central regions of galaxies, usually arising through the influence of a bar. These effects are usually restricted to the region near the bar (though there are exceptions in cases where a resonance is set up between the orbital epicyclic frequency and the bar pattern speed: Ryder et al. 1996); outside of this, streaming motions along the spiral arms dominate perturbations from uniform circular motion. In NGC 157, the bar component proposed by Elmegreen et al. (1996a, b) and by Sempere & Rozas (1997) is a small-scale feature, extending to a radius of only (30 arcsec), so it can be discounted as the source of the velocity peak in the rotation curve (Section 4.2).
To check the effects of elliptical orbits at large radii, we computed a few model velocity fields and analysed them with ROTCUR. The elliptical orbits were not computed from an assumed potential, but as Lissajous figures, the sum of two simple harmonic oscillators. We compared orbit ellipticities () of and , for a flat km s-1 rotation curve and a declining curve, computed from the Brandt (1960) formula for arcsec, km s-1and . The calculations were done for disks inclined at and to the line of sight. For this small grid of models, the shapes of the outer-disk isovelocity contours remained almost unchanged by taking the orbits to be oval, but the amplitude of the radial velocity variations was increased. ROTCUR correctly fitted the inclination and position angles, but for the elliptical-orbit velocity fields it returned circular velocities % higher than the input value. For the declining rotation curve case, ROTCUR had difficulty in fitting the inclination, and did not give consistent results from ring to ring, or for different initial parameters. However, is an extreme value, and given the lack of any effect in the other test cases, we think that the velocity field of NGC 157 can be well modeled by circular orbits.
Finally, we note that although he had no knowledge of the extended H i disk (nor its unusual kinematics) in NGC 157, Blackman (1979) did investigate the predictions of the spiral density wave theory by assuming a declining rotation curve outside of , of the form popularized by Brandt (1960). He found that such a rotation curve yielded a theoretical spiral pattern in much better agreement with the actual spiral arm pattern than did a flat rotation curve in the outer regions. Although this approach involved many simplifications, it does provide yet another clue in favour of the declining rotation curve.
In summary, the velocity field is probably not strongly affected by peculiar motions, but the difficulties in separating the effects of inclination and rotation velocity remain, and all we can really say is that the actual rotation curve behaviour almost certainly lies somewhere between the two extremes shown in Figures 7 and 13. We can then use these to place upper and lower bounds on the various mass models.
4.4 Mass Models of NGC 157
In this section, we consider some scenarios that could account for the peculiar velocity field/rotation curve in NGC 157.
4.4.1 ‘Missing’ Dark Matter?
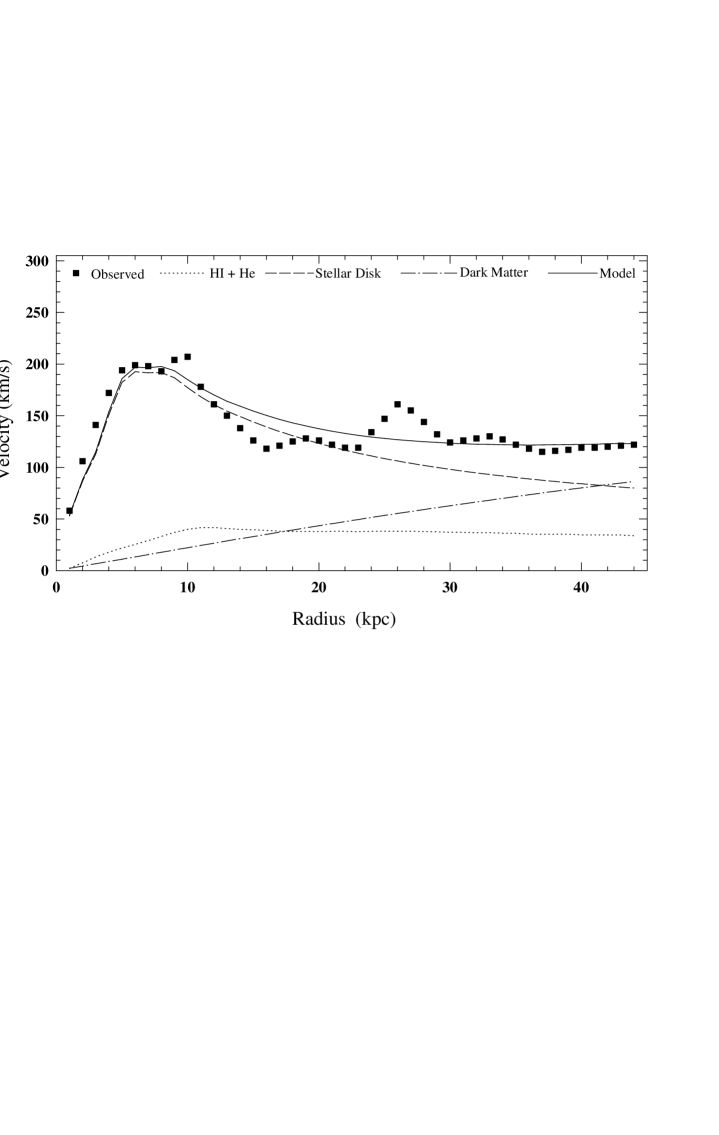
We begin with the standard ‘maximum-disk’ model for fitting the declining and flat rotation curves, using the procedure described in Walsh, Staveley-Smith, & Oosterloo (1997). The relative contributions to the overall rotation due to the stellar component, the gas surface density ( multiplied by 1.3 to account for the presence of He), and a pseudo-isothermal halo have been calculated using a least-squares fit to the observed rotation curve. A summary of the best fitting parameters is given in Table 3, and the fit to the rotation curve with the turnover is plotted in Figure 14. The mass of the gaseous disk is M⊙, and the stellar disk has M⊙ (with a stellar of 1.4). The gas mass-to-stellar mass ratio is therefore quite normal at 5%.
| Declining R.C. | Flat R.C. | ||
|---|---|---|---|
| Parameter | km s-1 | km s-1 | |
| (M⊙/L⊙) | 1.4 | 0.84 | 0.94 |
| (M⊙ pc-3) | 0.0019 | 0.0071 | 0.014 |
| (kpc) | 15 | 9.5 | 7.6 |
| ( M⊙)a | 2.1 | 3.4 | 4.3 |
aMass of dark matter contained in halo within kpc.
In the case of the declining rotation curve, the dark-to-luminous matter ratio at the last measured point is unusually low, at almost 1:1. This is almost identical to the value found in NGC 7793 (Carignan & Puche 1990), and only the massive (and distant) galaxy NGC 801 in the sample of BvW has a lower value. Based on the empirical relations of Kormendy (1990), we would have expected a central density M⊙ pc-3 and a core radius kpc for a galaxy with the blue luminosity of NGC 157. This is quite a large core radius, and once again, only the most luminous () galaxies in the BvW sample have larger core radii and lower central densities.
Even for the case of a flat rotation curve, the dark-to-luminous mass ratio still only approaches 2 at the last measured point, though such a value is more in keeping with that measured in galaxies of similar and Hubble type (BvW). In summary, a standard gas stellar disk dark matter halo model points toward NGC 157 having a low dark matter content, though not unprecedentedly so.
This raises the question of how the galaxy could have come to have a low dark matter content. Halo stripping in a cluster environment is easy enough to understand (Whitmore et al. 1988), but as noted in the introduction, NGC 157 is rather isolated. Casertano & van Gorkom (1991) found that bright (massive), compact (i.e. short disk scale length) galaxies are more likely to show declining rotation curves (usually by no more than 30% of their peak velocity), though BvW disputes the scale length dependence. NGC 157 possesses both a fast rotating and relatively compact disk, with an -band scale length of 3.4 kpc; according to Casertano & van Gorkom (1991), such galaxies will have a steeper potential well, into which dark matter is less likely to fall. Thus, if the dark matter content of NGC 157 is as low as the decline in the rotation curve suggests, then it presumably has always been low, reflecting the circumstances of its birth.
4.4.2 Truncated or Decoupled Disks
Casertano (1983) showed how a truncated exponential disk could give rise to an abrupt decline in the rotation curve just beyond the truncation radius. In particular, he was trying to account for a sudden drop in the rotation curve of the edge-on spiral galaxy NGC 5907, but photometry of such galaxies (e.g., van der Kruit & Searle 1981) had already made a strong case for truncations in the light distribution.
We have used a modified version of the disk-fitting procedure from the previous section in order to test whether a truncated disk could account for some (or all) of the drop in rotation velocity. Based partly on the findings of Blackman (1979), confirmed by our Figure 10, that NGC 157 appears to have a second, outer exponential disk, we include 2 separate disk components in our models; one truncated at some radius , and a second, less massive untruncated disk to account for the velocity of rotation at large radii. We therefore found it necessary to model the bulge component separately, using a King profile. The scale length of the inner disk was taken to be 3.4 kpc, derived from a linear fit to the -band profile of Figure 10 in the range arcsec. This disk was truncated at a radius , with the best fit obtained for kpc, i.e., disk scale lengths. To ‘soften’ the sharp fall of the density at the edge, a non-zero scale length (1 kpc) was introduced for . The parameters of the untruncated exponential disk, which dominates the density at were then varied to give the best fit to the observed rotation curve. The best fit value of the scale length was found to be 4.7 kpc, which is slightly larger than was found from the -band surface photometry (Section 3.5). The asymptotic velocity of rotation of the model halo is only 110 km s-1, which is about half of the maximum velocity of rotation of the disk.
The rotation due to each component, plus the total compared with the observed declining rotation curve, is plotted in Figure 15. The masses of individual components within three important radii are given in Table 4: kpc, which corresponds to the optical radius of this galaxy; kpc, where the halo begins to dominate; and kpc, just outside the last measured point. The dark-to-luminous mass ratio at these points grows, from 0.13, to 0.51, and finally 1.56 respectively. Thus, although the truncated disk model can successfully account for the rapid drop in rotation velocity beyond 5 kpc, the outer exponential disk and gas components together are not sufficient to sustain the rotation curve, and a dark matter halo (albeit a minimal one) is still required. Taking into account the total blue luminosity of the galaxy (Section 3.5), we obtain an unusually low (solar units) within , which further supports the conclusion that there is no significant dark halo within the luminous disk.
| Model component | Mass within ( M⊙) | ||
|---|---|---|---|
| kpc | kpc | kpc | |
| Truncated disk | 36.0 | 36.0 | 36.0 |
| Outer disk | 10.0 | 13.0 | 13.4 |
| Bulge | |||
| Gas (H i He) | 4.5 | 7.1 | 8.6 |
| Halo | 6.7 | 29.0 | 91.0 |
| Total | 57.0 | 85.0 | 149.0 |
Truncated disks are seldom evident in radial surface brightness profiles of low-inclination galaxies, most likely because of azimuthal averaging in the analysis smearing out any asymmetric edges in the younger stellar populations (van der Kruit 1988). Radial cuts across the -band image of NGC 157 shown in Figure 3 give the impression of a more abrupt drop in luminosity towards the northwest edge of the disk than elsewhere, though this is at least partly a matter of contrast with the outer edge of the northern spiral arm.
Truncated disks and warps might be related, since Sparke (1984) showed that a sharply truncated edge to the disk could be the crucial factor in sustaining vertical oscillation modes (i.e., a warp) in the presence of a halo. Of course, the disk referred to in this case is the gaseous disk, whereas it is the stellar disk that is truncated in our model; furthermore, Sparke’s model produces warps interior to the truncation. Nevertheless, the forces that give rise to one phenomenon (a warp or a truncated disk) could equally well be driving the other.
We wish to stress that the phenomenon we are interested in here is that of a truncated inner disk, rather than an actual edge to the total mass distribution (as might be produced say, by ram-pressure stripping: Gunn & Gott 1972; Kritsuk 1983) or to just the H i disk (e.g., photoionisation by the extragalactic UV radiation field: Maloney 1993; Dove & Shull 1994). All these indications of a truncated inner disk lead us to reconsider our other data under the hypothesis that NGC 157 is a loosely-coupled (or perhaps even merged) pair of disks. The suddenness of the decline in projected rotational velocity, the coincidence of this with the optical edge of the disk, and the apparent discrepancy between optical and kinematic inclinations (if we require a flat rotation curve), all lend some support to this idea.
The total H i spectrum gives conflicting evidence. The (slightly) different systemic velocities of the inner and outer H i disks would favour this scenario, but the roughly equal gas masses in the two components is a contra-indication, as the merging of equal-mass disks is expected to result in an elliptical galaxy (e.g., Mihos & Hernquist 1996, and references therein). Indeed, even minor accretions of mass are expected to cause significant heating of galaxy disks (Tóth & Ostriker 1992; Quinn, Hernquist, & Fullagar 1993; Walker, Mihos, & Hernquist 1996). On the other hand, the H i gas in the merging system NGC 520 is still recognisably ‘disky’, with a rather smooth velocity field, despite showing tidal tails, strong distortion of the optical light, and other signs of a disk-disk merger (Hibbard 1995). Similarly, NGC 4826 is thought to have survived as a disk system after a major addition of mass (Braun et al. 1994). This galaxy has an outer gas disk that counter-rotates with respect to the inner gas and stars, the two disks having identical kinematic orientation parameters. Braun et al. propose that it has formed either by a slow accretion of retrograde gas, or the merger of two disks of opposite spin, one much richer in gas than the other. While the chances of such an orderly merger must be extremely slim, other examples of counter-rotating disk components are appearing (e.g., Jore et al. 1996), so the possibility that NGC 157 is also a multiple system cannot readily be dismissed.
5 Conclusions
The new radio and optical observations of NGC 157 presented in this paper put this object among a small number of spiral galaxies whose photometric and dynamical properties have been studied in detail over a large range of radial distances - from less than one kpc from the nucleus up to nearly 50 kpc, or about 14 optical scale lengths. Although many properties of this galaxy are rather common (grand design spiral structure, the total mass of luminous components, the maximum velocity of rotation, etc.), in some other respects, NGC 157 is a most peculiar system:
-
1.
NGC 157 possesses a highly extended H i disk which is mildly warped and stretches far beyond the optical extent of the galaxy.
-
2.
The H i in the inner galaxy is not only concentrated in the spiral arms well defined by H ii regions, but also shows remarkable honeycomb-like structure in the interarm regions, which in turn gives a strong impression of ‘superbubbles’ in the disk. The azimuthally-averaged surface density of H i drops sharply in the outer part of the optical disk: it decreases by more than a factor of three in the narrow range arcsec ( kpc).
-
3.
The combined velocity field of both ionised and neutral hydrogen implies an unusual shape for the rotation curve, which begins to decline steeply in the outer part of the optical disk and continues to drop until the velocity of rotation reaches almost half of its maximum value. This points to the presence of a dark matter halo, the relative mass of which is small when compared to the mass of the stellar disk; a low ratio supports this conclusion. It is argued that NGC 157 is the only known galaxy for which a low-mass halo may be claimed with some confidence.
We have outlined various circumstances under which NGC 157 may have attained these features, including an unusually steep potential well, the combination of truncated and extended exponential disks, or possibly a merger of two equal-mass gas disks. Although we are not yet able to distinguish which (if any) of these scenarios is in operation in the case of NGC 157, we do point out that the distinctive ‘shoulders’ on the global H i profile may be useful for identifying potential analogs of NGC 157, with large and abrupt declines in their rotation curves.
Acknowledgments
We wish to thank R. Buta, D. Crocker, and M. Lewis for making it possible to acquire the optical images of NGC 157, and J. Boulesteix, S. Dodonov, and the Laboratory of Spectroscopy and Photometry of Extragalactic Objects of the Special Astrophysical Observatory for assistance with the Fabry-Perot observations and reductions. We acknowledge useful discussions with J. Bland-Hawthorn, R. Ekers, J. Higdon, P. Sackett, L. Sparke, T. Oosterloo, and D. Westpfahl. S. D. R. acknowledges support from EPSCoR grant EHR-9108761, and the receipt of a UNSW Vice-Chancellor’s Postdoctoral Research Fellowship. V. J. M. thanks the Smithsonian Institution for a Predoctoral Fellowship, and the University of Wollongong for an Australian Postgraduate Research Award. A. V. Z. and O. S. ackowledge the Russian Fund for Basic Research for partial support of this work (grant 96-02-19197). The National Radio Astronomy Observatory is a facility of the National Science Foundation operated under cooperative agreement by Associated Universities, Inc. We have made extensive use of the Lyon-Meudon Extragalactic Database (LEDA, supplied by the LEDA team at the CRAL-Observatoire de Lyon), the NASA/IPAC Extragalactic Database (NED, which is operated by the Jet Propulsion Laboratory, Caltech, under contract with the National Aeronautics and Space Administration), and the ADS Abstracts Service.
References
- [1] Afanasiev V. L., Burenkov A. N., Zasov A. V., Sil’chenko O. K., 1992, Sov. Astron., 36, 10
- [2] Begeman K., 1989, A&A, 223, 47
- [3] Blackman C. P., 1979, MNRAS, 186, 701
- [4] Bosma A., 1978, PhD thesis, University of Groningen
- [5] Boulesteix J., 1993, ADHOC Reference Manual. Observatoire de Marseille, Marseille
- [6] Brandt J. C., 1960, ApJ, 131, 293
- [7] Braun R., Walterbos R. A. M., Kennicutt R. C., Tacconi L. J., 1994, ApJ, 402, 558
- [8] Broeils A. H, van Woerden H., 1994, A&AS, 107, 129 (BvW)
- [9] Burbidge E. M., Burbidge G. R., Prendergast K. H., 1961, ApJ, 134, 874
- [10] Burstein D., Heiles C. E., 1984, ApJS, 54, 33
- [11] Carignan C., Puche D., 1990, AJ, 100, 394
- [12] Casertano S., 1983, MNRAS, 203, 735
- [13] Casertano S., van Gorkom J. H., 1991, AJ, 101, 1231
- [14] de Vaucouleurs G., de Vaucouleurs A., Corwin H. G., Buta R. J., Paturel G., Fouqué P., 1991, Third Reference Catalogue of Bright Galaxies. Springer, New York (RC3)
- [15] Dickey J. M., Brinks E., Puche D., 1992, ApJ, 385, 501
- [16] Distefano A., Rampazzo R., Chincarini G., de Souza R., 1990, A&AS, 86, 7
- [17] Dove J. B., Shull J. M., 1994, ApJ, 423, 196
- [18] Elmegreen B. G., Elmegreen D. M., Chromey F. R., Hasselbacher D. A., Bissell B. A., 1996a, AJ, 111, 2233
- [19] Elmegreen D. M., Elmegreen B. G., Chromey F. R., Hasselbacher D. A., Bissell B. A., 1996b, AJ, 111, 1880
- [20] Grosbøl P. J., 1985, A&AS, 60, 261
- [21] Gunn J. E., Gott J. R., 1972, ApJ, 176, 1
- [22] Hibbard J., 1995, PhD thesis, Columbia University
- [23] Jore K. P., Broeils A. H., Haynes M. P., 1996, AJ, 112, 438
- [24] Jörsäter S., van Moorsel G. A., 1995, AJ, 110, 2037
- [25] Kennicutt R. C., 1983, ApJ, 272, 54
- [26] Killeen N., 1993, Analysis of Australia Telescope Compact Array Data with AIPS. Australia Telescope National Facility, Sydney
- [27] Kormendy, J. 1990, in Kron R. G., ed, Evolution of the universe of galaxies; Proceedings of the Edwin Hubble Centennial Symposium. Astron. Soc. Pac., San Francisco, p. 33
- [28] Kritsuk A. G., 1983, Astrophysics, 19, 263
- [29] Kruit P. C. van der, 1988, A&A, 192, 117
- [30] Kruit P. C. van der, Searle L., 1981, A&A, 95, 105
- [31] Landolt A. U., 1983, AJ, 88, 439
- [32] Laval A., Boulesteix J., Georgelin Y. P., Georgelin Y. M., Marcelin M., 1987, A&A, 175, 199
- [33] Le Coarer E., Amram P., Boulesteix J., Georgelin Y. M., Georgelin, Y. P., Marcelin M., Joulié P., Urios J., 1992, A&A, 257, 389
- [34] Lynds B. T., 1974, ApJS, 28, 391
- [35] Maloney P. 1993, ApJ, 414, 41
- [36] Massey P., Strobel K., Barnes J. V., Anderson E., 1988, ApJ, 328, 315
- [37] Mathewson D. S., Ford V. L., Buchhorn M., 1992, ApJS, 81, 413 (MFB)
- [38] Mihos C., Hernquist L., 1996, ApJ, 464, 641
- [39] Olling R. P., 1996, AJ, 112, 457
- [40] Pierce M. J., Tully R. B., 1992, ApJ, 387, 47
- [41] Puche D., Westpfahl D., Brinks E., Roy J.-R., 1992, AJ, 103, 1841
- [42] Quinn P. J., Hernquist L., Fullagar D. P., 1993, ApJ, 403, 74
- [43] Rix H.-W., Zaritsky D., 1995, ApJ, 447, 82
- [44] Roberts M. S., Haynes M. P., 1994, ARA&A, 32, 115
- [45] Rownd B. K., Dickey J. M., Helou G., 1994, AJ, 108, 1638
- [46] Rozas M., Beckman J. E., Knapen J. H., 1996, A&A, 307, 735
- [47] Rubin V., Ford W. K., Thonnard N., 1978, ApJ, 225, L107
- [48] Ryder S. D., 1993, PhD thesis, Australian National Univ.
- [49] Ryder, S. D., & Dopita, M. A. 1994, ApJ, 430, 142
- [50] Ryder S. D., Staveley-Smith L., Malin D. F., Walsh W., 1995, AJ, 109, 1592
- [51] Ryder S. D., Buta R. J., Toledo H., Shukla H., Staveley-Smith L., Walsh W., 1996, ApJ, 460, 665
- [52] Sempere M. J.., Rozas M., 1997, A&A, 317, 405
- [53] Sparke L. S., 1984, ApJ, 280, 117
- [54] Sperandio M., Chincarini G., Rampazzo R., de Souza R., 1995, A&AS, 110, 279
- [55] Staveley-Smith L., Davies R. D., 1987, MNRAS, 224, 953 (SSD)
- [56] Tóth G., Ostriker J. P., 1992, ApJ, 389, 5
- [57] Tully R. B., 1988, Nearby Galaxies Catalogue. Cambridge Univ. Press, Cambridge
- [58] Tully R. B., Fouqué P., 1985, ApJS, 58, 67
- [59] Walker I. R., Mihos C., Hernquist L., 1996, ApJ, 460, 121
- [60] Walsh W., Staveley-Smith L., Oosterloo T., 1997, AJ, 113, 1591
- [61] Whitmore B. C., Forbes D. A., Rubin V. C., 1988, ApJ, 333, 542
- [62] Young J. S., Xie S., Kenney J., Rice W. L., 1989, ApJS, 70, 699
- [63] Zasov A. V., Kyazumov G. A., 1981, Sov. Astron. Lett., 7, 73 (ZK)
- [64] Zasov A. V., 1995, Sov. Astron. Lett., 21, 652