Testing CNO Enrichment Scenarios in Metal-poor Galaxies with HST Spectroscopy111Based on observations with the NASA/ESA Hubble Space Telescope (HST) obtained at the Space Telescope Science Institute, which is operated by the Association of Universities for Research in Astronomy, Inc., under NASA contract NAS 5-26555
Abstract
Using Hubble Space Telescope ultraviolet and ground–based optical spectroscopy, we measure the C/O and N/O ratios of three metal-poor galaxies with similar metallicity but differing N/O. These observations, in conjunction with photoionization models, indicate that the C/O ratios estimated from C III] 1909 and [O III] 5007 lines are consistent with those measured from C II] 2326 and [O II] 3727 lines. Although inherently more uncertain than C++/O++ due to poorly-known ionization correction factors, we develop the use of the C+/O+ ratio as a reasonable substitute diagnostic of the carbon abundance in H II regions. The C II] 2326 multiplet is typically quite weak, but its proximity to the [O II] 3726,3729 lines makes these transitions a potential tool for measuring the carbon abundance in high–redshift emission–line objects.
The derived chemical properties are consistent with a statistically significant correlation between N and C abundances in metal-poor extragalactic H II regions, in the sense that systems with the largest N/O ratios also have the highest C/O ratios. This result is unexpected if the dispersion in N/O among galaxies of similar metallicity is caused by localized, temporary chemical enrichments from massive stars. The presence of a correlation suggests, instead, that the majority of N and C production is coupled, as expected from chemical evolution models where C is produced predominantly by low mass stars and N is produced predominantly by intermediate mass stars. The C/N ratio is, then, fixed by the initial mass function. Since the occurance of localized chemical “pollution” in star-forming galaxies appears to be low, the relative overabundance of N in some galaxies compared to others at similar metallicity is most plausibly interpreted as an indicator of the global, secular chemical enrichment history. As such, the N/O and perhaps the C/O ratios can be used as a “clock” to estimate the time since the last major episode of star formation.
1 Introduction: Localized Chemical Enrichments and CNO Variations in Metal-poor Galaxies
The chemical compositions of stars and gas within galaxies contain a record of the star formation (SF) and nucleosynthesis history which may be observed long after the stars responsible for metal production have ceased to exist. Considerable effort has gone into measuring the relative abundances of heavy elements in Galactic and extragalactic H II regions (see reviews by Peimbert 1993; Pagel 1994), principally carbon, nitrogen, and oxygen, which are the most abundant species after hydrogen and helium). These abundance measurements are powerful tools that can be used to constrain models of stellar and big bang nucleosynthesis (Pagel et al. 1992; Skillman & Kennicutt 1993; Olive & Steigman 1995 and references therein), model the time evolution of stellar populations, and examine the extent of gas inflow and outflow in galaxies (Tinsley 1974, 1976; Carigi et al. 1995; Pagel 1994 and references therein).
There is evidence, however, that spectroscopic abundance determinations in some starburst galaxies are altered by short-term, localized abundance enhancements, the nucleosynthetic products of massive star populations. Such “polluted” regions may not reflect global galactic abundances and therefore may be unsuitable as probes of the chemical and star formation history (Kunth & Sargent 1986; Pagel et al. 1986). Models based on theoretical nucleosynthesis yields predict that massive starburst clusters are capable of producing large localized chemical enrichments (Esteban & Peimbert 1995). The starburst galaxy NGC 5253 exhibits the most pronounced evidence for chemical pollution of any low-metallicity galaxy in the form of a three-fold N enrichment in the central 40 pc (Welch 1970; Walsh & Roy 1989; Kobulnicky et al. 1997). In addition to this striking case of localized N overabundance, there exists a large dispersion in N/O among metal poor systems (7.812+log(O/H)8.4), consistent with genuine N abundance variations at a given metallicity (e.g., Garnett 1990 but see Thuan, Isotov, & Lipovetsky 1995 for an opposing view).
One scenario that might explain such scatter in N/O invokes “pollution” from the N-rich winds of Wolf-Rayet stars within the present starburst (Pagel et al. 1986). Yet, deliberate spectroscopic searches seldom find localized chemical enrichments in the vicinity of young star clusters in metal-poor galaxies (Kobulnicky & Skillman 1997 and references therein). A second scenario for the dispersion in N/O at a given metallicity involves differing contributions from primary and secondary nitrogen, which essentially amounts to variations of the initial mass function from galaxy to galaxy. A third scenario capable of explaining the N/O dispersion while maintaining a universal IMF involves a time–variable N/O ratio resulting from the delayed return of N to the interstellar medium compared with the return of O. A fourth scenario for producing N/O variations at constant O/H requires preferential oxygen loss from galaxies with high N/O and more effective oxygen retention in galaxies with low N/O.
To investigate the origin of the N/O dispersion among galaxies of comparable metallicity and test whether N/O and C/O ratios might serve as diagnostics of the recent star formation activity, we undertook a program of Hubble Space Telescope and ground-based spectroscopy to measure the C and N abundances in a sample of galaxies with differing N/O but constant metallicity (as indicated by O/H). A sample of four galaxies with bright H II regions and 12+log(O/H)8.1 was selected from the literature. Two galaxies, UM469 and Tololo 1304-386 have relatively high N/O ratios (log N/O 1.2) while the other two, NGC 4861 and Tololo 1345-420, have N/O ratios among the lowest in this metallicity range (log(N/O)1.6 to 1.5). Our principle objective was to measure the C abundance of each object using the UV C III] 1909 and C II] 2363 lines. Section 2 summarizes the HST and ground-based observational program undertaken to measure the C, N, and O abundances. Section 3 recounts the analysis procedures and the derived chemical properties of each object, including a discussion of the utility of the C+/O+ ratio for measuring carbon abundances. Sections 4 and 5 outline the implications for the production of C and N in metal-poor galaxies and for the evolution of N/O and C/O ratios in systems of similar metallicity.
2 Optical and UV Spectroscopy
2.1 HST FOS Observations and Reductions
Three of four targets, T1345-420, UM469, and NGC 4861 were observed with the Hubble Space Telescope Faint Object Spectrograph (FOS) during Cycle 6. One object, T1304-386, could not be observed before the removal of the Faint Object Spectrograph in 1997 January. One location in each object was observed through the 0.′′86 circular aperture of the Faint Object Spectrograph. Wavelength coverage using gratings G190H, G270H, G400H, and G570H ranged from 1600 Å through 6800 Å with typical spectral resolutions of R=1300. Exposure times were selected to yield a strong detection of C III] 1907,1909 and O III] 1661,1666 for an accurate C/O abundance ratio measurement. In actuality, only upper limits on O III] 1661,1666 were attained, but C III] 1907,1909 was detected in all objects. Table 1 summarizes the list of objects, gratings, approximate spectral resolutions, and exposure times used at each location.
The spectra were reduced using the standard HST FOS pipeline procedures. Spectra from different gratings were combined and the continuum levels showed good agreement in the overlapping regions (within 6%) indicating a robust flux calibration. This uncertainty has not been propagated into the formal error budget since it represents only the lack of agreement at the ends of each bandpass, and would become significant only for spectral lines near the edge of one spectrum relative to spectral lines near the edge of the other overlapping spectrum. The resulting calibrated spectra (not corrected for reddening) are shown in Figures 1—3, smoothed with a 5–pixel boxcar for display purposes.
2.2 Calar Alto 3.5m Observations and Reductions
Optical spectra of NGC 4861 and UM469 were obtained with the Twin spectrograph on the Calar Alto 3.5m telescope on the evenings of 1995 July 31 and 1997 January 12 respectively. In 1995, the Tektronics 10242 format CCDs with 24 m pixels were employed as detectors on both the red and blue arms of the spectrograph yielding nominal spatial scales of 0′′.89 pixel-1. Useful data were collected over the wavelength range of 3560 – 5280 Å in the blue and 5640 – 9170 Å in the red. Gratings of 300 line mm-1 in the blue and 270 line mm-1 in the red resulted in dispersion scales of 3.44 Å pixel-1 in the blue and 3.88 Å pixel-1 in the red. The FWHM of the seeing averaged 1.2-1.5′′. Observations were obtained with a 2.1′′ wide slit.
During the 1997 run, the detectors were 800 x 2048 CCDs with 15 m pixels yielding nominal spatial scales of 0′′.56 pixel-1. Gratings of 300 line mm-1 in the blue and 270 line mm-1 in the red resulted in dispersion scales of 2.16 Å pixel-1 in the blue and 2.43 Å pixel-1 in the red. Useful data were collected over the wavelength range of 3400 – 5400 Å in the blue and 5700 – 9600 Å in the red. Observations were obtained with a 2.1′′ wide slit and spectra were extracted using a 4-pixel (3.5′′) wide aperture. Due to mechanical problems with the telescope focus, spatial resolution was not limited by seeing, and it varied over the night, averaging 3′′.
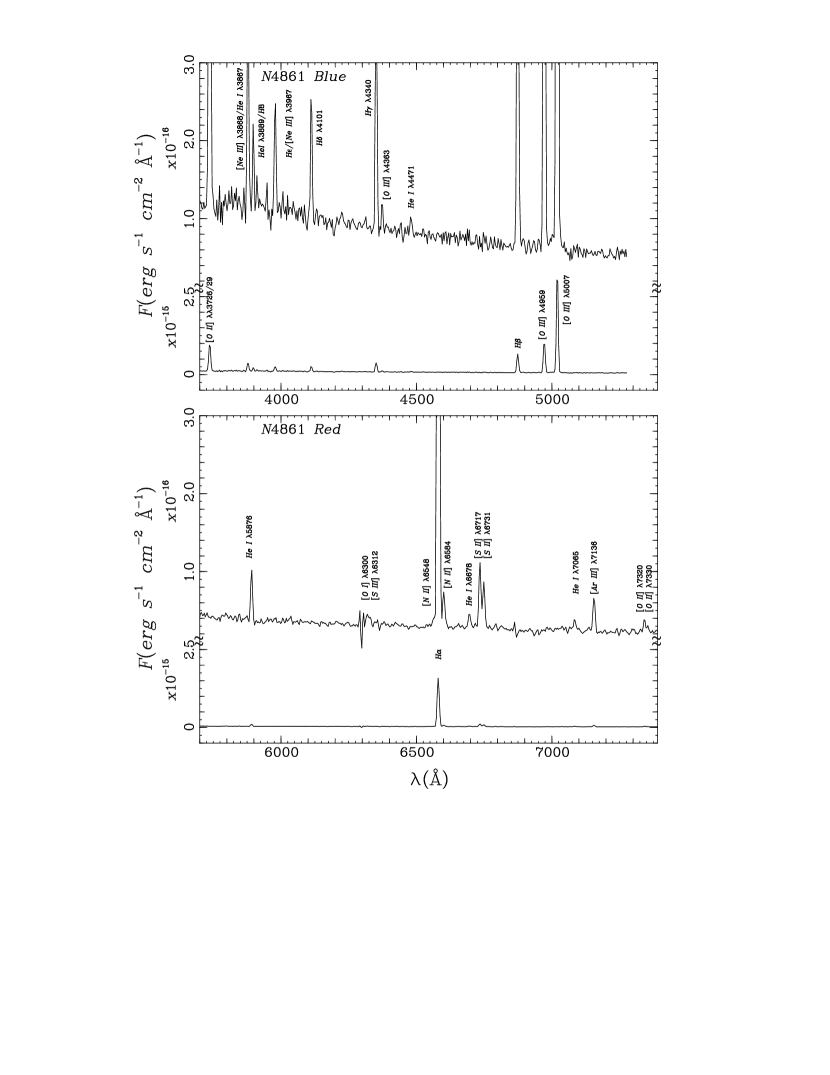
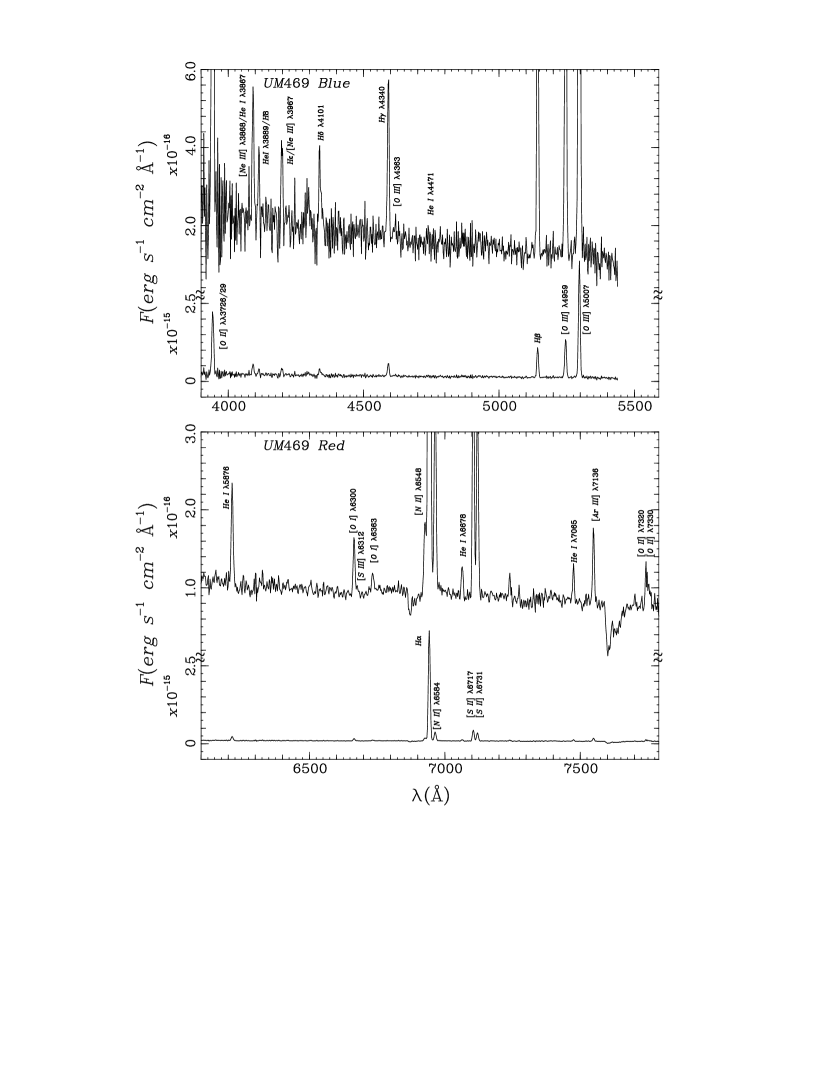
On both nights the sky appeared hazy but uniform. Bias frames, dome flats, twilight sky flats, and He-Ar arc lamp exposures were taken at the beginning and end of the nights. Each night five standard stars from the list of Oke (1990) were observed with a slit width of 3′′.6, which is the maximum allowed by the spectrograph set-up. Standard reduction procedures were followed using the programs available within the IRAF444IRAF is distributed by the National Optical Astronomy Observatories, which are operated by the Association of Universities for Research in Astronomy, Inc., under cooperative agreement with the National Science Foundation. software. During the flux calibration stage, an atmospheric extinction law was derived from the standard star data. This was done self-consistently, i.e., the standard star data from both the red spectra and blue spectra were used simultaneously to derive the extinction law. Observations were taken close to the parallactic angle to avoid problems of differential atmospheric refraction (particularly important given the long wavelength coverage of the observations). Three 600 sec exposures of each object were obtained and averaged after rejecting pixels affected by cosmic rays. A series of 1-D spectra were extracted for each object. Since it was not possible to match the ground-based apertures spatially to the HST aperture, we selected the spectrum nearest the location of the HST FOS aperture with the best signal to noise. For NGC 4861 the extracted region measured 2.1′′ 3.5′′. For UM469 the extracted region measured 2.1′′ 10.0′′. Figures 4—5 show the resulting spectra for for NGC 4861 and UM469, uncorrected for reddening.
3 Analysis and Abundance Computation
3.1 Extinction Correction
Reddening, electron temperatures, densities, ionic abundances and total elemental abundances (except carbon and silicon) are derived from optical emission lines as described in Kobulnicky & Skillman (1996). Briefly, corrections for reddening and underlying stellar Balmer absorption are computed using the standard procedures.
| (1) |
where is the true de–reddened flux at a given wavelength, is the observed flux at each wavelength, c(H) is the logarithmic reddening factor, and ) the reddening function (Seaton 1979 as parameterized by Howarth 1983) appropriate to the Milky Way. Shortward of 3200 Å, the standard Galactic extinction law diverges from that found in the LMC and SMC which are the only metal poor objects with measured reddening curves. Since the fluxes of the UV lines relative to H are sensitive to the adopted values of c(H) and the assumed UV extinction curve, each line of sight deserves careful attention. Tables 2 and 3 list ’s for the SMC and Galactic reddening laws, and the dereddened line strengths for the HST FOS and Calar Alto spectra corrected for reddening relative to H, according to the prescriptions outlines below. Corrections for 0 to 2 Å of underlying stellar H (but not He) absorption have been applied based on the theoretical-to-observed ratios of higher order Balmer lines in each object’s spectrum.
NGC 4861
The values of c(H) derived from the HST FOS and Calar Alto Balmer line ratios are 0.200.06 and 0.110.06 respectively. The best estimate of the underlying stellar Balmer absorption is 0.0 Å from the FOS and 0.0 Å from the Calar Alto data. Dinnerstein & Shields (1986) report c(H)=0.34 for this object. Given the vastly different aperture sizes for each spectrum, the lack of agreement is not terribly surprising if the extinction is spatially variable. In the following analysis, we will use the HST result, c(H)=0.200.06.
Galactic reddening maps based on star counts and H I column density (Burstein & Heiles 1984) suggest E(B-V)=0.0, and thus c(H)=0.0 toward this line of sight, so that nearly all of the extinction must be internal to NGC 4861. Since NGC 4861 has metallicity 12+log(O/H)8.0, much like the SMC, we adopt an SMC type reddening law (Prévot et al. 1984 as parameterized in Kobulnicky et al. 1997) to deredden the UV lines.
UM 469
The values of c(H) derived from the HST FOS and Calar Alto Balmer line ratios are 0.320.10 and 0.460.06 respectively. The best estimate of the underlying stellar Balmer absorption is 1.5 Å from the FOS and 2.0 Å from the Calar Alto data. The reasonable agreement despite the vastly different aperture sizes for each instrument probably indicates that the H II region in UM 469 is unresolved due to its great distance (). That we find comparable H fluxes through both apertures (actually greater through the FOS!) is consistent with this hypothesis. These c(H) values also compare favorably to the c()=0.360.18 cited by Campbell, Terlevich, & Melnick (1986, hereafter CTM). Galactic reddening maps of Burstein & Heiles (1984) suggest E(B-V)=0.01 ( c(H)0.01) in this part of the sky, so that the measured c(H) must be due mostly to extinction within UM 469. Additional evidence for this conclusion comes from examination of the Mg II 2800 doublet seen in absorption at Galactic velocities near 2800 Å and at the redshift of UM 469 near 2960 Å. Since the equivalent widths of the redshifted Mg II lines are more than 4 times greater than those seen at Galactic velocities, most of the intervening medium lies within UM 469. Consequently, we adopt an SMC type reddening law to deredden the UV lines.
T1345-420
The value of c(H) derived from the HST FOS Balmer line ratios is 0.250.06. For complementary ground-based spectroscopy, we adopt the measurements of Campbell, Terlevich & Melnick (1986) who find a similar value, c(H)=0.170.05. The reddening maps of Burstein & Heiles (1984) suggest E(B-V)=0.085 in this direction, corresponding to c(H)=0.13. Thus, about half of the extinction should arise in the Galaxy and the other half within T1345-420. Consequently, we adopt a reddening law which is 50% SMC and 50% Galactic.
3.2 Uncertainties and Error Propagation
The uncertainties on the optical emission lines in Table 3 are 1 errors which include contributions from photon statistics, flatfielding, flux calibration, detector noise, sky background, and reddening as described in Kobulnicky & Skillman (1996). For the HST data in Table 2, the listed uncertainties are computed empirically from the RMS in adjacent continuum portions of the spectrum and the width of the line. The listed uncertainties also include include a contribution due to reddening. All line strength uncertainties are propagated by Monte-Carlo techniques into uncertainties on the physical conditions and chemical abundance ratios as described below. The tabulated 1 uncertainties reflect the quantifiable statistical uncertainties only. They represent a realistic lower bound on the true uncertainties which may have additional contributions from systematic effects such as temperature and density fluctuation within the aperture (e.g. Peimbert, Sarmiento, & Fierro 1991). However, in longslit spectroscopic surveys covering 1 linear kpc at spatial resolutions of 20-40 pc in the nearby irregular galaxies NGC 4214 (Kobulnicky & Skillman 1996) and NGC 1569 (Kobulnicky & Skillman 1997), variations in physical conditions and chemical composition are well within the formal statistical uncertainties. This suggests that, if significant fluctuations in physical conditions are present in those systems, they evidently are important only on scales much smaller than the typical resolution element (40 pc) or are smaller than the statistical uncertainties. Consequently, we quote only the statistical uncertainties and urge discretion in the interpretation of errors.
3.3 Physical Conditions and Abundance Derivation
The derived physical conditions and ionic and total abundances are compiled in Tables 4, 5, and 6 for NGC 4861, UM 469, and T1345-420. The electron density lies in the low-density limit in all cases, as computed from the [S II] 6717,6731 line ratios. We adopt the two–temperature two-zone approximation commonly used, consisting of an inner, high ionization (O++) zone and an outer zone of lower ionization (O+). The electron temperature, , of the high ionization zone is calculated from the ratio of [O III] [4959 + 5007]/4363, while the temperature of the low ionization zone, , is found using a relation between and (Pagel et al. 1992; Skillman & Kennicutt 1993) based on photoionization models (Stasińska 1990; Skillman 1989).
Optical line ratios and computed electron temperatures are used to determine He, N, O, and S abundances as described in Kobulnicky & Skillman (1996) making use of updated atomic data in the code detailed in Shaw & Dufour (1995). Neither the O III] 1661,1666 multiplet nor the N III] 1750 multiplet are detected in any of the objects, and the upper limits do not allow any useful constraints to be placed on the N++/O++ or C++/O++ ratios. Consequently, N/O is determined from the ratio of the optical [N II] 6584/[O II] 3727 lines or the [N II] 6584/[O II] 7320,7330 lines where Calar Alto spectra are available. Since the spectral resolution of the FOS is not sufficient to separate the weak [N II] 6584 from H, the ground-based Calar Alto data are used to compute the N abundances. C/O ratios are computed from the C III] 1907,1909 and [O III] 5007 line strengths using
| (2) |
is the ionization correction factor, is the electron temperature in units of 10,000 K, and is the volume emissivity of a given transition. The constant 0.059 involves an interpolation for the temperature–dependent ratio of collision strengths, (1909) and (5007) (Dufton et al. 1978 as tabulated in Pradhan & Peng 1996). This term varies from 0.62 to 0.57 over the range 12,000 K and 14,000 K. The assumption that is justified from photoionization models (Garnett et al. 1995a, Figure 2) which show that when the ionic fraction of doubly ionized oxygen, X(), is less than 0.90, this approximation is accurate to better than 20% (0.08 dex) so that the ICF is between 1.00 and 1.15. Examination of X() for each object in Tables 4—6 show that this condition is satisfied in all cases. The fractions are 0.85, 0.78, and 0.85 for NGC 4861, UM469, and T1345-420 respectively. Given that the ionization correction factor is uncertain, but near unity, we assume = and do not apply an ICF (or equivalently, ICF=1.0) in the text and tables.
Although the dominant ionization state of C and O in H II regions is C++ and O++, the C II] 2326 multiplet and [O II] 3727,3729 lines can serve as a valuable check on the C/O ratio using
| (3) |
The constant 0.49 involves a linear interpolation for the temperature–dependent ratio of collision strengths, (2326) and (3727) (Blum & Pradhan 1992 as tabulated in Pradhan & Peng 1996). This term varies from 0.51 to 0.48 over the range 11,000 K and 14,000 K of interest here.
The line ratio can also be used to estimate the C/O ratio when data on the higher ionization diagnostics, C III] 1909 and O III] 1666, are not available. Although the C II] 2326 multiplet is typically quite weak, it is detected in all three of our targets and it is, in some respects, better for measuring C/O since it is less sensitive to reddening and temperature uncertainties than the line ratio. For the objects studied here, the largest quantifiable source of uncertainty on the C+/O+ ratio is low signal-to-noise on the C II] 2326 line. However, systematic effects due to ionization correction uncertainties and line blending make additional contributions to the error budget. Even in the ideal case of very high S/N spectra, ionization correction uncertainties and line blending will limit the usefulness of this approach.
Since the C II] 2326 multiplet is blended with the [O III] 2321,2331 lines at the resolution of the FOS, a correction to the C II] line strengths is necessary. The contribution of [O III] 2321,2331 to the C II] 2326 feature in the FOS spectra is on the order of 20%. For each object we have estimated fractional contribution of [O III] 2321,2331 using the temperature and density appropriate for each case, while assuming X(C+)=0.1, X(O++)=0.9, and C/O=0.37. For NGC 4861, UM469, and T1345-420, the [O III] lines contribute 22%, 21%, and 20% respectively, to the total blended feature. Table 2 lists the estimated line strengths for [O III] 2321,2331 and the adjusted line strengths for C II] 2326. Note that the quoted uncertainties on these lines do not include the contribution from errors introduced by assuming the values for X(C+), X(O++), and C/O as listed above. Because of the uncertainties due to line blending, we present C/O ratios derived from C+ and O+ lines as a valuable secondary means of abundance measurement only. We adopt the C/O ratios derived from C++ and O++ lines as the best-estimate values in all later analyses.
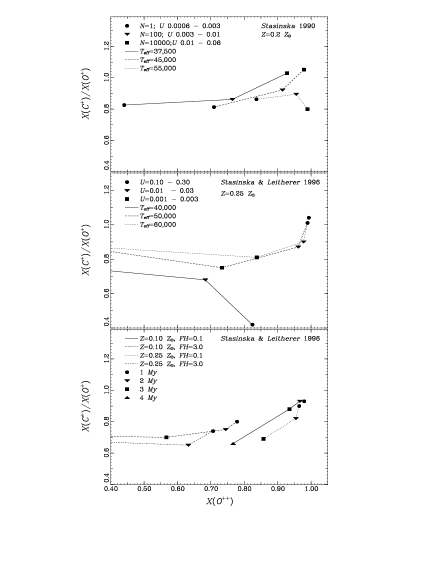
The second potential systematic effects arises because C+is a trace species within highly-ionized H II regions, but ubiquitous in warm, photo-dissociation regions. Ionization correction factors may potentially be large, and in general, the higher ionization diagnostics, C III] 1909 and O III] 1666 should always be used when possible. To investigate the magnitude of the ionization correction factor needed, we have compiled H II region photoionization model results from Stasińska (1990) and Stasińska & Leitherer (1996). In Figure 6 we plot the ratio of the ionic fractions, X(C+)/X(O+), versus the fraction of doubly ionized oxygen, X(O++). [X(C+)/X(O+)]-1 is the ionization correction factor that converts the observed C+/O+ ratio into C/O. A wide range of model parameters are explored at a metallicity of Z=0.2 Z⊙, appropriate to the observed galaxies. In the top panel, lines connect models (Stasińska 1990) with the same temperature stars while symbols denote models with similar ionization parameter, (corresponding roughly to the number of stars ionizing the H II region in her models). X(C+)/X(O+) lies in the narrow range 0.80 to 0.95 for 0.75X(O++)0.85 which is the regime of interest for the three targets. Although the models encompass a wide range of stellar effective temperatures from 55,000 K to 37,500 K, and ionization parameters () from 0.0006 to 0.06, the magnitude of the ICF is small overall and it shows a small dispersion from model to model. This suggests that it may be possible to obtain reliable measurements of the C/O ratio from the C II] 2326 and [O II] 3727 lines even though C+ and O+ are trace species in H II regions, similar to [N II]/[O II] used to derive N/O (Garnett 1990).
Stasińska & Leitherer (1996) provide a new set of photoionization models using updated atomic data and expanding non-LTE stellar atmospheres. We show these results in the middle panel of Figure 6 for stellar effective temperatures of 40,000, 50,000, and 60,000 K and a range of ionization parameters. Except for the coolest stars, the models predict ionization correction factors which are in good agreement with one another and with the Stasińska (1990) models in the top panel. These results are again consistent with the suggestion that the C+/O+ ratio can be used as a reliable C/O indicator.
In the lower panel of Figure 6 we show the Stasińska & Leitherer (1996) model results for an evolving burst of stars with an IMF of slope =2.35. Two metallicities, Z=0.1 Z⊙ and Z=0.25 Z⊙ are distinguished by line style. Line style also distinguishes models with different values of , the size of a central evacuated hole in the spherical H II region in units of the Stromgren sphere radius. Burst ages of 1, 2, 3, and 4 Myr are denoted by different symbols along each evolutionary path. In all models, the O++ fraction drops sharply after 5 Myr when the most massive stars have disappeared. In models with Z=0.25 Z⊙, the appearance of Wolf-Rayet stars after 3 Myr produces an elevated He II 4686 intensity (up to 0.05 that of H) which is not observed in these three objects. For this reason, we do not include points beyond 3 Myr for these models. The starburst evolution shown in the lower panel of Figure 6 is again consistent with the proposition that X(C+)/X(O+) is well-behaved over a wide range in burst ages and H II region geometries. For highly ionized nebulae, 0.75X(O++)0.85, the reciprocal ionization correction factor, X(C+)/X(O+), exhibits a small range from 0.6 to 0.8, although this range is slightly offset from the single temperature models discussed above.
Based on the photoionization models in Figure 6, we adopt an ionization correction factor (ICF) of 1.2 in order to convert C+/O+ into the C/O values summarized in Tables 4—6. The small magnitude of this correction may seem surprising since C+ is only a trace species in H II regions, X(C+)0.02—0.10. At the same time, C+ is the most abundant ionization state in photodissociation regions, since the first ionization potential of C is only 11.3 eV. However, although C II may be ubiquitous in the cooler environments exterior to H II regions, the excitation potentials of the UV 2326 lines are 5.3 eV, large enough that only in the hot, highly ionized H II regions will the electron temperature be high enough to collisionally populate the upper levels. Thus, as long as the C II] 2326 and [O II] 3727 lines arise in the same physical volume, their relative strengths provides a reasonablely accurate estimation of the C/O ratio.
In summary, line blending with [O III] 2321,2331 and uncertain ionization correction factors will ultimately limit the usefulness of the C II] 2326 multiplet as an abundance diagnostic. However, in the absence of data on the higher ionization species, it appears to be a useful substitute. The small temperature and reddening dependence of the O III] 1661,1666 to C III] 1907,1909 ratio makes it the preferred method of measuring C/O abundances (Garnett et al. 1995a).
3.4 Abundance Results
The chemical abundance ratios derived for each object appear in Tables 4—6. It is especially interesting to compare the C/O ratios derived from C+/O+ versus those derived from C++/O++. For NGC 4861 and T1345-420, we find that the C/O ratios estimated from C+/O+ are nearly identical to those derived from C++/O++. For UM 469, the two estimates agree to within the uncertainties due to reddening and electron temperature errors. Furthermore, the C/O ratios abundances derived from C+/O+ appear consistent relative to those derived from C++/O++ for the three targets, supporting use of the C II] 2326 and [O II] 3727 lines as a valuable secondary diagnostics of the carbon abundance.
NGC 4861
The O++ electron temperatures derived from measurements of [O III] 4363 in the FOS and Calar Alto spectra are consistent, 14210440 K and 14500700 K respectively. However, the ground based longslit spectroscopy indicates substantial temperature variations across the 20′′region, ranging from 14,500 K near the star cluster where the HST FOS aperture was centered, to 12,400 K in the nebular regions to the northeast. The ground-based spectra reveal no compelling evidence for O or N/O abundance variations across the 20′′ diameter nebular region at a spatial resolution of 2′′. The derived O abundances are 12+log(O/H)=8.030.03 for the HST data, in excellent agreement with 12+log(O/H)=8.040.04 found by Garnett (1990). The Calar Alto spectra yield a slightly lower value, 12+log(O/H)=7.940.03, which is consistent to within the errors.
The N abundance, log(N/O), as measured from the [N II] 6584 and [O II] 3727 lines is 1.400.07, which is typical for dwarf galaxies of this metallicity, but slightly higher that the value of 1.690.14 found by Garnett (1990). The new value is consistent with log(N/O)=1.520.10 derived from the [N II] 6584 and [O II] 7320,7330 lines in the Calar Alto spectra. Thus, we have confidence that the N/O ratios are well-measured and are not much affected by reddening uncertainties. The weighted mean N/O ratio used hereafter is log(N/O)=1.440.06
The carbon abundance as derived from the C III] 1909 and [O III] 5007 lines is log(C/O) = 0.510.10, consistent with C/O ratios in other galaxies of similar metallicity (Garnett et al. 1995a), and in excellent agreement with the C/O ratio derived from the C II] 2326 and [O II] 3727 lines, log(C/O)=0.440.09. However, given the uncertainties in correcting for [O III] contamination of the C II] 2326 line, we adopt the C++/O++ result as the best-estimate value. Since the electron temperature is well-measured, the largest source of uncertainty on the N/O and C/O ratios is due to reddening. The uncertainty in c() dominates the quoted uncertainties in C/O (and N/O where [O II] 3727 is used). If a Galactic extinction law instead of an SMC law is used to deredden the UV lines relative to H, the C/O ratio is decreased by 1.5, which still places NGC 4861 among the other systems of similar metallicity. Under this extreme assumption, the resulting C abundance becomes log(C/O) = 0.660.10 as derived from C++/O++ and log(C/O) = 0.610.10 as derived from C+/O+.
From FOS measurements of the ultraviolet Si III] 1883,1892 and the C III] 1909 lines we measure Si++/C++=0.1260.040 using Equation 1 of Garnett et al. (1995b). The total elemental abundances, Si/C, can be estimated using an ionization correction factor of 1.4 which is appropriate for an O++ fraction of 0.8 judging from photoionization models summarized in their Figure 1. The resulting total abundances are Si/C=0.130.03 and log(Si/O)=1.380.13. This places NGC 4861 among the objects with the highest Si/O ratio of those measured by Garnett et al. (1995b).
UM 469
The O++ electron temperatures derived from measurements of [O III] 4363 are 12840840 K and 123901000 K for the FOS and Calar Alto spectra, consistent within the errors and in good agreement with Te=125901400 derived by CTM. The derived O abundances are marginally consistent with one another, 12+log(O/H)=7.970.05 for the HST FOS spectra versus 8.080.07 for the Calar Alto data. Both compare favorably to 8.010.11 derived by CTM. The N/O ratio, as measured from the [N II] 6584 and [O II] 3727 lines, is log(N/O)=1.260.09 consistent with the CTM measurement, log(N/O)=1.190.10, placing it among the most N–rich objects at this metallicity. These values compare favorably to log(N/O)=1.290.15 derived from the [N II] 6584 and [O II] 7320,7330 lines, providing assurance that the N/O ratio is genuinely high and is not adversely affected by reddening uncertainties.
The derived C abundance is log(C/O)=0.37, making it the most C–rich object known at this metallicity. The C/O ratio derived from the C II] 2326 and [O II] 3727 lines is roughly consistent at log(C/O)=0.490.10. If we were to adopt the extreme assumption of a Galactic UV reddening law instead of the SMC one, the resulting log(C/O) would be 0.65, placing UM 469 amidst all of the other metal-poor galaxies at this metallicity (see Figures 8 & 9). The C/O ratio derived from the C II] 2326 and [O II] 3727 lines dereddened with an Galactic type law is log(C/O)=0.610.10. For UM 469, the uncertainties on the reddening and the electron temperature contribute roughly equally to the error budget for the C++/O++ measurement, while the low S/N on the 2326 line is the limiting factor for the C+/O+ estimate.
From FOS upper limits on the ultraviolet Si III] 1883,1892 lines we measure Si++/C++0.277. Adopting an ICF of 1.4 based on Figure 1 of Garnett et al. (1995b), the total elemental abundances are Si/C0.395 and log(Si/O)0.772. These upper limits are consistent with other metal-poor H II regions, but are not very helpful in constraining the Si abundance.
T1345-420
The O++ electron temperature derived from measurements of [O III] 4363 with the FOS is 12520 740 K. This compares favorably with 13320 720 K which we re-compute from the line strengths given in CTM. Likewise, the O abundances are consistent within the errors, 12+log(O/H)=8.110.05 for the FOS data and 8.030.04 for the CTM data. The log(N/O) derived from the CTM spectra is 1.620.10, placing T1345-420 among objects with the lowest known N abundances.
The C abundance derived from C III] 1909 and [O III] 5007 lines is log(C/O)=0.710.14, in excellent agreement with log(C/O)=0.690.12 from the C II] 2326 and [O II] 3727 lines. The uncertainties on the reddening and the electron temperature contribute roughly equally to the error budget for the C++/O++ measurement, while the low S/N on the 2326 line is the limiting factor for the C+/O+ estimate. In the extreme case that all of the intervening medium follows a Galactic type reddening law (instead of the 50% SMC, 50% Galactic proportion assumed above) the carbon abundances become log(C/O)=0.790.13 from C++/O++ lines versus log(C/O)=0.740.11 from the C+/O+ ratio.
From FOS upper limits on the ultraviolet Si III] 1883,1892 lines we measure Si++/C++0.257. Adopting an ICF of 1.4 based on Figure 1 of Garnett et al. (1995b), the total elemental abundances are Si/C0.367 and log(Si/O)1.14. These upper limits are consistent with other metal-poor H II regions, but are not very helpful in constraining the Si abundances.
4 C and N Abundances in Galaxies of Similar Metallicity
These new data can begin to address which of the four scenarios presented in the Introduction can best explain the variation in N/O abundances among galaxies of a given metallicity. Temporary N and He enhancements from OB and Wolf-Rayet stars (i.e. “pollution”, Pagel et al. 1986; “self-enrichment”, Kunth & Sargent 1986) have been suggested as an explanation for the relatively high abundances of these elements reported in some Wolf-Rayet galaxies (Pagel et al. 1986, 1992; Esteban & Peimbert 1995). If N variations among galaxies at constant O/H are all due to pollution from these short-lived stars, then the abundance of carbon, produced predominantly in long-lived, low to intermediate mass stars (8 ; Timmes, Woosley, & Weaver 1995) should exhibit no correlation with the amount of N enrichment.
In the case of NGC 5253, the two regions showing three-fold N overabundances have identical C abundances, suggesting that N production is decoupled from C production. Since WR star winds are not generally C-rich (except for the short-lived WC stars which become increasingly rare in low-metallicity galaxies (see Arnault et al. 1989; Maeder & Maynet 1994), a scenario involving localized pollution from the N-rich winds of 5–15 O and WR stars appears to be consistent with both the magnitude of the N enrichment and the lack of observed C enrichment (Walsh & Roy 1989; Kobulnicky et al. 1997). NGC 5253 appears to be an anomaly. Except for the well-documented case in NGC 5253, and possibly II Zw 40 (Walsh & Roy 1993) other nearby starforming galaxies appear chemically homogeneous despite the presence of multiple massive star clusters (NGC 1569: Devost, Roy, & Drissen 1997; Kobulnicky & Skillman 1997— NGC 2366: Roy et al. 1996—NGC 4214: Kobulnicky & Skillman 1996—NGC 4395: Roy et al. 1996—NGC 6822: Pagel, Edmunds, & Smith 1980—the SMC and LMC: Dufour & Harlow 1977; Pagel et al. 1978; Russell & Dopita 1990— and assorted other irregular galaxies: Masegosa, Moles, & del Olmo 1991). Galaxies with large populations of Wolf-Rayet stars do not show systematically higher abundances than other actively star forming systems (Kobulnicky & Skillman 1996).
In the sample of galaxies presented here, there appears to be a positive correlation between C and N abundances. Such a correlation is not expected if the N/O variations are due to nitrogen pollution from short-lived massive stars. In Figures 7 and 8 we plot the derived N/O and C/O ratios versus metallicity, 12+log(O/H), for each of the three targets. For comparison, we include the HST FOS results at 3 locations in NGC 5253, along with two other N/O and C/O measurements in objects with similar O/H from the literature. In Figure 7, T1345-420 occupies the regime where the most N-poor objects are found. NGC 4861 falls near the middle of the distribution, while UM 469 lies among the most N-rich objects, (excluding the extremely N-enriched regions of NGC 5253). In Figure 8, the three objects occupy the same relative positions along the C/O axis, with UM 469 being the most C-rich and T1345-420 the least C-rich. The three new data points along with previous measurements of C/O values in the SMC and NGC 2363 (Garnett et al. 1995a) which have similar metallicity, help illustrate, for the first time, the intrinsic dispersion in C/O. However, the uncertainties due to temperature and reddening errors are large, and there are not yet enough data to characterize the magnitude of real variations in C/O.
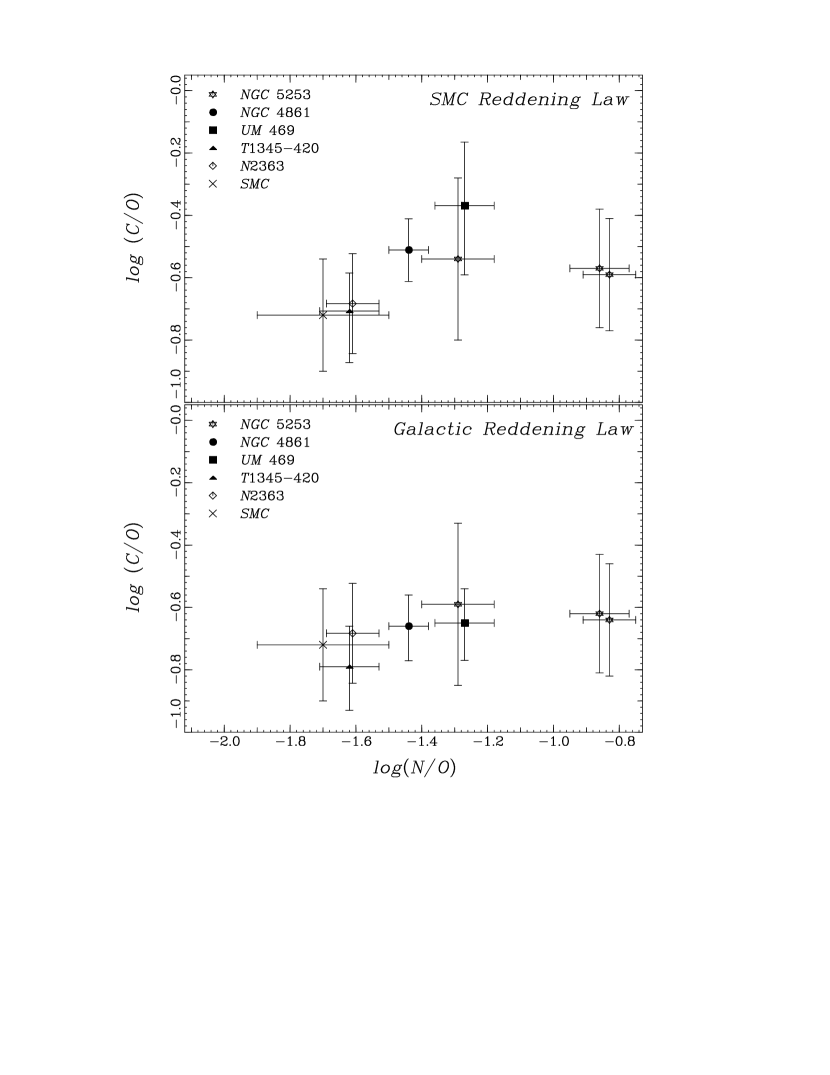
To examine the behavior of N and C abundances at a constant metallicity (O/H), we plot in Figure 9 the N/O versus C/O ratios for all six objects with available data in the narrow metallicity range, 8.012+log(O/H)8.2. Carbon abundance data for NGC 2363 and the SMC N88A are taken from Garnett et al. (1995a) and the N abundances for NGC 2363 are from Gonzalez-Delgado et al. (1994). C/O ratios are derived from C++/O++ in each case. The upper panel shows the results of adopting the best-guess mixture of the Milky Way and SMC type reddening laws for each object as described in § 3.1. The lower panel shows the resulting C/O ratios if we deredden UV lines using only a Galactic-type law. If NGC 5253 is ignored as a special case of localized pollution, then there is a strong correlation between the remaining 5 objects in the upper panel with a linear correlation coefficient of 0.989. This indicates that for 5 data points selected randomly, the probability of getting an equal or greater degree of correlation is 0.002. A linear least-squares fit to the data yields a slope of 2.470.84. In the lower panel where a Galactic reddening law is blindly assumed, the correlation coefficient is 0.682, indicating that the probability of getting an equal or greater degree of correlation is 0.20. A linear fit to the data yields a slope of 0.460.51. Given the small sample size and substantial observational uncertainties, these data should not be used to infer the form of a correlation between N/O and C/O. We argue only that, unless the extreme case of an entirely Galactic extinction law is adopted, there is strong evidence for a positive monotonic relationship between C and N abundances among galaxies in this metallicity range.
In Figure 10 we plot the metallicity, as indicated by 12+log (O/H), versus the C/N ratio for the three objects using the mean N/O and C/O values listed in Tables 4—6. The three galaxies observed in this program show nearly identical C/N ratios, log(C/N)=0.933. The dispersion is 0.048, less than half the typical measurement error of =0.15. The newly measured value for NGC 4861 is 1.5 higher than that previously estimated using the IUE data (Dufour et al. 1984). The mean C/N value of log(C/N)=0.93 is in fair agreement with, but on the high side of, the predictions of Matteucci’s (1986) model (a) for the solar neighborhood. Excepting the N-enriched locations in NGC 5253, most of the data in Figure 10 are consistent with log(C/N)0.90, though there is a tendency for lower C/N ratios at lower metallicity. Better C and N abundance measurements in metal-poor systems are needed to establish whether the effective C/N yields vary appreciably with metallicity.
5 Interpretation of CNO Abundances
The existence of a probable correlation in Figure 9, and the constant C/N ratios at similar metallicity in Figure 10 implies that C and N production mechanisms are coupled. Such a correlation appears inconsistent with the idea that massive stars are responsible for the relative enrichment of either element. Although C may be produced in massive stars and released in supernova ejecta, the majority of C in galaxies is thought to originate in low to intermediate mass stars (8 ; Timmes et al. 1995). Furthermore, although some N may be produced in the atmospheres of massive stars and released in massive star winds, little or no N is released in supernovae (see stellar evolution and nucleosynthesis models of Schaller et al. 1992; Woosley & Weaver 1995). The correlation in Figure 9 is consistent with the hypothesis that both the N and C abundances are the result, not of local, temporary enrichment from massive stars, but of global, secular enrichment resulting from the particular star formation history of low and intermediate mass stars in each object.
The current data are not able to address whether the N is predominantly primary or secondary origin, since intermediate mass stars may produce either or both types of N (Renzini & Voli 1981). Nor are we able to distinguish between the latter three hypotheses outlined in the introduction. That is, without additional information on the star formation histories and burst ages in each object, we are unable to say whether the observed N/O and C/O variations are due to 1) variations in the IMF from one galaxy to the next, 2) a time delay between the release of N & C and the release of O, or 3) preferential loss of O due to galactic winds in galaxies with high N/O and C/O ratios, or some combination of the three options. However, it is possible to make some predictions within the context of each hypothesis. Observational work verifying one or more of these predictions would help to distinguish between the three hypotheses.
The Variable IMF Hypothesis
The correlation between C and N among these galaxies is revealing because it seems to confirm that the N/O and C/O variations among our sample are due to variations in the effective N and C yields from low and intermediate mass stars compared to the O yields from massive stars. N is produced predominantly from C and O in the CNO cycle, and may be either “primary” or “secondary” in origin. Primary nitrogen is synthesized directly from H and He via fresh C and O while secondary nitrogen is made from pre-existing C and O. Primary N is thought to be produced in low mass (4-5 ) stars (Renzini & Voli 1981), or possibly in massive stars 30 (Woosley & Weaver 1995). Secondary N is thought to be produced in intermediate mass stars and released into the interstellar medium (ISM) through red giant winds and planetary nebulae. The ratio of primary to secondary N produced in massive versus intermediate mass stars is presently poorly constrained both observationally and theoretically. Consequently, the expected relation between the abundance of N and other elements within the ISM is poorly known. If nitrogen is predominantly of primary origin, the nitrogen abundance is expected to show a linear correlation with the oxygen abundance, while if N is mostly of secondary origin, N should be proportional to the square of the oxygen abundance. However, the exact ratio of N to other elements depends upon many factors, including the fraction of N from primary and secondary nucleosynthesis, the initial metallicity of the stars, and perhaps most importantly, on the stellar initial mass function.
In the context of the variable IMF hypothesis, we predict that UM 469 should have a steeper IMF (greater fraction of low mass stars) than the other systems in order to produce substantially more N and C relative to O. Since it is very difficult to measure the initial mass function even in nearby systems, obtaining suitable measurements for the very distant UM 469 is probably not feasible. However, there is no compelling evidence that the initial mass function varies in local galaxies (Hunter et al. 1997; Parker & Garmany 1993; Hill, Madore, & Freedman 1994; but for an opposing view see Charlot et al. 1993), so this hypothesis is not especially attractive at the present time in the absence of new results providing strong evidence for IMF variations.
The Delayed Release or “Clock” Hypothesis
Another way to obtain varying C/O and N/O ratios at constant metallicity while maintaining a universal IMF and universal stellar yields is to delay the release of N and C relative to O (Edmunds & Pagel 1978; Garnett 1990). Models of chemical evolution in galaxies which produce stars in bursts separated by long quiescent periods (Edmunds & Pagel 1978; Pantelaki 1988; Clayton & Pantelaki 1993) suggest that the dispersion in N/O could be due to a delayed relase of N and elements produced in low–mass longer lived stars, compared to O and elements produced in massive, short-lived stars.
The Delayed Release Hypothesis predicts that the N/O ratio evolves significantly during a single cycle of star formation, followed by quiescence. Figure 11 illustrates this cycle schematically. During a long period of quiescence, the evolution of intermediate mass stars should enrich a galaxy significantly in N (and, we suggest, carbon too), but not O or any of the products of Type II supernovae. At the beginning of a burst of SF which occurs after a long period of quiescence, the N/O ratio should be high as the result of the evolution of intermediate mass stars over the last few 100 Myr. After the quiescent period ends, and massive star formation commences, the N/O ratio drops and the O/H ratio increases as supernovae release O and other process elements into the ISM. The chemical properties of galaxies should then evolve rapidly during the few tens of millions of years after the start of a massive starburst that dominates the host galaxy. At the end of a period of massive star formation, the N/O ratio should be a minimum as the massive stars die and the H II region fades away.
If this picture is correct, the N/O ratios could be used as a “clock” to determine the time since the last major episode of star formation. Since He is often produced along with N, the He/H ratios could be affected in the same way, although variations will be more difficult to detect against a pre-existing background of primordial He. Based on data presented here, the C/O ratios may vary in roughly the same way as N/O during the course of a starburst. Curiously, II Zw 40 and NGC 5253 appear to fit well into the predictions of the Delayed Release Hypothesis, showing high N/O ratios and evidence for extremely young starbursts based on large EW(H) and completely thermal radio continua (see Deeg et al. 1993; Beck et al. 1996; Rieke, Lebofsky, & Walker 1988). The chemical properties of the Pegasus dwarf irregular galaxy also seem consistent with this scenario (Skillman, Bomans, & Kobulnicky 1997).
Generally, the Delayed Release Hypothesis predicts that H II and blue compact galaxies with high N/O ratios (UM469, for example) are experiencing their first burst of massive star formation after a relatively long quiescent interval, while the same types of galaxies with low N/O ratios (T1345-420, NGC 6822) have had little or no quiescent interval. However, since the nucleosynthetic products of massive stars appear to require longer than 107 years to mix with the surrounding ISM and become detectable (Tenorio-Tagle 1996; Kobulnicky & Skillman 1997 and references therein), there will be some time lag (107 yrs) between the supernova explosions and the appearance of fresh -process elements in the warm ionized ISM. As long as this time lag is not longer than the lifetimes of N and C-producing stars (108 yrs for 5 stars; we assume that C and N released in cool, slowly-expanding red giant winds and planetary nebulae do not require such long timescale to mix with the surrounding medium), then the N/O ratio may serve as a useful “clock” of the time elapsed since the last major SF episode. If, however, the time lag required for massive stars ejecta to cool and mix with the ISM is longer than 108 yrs, then the N/O ratio is unlikely to accurately reflect the time since the most recent starburst.
Further observational or theoretical work showing that the timescales for cooling and mixing of hot supernova ejecta from massive star clusters are 108 (but 107 years implied by the lack of observed self-enrichment in H II regions) years would add plausibility to the clock hypothesis. A further test of the clock hypothesis will come from measuring star formation histories in galaxies spanning a range of N/O ratios. Unfortunately, all of the objects in this sample except NGC 4861 are too far away to directly investigate their star formation histories from stellar color-magnitude diagrams. Infrared imaging of the underlying older stellar population could, in principle, provide an estimate of the relative ages of each burst.
The Differential Mass Loss Hypothesis
Under this hypothesis which involves differential heavy element loss in galactic winds, the IMF is universal, constant in time and the N/O ratio for a given galaxy does not change with time as long as the fraction of heavy elements that are lost in galactic winds remains constant. The hypothetical role of metal-enriched galactic winds has been discussed extensively (Mathews & Baker 1971; Dekel & Silk 1986; Vader 1987; De Young & Gallagher 1990). Preferential loss of oxygen and Type II SNe products seems required in some cases to avoid “overproducing” oxygen in low mass galaxies (Marconi, Matteucci, & Tosi 1994; Esteban & Peimbert 1995) but observational evidence (Marlowe et al. 1995 and references therein) for their impact on the evolution of galaxies is still inconclusive.
In the context of this fourth hypothesis, we predict that UM 469, which has the highest N/O and C/O ratios, has suffered the strongest O loss, while T1345-420, with the lowest N/O and C/O ratios, retains metals produced in supernovae most efficiently of the three. Velocity resolved spectroscopy of the ionized gas in each object could address whether galactic winds or “blowout” are presently occurring. H or H I mapping would provide estimates of important parameters which affect the mass loss rates in galaxies, such as the gas content and potential well depth. Given the difficulty in establishing the magnitude of galactic winds even in local galaxies, it is unlikely that the distant UM 469 could be investigated in this manner. The nearer objects, however, are prime targets for further observations.
6 Conclusions
New measurements of the C abundance in a sample of three starforming galaxies with 12+log(O/H)8.1 reveal evidence of a correlation between the N/O and C/O ratios. Objects with higher N/O also have higher C/O, consistent with the idea that C and N production nucleosynthesis is dominated by low to intermediate mass stars. The slope of the relationship is presumably fixed by the IMF which dictates the ratio of low-mass C-producing stars to intermediate mass stars which are thought to dominate N production. The observed correlation is inconsistent with the chemical “pollution” scenario whereby massive stars and Wolf-Rayet winds create localized N enhancements, unless massive stars also produce proportionally large localized C enhancements, contrary to theoretical expectations. Although we reject localized chemical pollution from massive stars as an explanation for the scatter in N/O and C/O at a given metallicity, we outline three additional hypotheses capable of explaining the data, and we suggest approaches to discriminate between them. At the present time, these conclusions are based upon only 5 objects, and should be treated as preliminary. More C abundance measurements in galaxies with high N/O ratios and 12+log(O/H)8.1 are needed to establish strength and form of the C/O versus N/O relationship.
We have also presented a comparison of the C/O ratios in H II regions derived independently from the C++/O++ ratios (via C III] 1909 and [O III] 5007 lines) and from the C+/O+ ratios (via C II] 2326 and [O II] 3727 lines). Both approaches yield C/O ratios that agree to within the formal uncertainties. Considering that C+ is a trace species in H II regions, and that C II] 2326 is blended with the [O III] 2321,2331 lines at low spatial resolutions, the good agreement between C++/O++ and C+/O+ diagnostics suggests that this method may be useful for determining carbon abundances in emission-line galaxies when data on the dominant ionization species, C++ and O++, are not available. Both approaches are limited primarily by uncertainties on the measured electron temperature and uncertainties in the extinction law used to deredden the ultraviolet lines. More precise measurements of the C/O ratios in galaxies can be made using the O III] 1666/C III] 1909 line ratio which is less sensitive to reddening and temperature errors than the method used here, but this generally requires objects with high nebular surface brightness and/or an instrument with excellent UV sensitivity. Although C II] 2326 is typically quite weak in extragalactic H II regions, observations of this multiplet, along with [O II] 3727, can, in principle, be used to assess the C/O ratios of high-redshift emission line objects out to .
References
- (1) Arnault, Ph., Kunth, D., & Schild, H. 1989, A&A, 224, 73
- (2) Audouze, J., & Tinsley, B. M. 1976, ARA&A, 14, 43
- (3) Beck, S., Turner, J. L., Ho, P. T. P., Lacy, J. H., & Kelly, D. M. 1996, ApJ, 457, 610
- (4) Blum, D. B., & Pradhan, A. K. 1992, ApJS, 80, 425
- (5) Burstein, D., & Heiles, C. 1984, ApJS, 54, 33
- (6) Campbell, A., Terlevich, R. J., & Melnick, J. 1986, MNRAS, 223, 811 (CTM)
- (7) Carigi, L., Colin, P., Peimbert, M., & Sarmiento, A. 1995, ApJ, 445, 98
- (8) Charlot, S., Ferrari, F., Mathews, G. J., & Silk, J. 1993, ApJ, 419, L57
- (9) Clayton, D. D., & Pantelaki, I. 1993, Phys. Reports, 227, 293
- (10) Deeg, H. 1993, Ph.D. Thesis, University of New Mexico
- (11) Dekel, A., & Silk, J. 1986, ApJ, 303, 39
- (12) Devost, D., Roy, J.-R., & Drissen, L. 1997, ApJ, 482, 765
- (13) De Young, D. S., & Gallagher, J. S. III 1990, ApJ, 356, L15
- (14) Dinnerstein, H. L., & Shields, G. A. 1986, ApJ, 311, 45
- (15) Dufour, R. J., & Harlow, W. V. 1977, ApJ, 216, 706
- (16) Dufour, R. J., Schiffer, F. H., & Shields, G. A. 1984, in Future of Ultraviolet Astronomy Based on Six Years of IUE Research, eds. J. Mead, R. Chapman, & Y. Kondo (Washington, D.C., NASA)
- (17) Dufton, P. L., Berrington, K. A., Burke, P. G., & Kingston, A. E. 1978, A&A, 62, 111
- (18) Edmunds, M. G., & Pagel, B. E. J. 1978, MNRAS, 185, 78p
- (19) Esteban, C., & Peimbert, M. 1995, A&A, 300, 78
- (20) Garnett, D. R. 1990, ApJ, 363, 142
- (21) Garnett, D. R., & Chu, Y. H. 1994, PASP, 106, 626
- (22) Garnett, D. R., Dufour, R. J., Peimbert, M., Torres–Peimbert, S., Shields, G. A., Skillman, E. D., Terlevich, E, & Terlevich, R. J. 1995b, ApJ, 449, L77
- (23) Garnett, D. R., Skillman, E. D., Dufour, R. J., Peimbert, M., Torres–Peimbert, S., Terlevich, E, Terlevich, R. J., & Shields, G. A. 1995a, ApJ, 443, 64
- (24) Garnett, D. R., Skillman, E. D., Dufour, R. J., & Shields, G. A. 1997, ApJ, 481, 174
- (25) Gonzalez-Delgado, R. M., Pŕez, Enrique, Tenorio-Tagle, G., et al. 1994, ApJ, 437, 239
- (26) Hill, R. J., Madore, B. F., & Freedman, W. L. 1995, ApJ, 429, 204
- (27) Howarth, I. D. 1983, MNRAS, 203, 301
- (28) Hunter, D. A., Light, R. M., Holtzman, J. A., Lynds, R., O’Neil, E. J., & Grillmair, C. J. 1997, ApJ, 478, 124
- (29) Kobulnicky, H. A., & Skillman, E. D. 1996, ApJ, 471, 211
- (30) Kobulnicky, H. A., & Skillman, E. D. 1997, ApJ, in press
- (31) Kobulnicky, H. A., Skillman, E. D., Roy, J–R., Walsh, J., & Rosa, M. 1997, ApJ, 477, 679
- (32) Kunth, D., & Sargent, W. L. W. 1986, ApJ, 300, 496
- (33) Maeder, A., & Meynet, G. 1994, A&A, 287, 803
- (34) Marconi, G., Matteucci, F., & Tosi, M. 1994, MNRAS, 270, 35
- (35) Marlowe, A. T., Heckman, T. M., Wyse, R. F. G., & Schommer, R. 1995, ApJ, 438, 563
- (36) Masegosa, J., Moles, M., & del Olmo, A. 1991, A&A, 249, 505
- (37) Mathews, W. G. & Baker, J. C. 1971, ApJ, 170, 241
- (38) Matteucci, F. 1986, MNRAS, 221, 911
- (39) Olive, K. A., & Steigman, G. 1995, ApJS, 97, 49
- (40) Oke, J. B. 1990, AJ, 99, 1621
- (41) Pagel, B. E. J. 1994, in The Formation and Evolution of Galaxies, ed. C. Muñoz-Tuñóu, & F. Sánchez, Cambridge University Press, 149
- (42) Pagel, B. E. J., & Edmunds, M. G., Fosbury, R. A. E., & Webster, B. L. 1978, MNRAS, 184, 569
- (43) Pagel, B. E. J., Edmunds, M. G., & Smith, G. 1980, MNRAS, 193, 219
- (44) Pagel, B. E. J., Terlevich, R. J., & Melnick, J. 1986, PASP, 98, 1005
- (45) Pagel, B. E., Simonson, E.A., Terlevich, R. J., & Edmunds, M. G. 1992, MNRAS, 255, 325
- (46) Pantelaki, I. 1988, PhD thesis, Rice University
- (47) Parker, J. W., & Garmany, C. D. 1993, AJ, 106, 1471
- (48) Peimbert, M., Sarmiento, A., & Fierro, J. 1991, PASP, 103, 815
- (49) Peimbert, M. 1993, Rev. Mex. A&A, 27, 9
- (50) Pilyugin, L. S. 1992, A&A, 260, 58
- (51) Pradhan, A. K., & Peng, J. 1996, in The Analysis of Emission Lines ed. R. E. Williams & M. Livio, Cambridge University Press
- (52) Prévot, M. L., Lequeux, J., Maurice, E., Prévot, L., & Rocca-Volmerange, B. 1984, A&A, 132, 389
- (53) Renzini, A., & Voli, M. 1981, A&A, 94, 175
- (54) Rieke, G. H., Lebofsky, M. J., & Walker, C. E. 1988, ApJ, 325, 679
- (55) Roy, J. R., Belley, J., Dutil, Y., & Martin, P. 1996, ApJ, 460, 284
- (56) Russell, S. C., & Dopita, M. A. 1990, ApJS, 74, 93
- (57) Schaller, G., Schaerer, D., Maynet, G., & Maeder, A. 1992, A&AS, 96, 269
- (58) Seaton, M. J. 1979, MNRAS, 187, 73p
- (59) Shaw, R. A., & Dufour, R. J. 1995, PASP, 107, 896
- (60) Skillman, E. D. 1989, ApJ, 347, 883
- (61) Skillman, E. D., Bomans, D. J., & Kobulnicky, H. A. 1996, ApJ, 474, 205
- (62) Skillman, E. D., & Kennicutt, R. C. 1993, ApJ, 411, 655
- (63) Stasińska, G. 1990, A&AS, 83, 501
- (64) Stasińska, G., & Leitherer, C. 1996, ApJS, 107, 661
- (65) Tenorio-Tagle, G. 1996, AJ, 111, 1641
- (66) Thuan, T. X., Izotov, Y. I., & Lipovetsky, V. A. 1995, ApJ, 445, 108
- (67) Timmes, F. X., Woosley, S. E., & Weaver, T. A. 1995, ApJS, 98, 617
- (68) Tinsley, B. 1974, ApJ, 192, 629
- (69) Tinsley, B. 1976, ApJ, 208, 797
- (70) Vader, P. 1987, ApJ, 317, 128
- (71) Walsh, J. R., & Roy, J-R. 1989, MNRAS, 239, 297
- (72) Walsh, J. R., & Roy, J-R. 1993, MNRAS, 262, 27
- (73) Welch, G. A. 1970, ApJ, 161, 821
- (74) Woosley, S. E., & Weaver, T. A. 1995, ApJS, 101, 181
- (75)