The Spectral Character of Giant Planets and Brown Dwarfs
Abstract
Since October of 1995, employing Doppler spectroscopy astronomers have discovered as many as 20 giant planets and brown dwarfs, including companions to Boo, 51 Peg, And, 55 Cnc, CrB, 70 Vir, 16 Cyg B, and 47 UMa. These discoveries have galvanized the planetary science community, astronomers, and the public at large. Within hours of the announcement of the planet 51 Peg b, the first direct detection of an unimpeachable brown dwarf, Gl229 B, was also announced. Gl229 B is a watershed since it has methane spectral features and a surface temperature below 1000 Kelvin, characteristics unique to objects with substellar masses.
During the last two years, building upon our previous experience in the modeling of brown dwarfs and M stars, we published theoretical studies of the evolution and spectra of extrasolar giant planets. We have recently upgraded our capabilities and now generate non–gray spectral and color models of both giant planets and brown dwarfs. This theory will soon encompass objects whose effective temperatures range from 100 K to 4000 K and whose masses span three orders of magnitude. The evolutionary, spectral, and color calculations upon which we have embarked are in direct support of the searches now being planned in earnest with the HST (WFPC2, NICMOS), the IRTF, the MMT 6.5-meter upgrade, the Large Binocular Telescope (LBT), Keck’s I and II, ISO, UKIRT, NGST, the VLT, COROT, DENIS, 2MASS, and SIRTF.
1. Introduction
Using Doppler spectroscopy astronomers are populating a zoo of giant planets and brown dwarfs orbiting nearby stars, including Boo, 51 Peg, And, 55 Cnc, CrB, 70 Vir, 16 Cyg B, and 47 UMa (Noyes et al. 1997; Butler et al. 1997; Cochran et al. 1997; Marcy & Butler 1996; Butler & Marcy 1996; Mayor & Queloz 1995; Latham et al. 1989). Table 1 lists these newly–discovered planets/brown dwarfs, in order of increasing semi–major axis, along with the giant planets in our solar system and the brown dwarf Gl229 B. The direct detection of Gl229 B (Oppenheimer et al. 1995; Nakajima et al. 1995; Matthews et al. 1996; Geballe et al. 1996; Marley et al. 1996; Allard et al. 1996; Tsuji et al. 1996) was a watershed, since it has methane spectral features and an inferred effective temperature (in this case, Teff950 K) far below that at the solar–metallicity main sequence edge (1750 K, Burrows et al. 1993). In addition, the almost complete absence of the spectral signatures of metal oxides and hydrides (such as TiO, VO, FeH, and CaH) is in keeping with theoretical predictions that these species are depleted in the atmospheres of all but the youngest (hence, hottest) substellar objects and are sequestered in condensed form below the photosphere (Lunine et al. 1989; Marley et al. 1996). Also shown in Table 1 are the primary’s metallicity (G. Gonzalez, private communication), Mpsin (i), orbit period, eccentricity, and distance to the sun. The wide range in mass and period, as well as the proximity of many of the planets/brown dwarfs to their primaries, was not anticipated by most planetary scientists. Though the technique of Doppler spectroscopy used to find most of these companions selects for massive, nearby objects, their variety and existence is a challenge to conventional theory. Since direct detection is now feasible, and has been demonstrated by the recent acquisition of Gl229 B, it is crucial for the future of extrasolar planet searches that the spectra, colors, evolution, and physical structure of objects from Saturn’s mass (0.3 Jupiter’s mass, ) to 70 be theoretically investigated.
In parallel with these recent planetary and brown dwarf discoveries has been the much more detailed scrutiny in the optical and the near–infrared of hot young brown dwarfs and late M dwarfs near the main–sequence edge (cf. Kirkpatrick, Henry, & Simons 1995; Jones & Tsuji 1997; Zapatero-Osorio et al. 1996; Tinney et al. 1995; Delfosse 1997). Finally, we are obtaining photometry and spectroscopy for collections of objects that bracket the substellar limit. What they reveal is a plethora of objects that populate a rising mass function, though not one that rises fast enough to have significant dynamical consequences for the galactic disk or halo (Chabrier & Baraffe 1997). Nevertheless, it is clear that edge objects reside in an unanticipated region of the H–R diagram and are much bluer in the near infrared than one would have expected from naive extrapolations of the early M dwarf sequence. Grain formation, metal depletions (e.g., TiO into perovskite, CaTiO3), and a shift of the important molecules with decreasing Teff are needed to understand high–gravity atmospheres from 3000 K to 1500 K (Lunine et al. 1989; Tsuji et al. 1996; Allard et al. 1996). Clearly, new theoretical insights are required to separate very young and hot brown dwarfs from the more massive M dwarfs.
During the last two years, building upon our previous experience in the modeling of brown dwarfs and M stars, we published theoretical studies of the evolution and spectra of extrasolar giant planets (EGPs) (Burrows et al. 1995; Saumon et al. 1996; Guillot et al. 1996; Marley et al. 1996; Burrows et al. 1997). This work, initiated before the first discovery announcements in October of 1995, is described below.
Some of the space platforms and new ground–based facilities that have or will obtain infrared and optical data of extrasolar planets and brown dwarfs include the HST (WFPC2, NICMOS), the IRTF, the MMT 6.5-meter upgrade (Angel 1994), the Large Binocular Telescope (LBT) (planned for Mt. Graham), Keck’s I and II, the European ISO, UKIRT, NGST, the VLT, COROT, DENIS, 2MASS, and SIRTF. One project of the Keck I and II facility, under the aegis of NASA’s ASEPS-0 (Astronomical Study of Extrasolar Planetary Systems) program, will be to search for giant planets around nearby stars. A major motivation for the Palomar Testbed Interferometer supported by NASA is the search for extrasolar planets. Recently, the NASA administrator outlined a program to detect planetary systems around nearby stars that may become a future scientific focus of NASA. This vision is laid out in the Exploration of Neighboring Planetary Systems (ExNPS) Roadmap (see also the “TOPS” Report, 1992).
| Object | Star | M∗ (M⊙) | L∗ (L⊙) | d (pc) | [Fe/H] | M (MJ) | (AU) | P (days) | |
|---|---|---|---|---|---|---|---|---|---|
| HD283750 | K2V? | 0.75? | 0.2? | 16.5 | ? | 50 | 0.04 | 1.79 | 0.02 |
| Boo b | F7V | 1.25 | 2.5 | 15 | +0.34 | 3.44 | 0.046 | 3.313 | 0.0162 |
| 51 Peg b | G2.5V | 1.0 | 1.0 | 15.4 | +0.21 | 0.45 | 0.05 | 4.23 | 0.0 |
| HD98230 | G0V | 1.1 | 1.5 | 7.3 | -0.12 | 37 | 0.05 | 3.98 | 0.0 |
| And b | F7V | 1.25 | 2.5 | 17.6 | +0.17 | 0.68 | 0.058 | 4.61 | 0.109 |
| 55 Cnc b | G8V | 0.85 | 0.5 | 13.4 | +0.29 | 0.84 | 0.11 | 14.76 | 0.051 |
| CrB b | G0V | 1.0 | 1.77 | 17.4 | -0.19 | 1.13 | 0.23 | 39.65 | 0.028 |
| HD112758 | K0V | 0.8 | 0.4 | 16.5 | ? | 35 | 0.35 | 103.22 | 0.16 |
| HD114762 | F9V | 1.15 | 1.8 | 28 | -0.60 | 10 | 0.38 | 84 | 0.25 |
| 70 Vir b | G4V | 0.95 | 0.8 | 18.1 | -0.03 | 6.9 | 0.45 | 116.7 | 0.40 |
| HD140913 | G0V | 1.1 | 1.5 | ? | ? | 46 | 0.54 | 147.94 | 0.61 |
| HD89707 | G1V | 1.1 | 1.3 | 24.5 | -0.423 | 54 | 0.69 | 198.25 | 0.95 |
| BD -04782 | K5V | 0.7 | 0.1 | ? | ? | 21 | 0.7 | 240.92 | 0.28 |
| HD110833 | K3V | 0.75 | 0.2 | 16 | ? | 17 | 0.8 | 270.04 | 0.69 |
| HD217580 | K4V | 0.7 | 0.1 | 18.5 | ? | 60 | 1.0 | 1.24 yrs | 0.52 |
| HD18445 | K2V | 0.75 | 0.2 | 20 | ? | 39 | 1.2 | 1.52 yrs | 0.54 |
| 16 Cyg Bb | G2.5V | 1.0 | 1.0 | 22 | 0.11 | 1.66 | 1.7 | 2.19 yrs | 0.57 |
| 47 UMa b | G0V | 1.1 | 1.5 | 14.1 | +0.01 | 2.4 | 2.1 | 2.98 yrs | 0.03 |
| HD29587 | G2V | 1.0 | 1.0 | 42 | ? | 40 | 2.1 | 3.17 yrs | 0.0 |
| Gl 411 b | M2V | 0.4 | 0.02 | 2.52 | -1.0 | 0.9 | 2.38 | 5.8 yrs | ? |
| 55 Cnc c | G8V | 0.85 | 0.5 | 13.4 | +0.29 | 5 | 3.8 | 8 yrs | ? |
| Jupiter | G2V | 1.0 | 1.0 | 0.0 | 0.0 | 1.00 | 5.2 | 11.86 yrs | 0.048 |
| Saturn | G2V | 1.0 | 1.0 | 0.0 | 0.0 | 0.3 | 9.54 | 29.46 yrs | 0.056 |
| Gl 229 B | M1V | 0.45 | 0.03 | 5.7 | +0.20 | 30-55 | 44.0 | 400 yrs | ? |
2. Previous Gray Models of Giant Planets and Brown Dwarfs
In 1995, our group (Burrows, Saumon, Guillot, Hubbard & Lunine 1995; Saumon, Hubbard, Burrows, Guillot, Lunine, & Chabrier 1996) calculated a suite of models of the evolution and emissions of EGPs, under the problematic black body assumption. We derived fluxes and dimensions as a function of age, composition, and mass, both as a guide for giant planet searches and as a tool for interpreting the results of any positive detections. It has long been recognized (D’Antona & Mazzitelli 1985; Stevenson 1991) that the same physics governs the structure and evolution of the suite of electron-degenerate and hydrogen-rich objects ranging from M dwarfs (0.08 ) and brown dwarfs (at the high–mass end) to Jupiters and Saturns (at the low–mass end). Surprisingly, no one had accurately mapped out the properties of objects between the mass of giant planets in our solar system and the traditional brown dwarfs (15 , where is the mass of Jupiter, 10-3 ). This is precisely the mass range for many of the newly–discovered planets listed in Table 1.
EGPs radiate in the optical by reflection and in the infrared by the thermal emission of both absorbed stellar light and the planet’s own internal energy. To calculate their cooling curves, we used the Henyey code previously constructed to study brown dwarfs and M dwarfs (Burrows, Hubbard, & Lunine 1989; Burrows et al. 1993). Below effective temperatures (Teff) of 600 K, we employed the atmospheres of Graboske et al. (1975), who included opacities due to water, methane, ammonia, and collision-induced absorption by H2 and He. The gravity dependence of the EGP atmospheres was handled as in Hubbard (1977). Above TK, we used the X model of Burrows et al. (1993). The two prescriptions were interpolated in the overlap region. We employed the hydrogen/helium equation of state of Saumon & Chabrier (1991, 1992) and Saumon, Chabrier, & Van Horn (1995) and ignored rotation and the possible presence of an ice/rock core (Pollack 1984; Bodenheimer & Pollack 1986). In Burrows et al. (1995) and Saumon et al. (1996), the EGPs were assumed to be fully convective at all times. We included the effects of “insolation” by a central star and considered semi-major axes () between 2.5 A.U. and 20 A.U. Giant planets may form preferentially near 5 A.U. (Boss 1995), but as the new data dramatically affirm, a broad range of s can not be excluded. We assumed that the Bond albedo of an EGP is that of Jupiter (0.35, Conrath, Hanel, & Samuelson 1989). For the Burrows et al. (1995) study, we evolved EGPs with masses from 0.3 (the mass of Saturn) through 15 . Whether a 15 object is a planet or a brown dwarf is largely a semantic issue, though one might distinguish gas giants and brown dwarfs by their mode of formation (e.g., in a disk or “directly”). Physically, compact hydrogen-rich objects with mass es from 0.00025 through 0.25 form a continuum. However, EGPs above 13 do burn “primordial” deuterium for up to 108 years.
If 51 Peg b is a gas giant, its radius is only 1.2 RJ and its luminosity is about . This bolometric luminosity is more than times the present luminosity of Jupiter and only a factor of two below that at the edge of the main sequence. The radiative region encompasses the outer 0.03% in mass, and 3.5% in radius. The study by Guillot et al. (1996) demonstrated that 51 Peg b is well within its Roche lobe and is not experiencing significant photoevaporation. Its deep potential well ensures that, even so close to its parent, 51 Peg b is stable. If 51 Peg b were formed beyond an A.U. and moved inward on a timescale greater than years, it would closely follow the Rtrajectory to its equilibrium position.
3. New Non–Gray Models
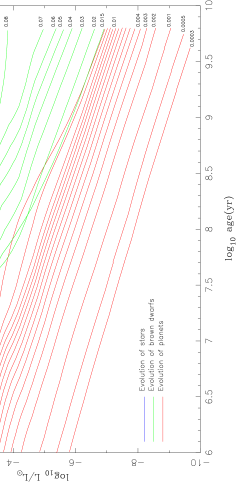
However, to credibly estimate the infrared band fluxes and improve upon the black body assumption made in Burrows et al. (1995) and Saumon et al. (1996), we have recently performed non-gray simulations at solar–metallicity of the evolution, spectra, and colors of isolated EGP/brown dwarfs down to Teffs of 100 K (Burrows et al. 1997). Figure 1 portrays the luminosity versus time for objects from Saturn’s mass (0.3 ) to 0.2 for this model suite.
The early plateaux between 106 years and 108 years are due to deuterium burning, where the initial deuterium mass fraction was taken to be 210-5. Deuterium burning occurs earlier, is quicker, and is at higher luminosity for the more massive models, but can take as long as 108 years for a 15 object. The mass below which less than 50% of the “primordial” deuterium is burnt is 13 (Burrows et al. 1995). On this figure, we have arbitrarily classed as “planets” those objects that do not burn deuterium and as “brown dwarfs” those that do burn deuterium, but not light hydrogen. While this distinction is physically motivated, we do not advocate abandoning the definition based on origin. Nevertheless, the separation into M dwarfs, “brown dwarfs”, and giant “planets” is useful for parsing by eye the information in the figure
In Figure 1, the bumps between 10-4 and 10-3 and between 108 and 109 years, seen on the cooling curves of objects from 0.03 to 0.08 , are due to silicate and iron grain formation. These effects, first pointed out by Lunine et al. (1989), occur for Teffs between 2500 K and 1300 K. The presence of grains affects the precise mass and luminosity at the edge of the main sequence. Since grain and cloud models are problematic, there still remains much to learn concerning their role and how to model them (Lunine et al. 1989; Allard et al. 1997).
To constrain the properties of the brown dwarf Gl229 B (Oppenheimer et al. 1995; Nakajima et al. 1995; Geballe et al. 1996; Matthews et al. 1996), we (Marley, Saumon, Guillot, Freeman, Hubbard, Burrows, & Lunine 1996) constructed a grid of atmospheres with Teff ranging from 600 to 1200 K and cm s-2 3.2 cm s-2. For each case we computed a self–consistent radiative-convective equilibrium temperature profile and the emergent radiative flux. By comparing our theoretical spectra with the UKIRT (Geballe et al. 1996) and HST (Matthews et al. 1996) data, we derived an effective temperature of K and a gravity between cm s-2 and cm s-2. These results translate into masses and ages of 20–55 and 0.5–5 Gyr, respectively. Gravity maps almost directly into mass, and ambiguity in the former results in uncertainty in the latter. The Marley et al. (1996) study was nicely complemented in the literature by the Gl229 B calculations of Allard et al. (1996) and Tsuji et al. (1996).
The studies of Burrows et al. (1997) and Marley et al. (1996) revealed major new aspects of EGP/brown dwarf atmospheres that bear listing and that uniquely characterize them. Below Teffs of 1300 K, the dominant equilibrium carbon molecule is CH4, not CO, and below 600 K the dominant nitrogen molecule is NH3, not N2 (Fegley & Lodders 1996). The major opacity sources are H2, H2O, CH4, and NH3. For Teffs below 400 K, water clouds form at or above the photosphere and for Teffs below 200 K, ammonia clouds form (viz., Jupiter). Collision–induced absorption of H2 partially suppresses emissions longward of 10 m. The holes in the opacity spectrum of H2O that define the classic telluric IR bands also regulate much of the emission from EGP/brown dwarfs in the near infrared. Importantly, the windows in H2O and the suppression by H2 conspire to force flux to the blue for a given Teff. The upshot is an exotic spectrum enhanced relative to the black body value in the and bands (1.2 m and 1.6 m, respectively) by as much as two to ten orders of magnitude, depending upon Teff. Figure 2 depicts spectra between 1 m and 10 m at a detector 10 parsecs away from solar–metallicity objects with age 1 Gyr and masses from 1 through 40 .
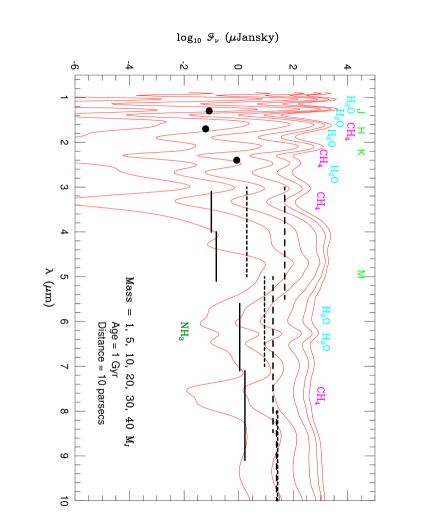
Superposed are putative sensitivities for the three NICMOS cameras (Thompson 1992), ISO (Benvenuti et al. 1994), SIRTF (Erickson & Werner 1992), and Gemini/SOFIA (Mountain et al. 1992; Erickson 1992). Figure 2 demonstrates how unlike a black body an EGP spectrum is. For example, the enhancement at 5 m for a 1 Gyr old, 1 extrasolar planet is by four orders of magnitude. Figure 3 portrays the evolution from 0.1 Gyr to 5 Gyr of the spectrum from 1 m to 10 m of a 10object in isolation, without a reflected component. The higher curves are for the younger ages. and some of the molecular features are identified.
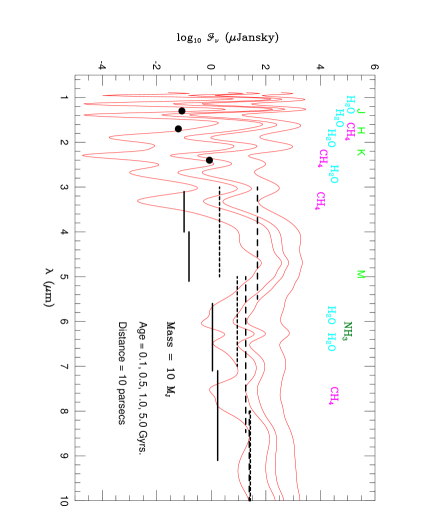
As Teff decreases below 1000 K, the flux in the band (5 m) is progressively enhanced relative to the black body value. While at 1000 K there is no enhancement, at 200 K it is near 105. Hence, the , , and bands are the premier bands in which to search for cold substellar objects. The band (1.05 m) is also super–black–body over this Teff range. However, there is a NH3 feature in the band that was not in our database. This will likely reduce the flux in this band for the cooler models. Eventhough band (2.2 m) fluxes are generally higher than black body values, H2 and CH4 absorption features in the band decrease its importance relative to and . As a consequence of the increase of atmospheric pressure with decreasing Teff, the anomalously blue and colors get bluer, not redder.

To illustrate this, Figure 4 shows a representative color–magnitude diagram ( versus ) for solar–metallicity objects with masses from 3 to 40 , for ages of 0.5, 1.0, and 5.0 Gyr. Included are the corresponding black body curves, hot, young brown dwarf or extremely late M dwarf candidates such as LHS2924, GD 165B, Calar 3, and Teide 1 (Kirkpatrick, Henry, & Simons 1994,1995; Zapatero-Osorio, Martin, & Rebolo 1997; Martin, Rebolo, & Zapatero-Osorio 1996), and a sample of M dwarfs from Leggett (1992). This figure illustrates the unique color realms occupied by extrasolar giant planets and brown dwarfs. Figure 4 portrays the fact that the and versus infrared H–R diagrams loop back to the blue below the edge of the main sequence and are not continuations of the M dwarf sequence into the red. The difference between the black body curves and the model curves is between 3 and 10 magnitudes for versus , more for versus . Gl229 B fits nicely among these theoretical isochrones. The suppression of by H2 and CH4 features is largely responsible for this anomalous blueward trend with decreasing mass and Teff. Tables 2 and 3 depict absolute magnitudes and colors in the IR as a function of gravity and effective temperature for the full range of EGPs and brown dwarfs. The gravity dependences of the colors are not small. However, these tables should be viewed with caution until higher–resolution spectra and a better methane opacity database are both available.
| (cm s-2) | (K) | ||||||
|---|---|---|---|---|---|---|---|
| (cm s-2) | (K) | |||||
|---|---|---|---|---|---|---|
| 1000.0 | 0.35 | -0.28 | -0.63 | 2.28 | 0.05 | |
| 800.0 | 0.43 | -0.65 | -1.08 | 2.96 | -0.15 | |
| 600.0 | 0.51 | -1.36 | -1.87 | 4.09 | -0.27 | |
| 500.0 | 0.57 | -2.00 | -2.57 | 5.02 | -0.27 | |
| 1000.0 | 0.44 | -0.02 | -0.46 | 1.99 | 0.09 | |
| 800.0 | 0.50 | -0.37 | -0.87 | 2.58 | -0.12 | |
| 600.0 | 0.57 | -0.94 | -1.51 | 3.49 | -0.27 | |
| 400.0 | 0.63 | -2.64 | -3.27 | 5.99 | -0.08 | |
| 300.0 | 0.71 | -4.12 | -4.83 | 8.17 | 0.34 | |
| 1000.0 | 0.55 | 0.40 | -0.15 | 1.55 | 0.13 | |
| 800.0 | 0.59 | -0.06 | -0.65 | 2.22 | -0.10 | |
| 600.0 | 0.66 | -0.62 | -1.28 | 3.05 | -0.26 | |
| 400.0 | 0.46 | -2.10 | -2.56 | 5.12 | -0.08 | |
| 1000.0 | 0.82 | 0.92 | 0.10 | 0.74 | 0.21 | |
| 800.0 | 0.78 | 0.42 | -0.36 | 1.62 | -0.10 | |
| 600.0 | 0.69 | -0.28 | -0.97 | 2.73 | -0.24 | |
| 400.0 | 0.45 | -1.65 | -2.10 | 4.73 | -0.05 | |
| 200.0 | 0.56 | -4.25 | -4.81 | 8.91 | 0.67 |
Ignoring for the moment the question of angular resolution, one can compare the theoretical solar–metallicity spectrum and color predictions of Burrows et al. (1997) with putative detector sensitivities to derive encouraging detection ranges. For example, at 5 m, SIRTF might see a 1 Gyr old, 1 object in isolation out to nearly 100 parsecs. The range of NICMOS in for a 1 Gyr old, 5 object is approximately 300 parsecs, while for a coeval 40 object it is near 1000 parsecs. Furthermore, SIRTF will be able to see at 5 m a 5 Gyr old, 20 object in isolation out to 400 parsecs and NICMOS will be able to see at or a 0.1 Gyr old object with the same mass out to 2000 parsecs. These are dramatic numbers that serve to illustrate both the promise of the new detectors and the enhancements we theoretically predict.
4. Model Ingredients
The ingredients needed to generate non–gray spectral, color, and evolutionary models of M dwarfs, brown dwarfs, and EGPs are clear. They include (1) equations of state for metallic hydrogen/helium mixtures and molecular atmospheres, (2) chemical equilibrium codes and thermodynamic data to determine the molecular fractions, (3) scattering and absorption opacities for the dominant chemical species, (4) an atmosphere code to calculate temperature/pressure profiles and to identify the radiative and convective zones, (5) an algorithm for converting a grid of atmospheres into boundary conditions for evolutionary calculations, (6) a Henyey code, and (7) a radiative transfer code to provide emergent spectra. In principle, the calculation of the atmosphere, involving as it does radiative transfer, and the calculation of the emergent spectrum are done together.
4.1. Opacities
For solar metallicity, near and above brown dwarf/EGP photospheres, throughout most of their lives the dominant equilibrium form of carbon is CH4, not CO, that of oxygen is H2O, and that of nitrogen is either N2 or NH3, depending upon Teff (Fegley & Lodders 1996). Hydrogen is predominantly in the form of H2. Silicates and metals are found at high optical depths and temperatures. Clouds of NH3 and H2O can form for Teffs below 200 K and 400 K, respectively. For the Burrows et al. (1997) models, we precipitated species according to their condensation curves, but did not consistently incorporate the effects of the associated clouds. If a species condensed, it was left at its saturated vapor pressure.
Water is an important source of opacity in late stellar and substellar objects, particularly when the many lines that originate from highly excited energy levels are considered. Depending upon the temperature of the layer, and the assumed abundance of water, well over lines could be required for a calculation at the highest temperatures, while far fewer lines are needed at lower temperatures. We use the new Partridge & Schwenke H2O database. A synopsis of the opacity and line profile data we have employed to simulate EGP and brown dwarf models follows.
Line Lists:
-
•
Partridge & Schwenke (1997) H2O database: lines
-
•
HITRAN database (Rothman et al. 1992, 1997)
-
•
GEISA database (Husson et al. 1997)
-
•
CH4 and CH3D, lines; CO, lines, NH3, lines, PH3, lines, H2S, lines (Tyuterev et al. 1994; Goorvitch 1994; Tipping 1990; Wattson & Rothman 1992; L. R. Brown, private communication)
-
•
Modeled continuum opacity sources: and opacity and collision–induced absorption (CIA) of H2 and helium (Borysow & Frommhold 1990; Zheng & Borysow 1995); Rayleigh scattering: Rages et al. (1991)
Line Profiles:
-
•
Line widths assumed to be due to H2 or H2 + He broadening: H2O (Brown & Plymate 1996; Gamache, Lynch, & Brown 1996), CO (Bulanin et al. 1984; LeMoal & Severin 1986); CH4 (Margolis 1993,1996; L. R. Brown, private communication); PH3 (Levy, Lacome, & Tarrago 1994); NH3 (Brown & Peterson 1994)
-
•
For other species, use N2– and O2–induced widths
The k–coefficient Method:
-
•
The k–coefficient method (Goody et al. 1989; Lacis & Oinas 1991), widely used in planetary atmosphere and global climate modeling
-
•
Not the ODF technique (Saxner & Gustafsson 1984). That the gases have already been mixed before the k coefficients are derived greatly diminishes problems.
-
•
Typical errors in planetary atmospheres: between 1 and 10% (Grossman & Grant 1992,1994)
-
•
Supplemented by new Feautrier code, Bergeron atmosphere’s code, etc.

4.2. Chemical Equilibrium, Condensation, and Clouds
In the Burrows et al. (1997) exploration of EGPs and brown dwarfs, the chemical equilibrium calculations were performed with the ATLAS code and data from Kurucz (1970). Recently, to the ATLAS code and data from Kurucz (1970), we have added the JANAF tables and C. Sharp’s free–energy minimization code (150–1500 species). Condensation of CH4, NH3, H2O, Fe, and MgSiO3 was included using data from various sources, including Eisenberg & Kauzmann (1969), the Handbook of Chemistry and Physics (1993), and Lange’s Handbook of Chemistry (1979).
For Teffs below 1300 K, we assumed that Al, Ca, Ti and V were removed either by condensation or were dissolved in silicate grains at about the MgSiO3 condensation temperature. These atoms are important because they lead to molecules that are strong light absorbers, such as TiO and VO. However, they have not been detected in the giant planets of our solar system and shouldn’t be present in the atmospheres of relatively cool objects such as the brown dwarf Gl229 B (Marley et al. 1996). Figure 5 depicts composition profiles of some of the dominant molecular species found in one of our models of Gl229 B. It is clear from just this representative figure that the variation of composition is an important feature of dense, low–temperature atmospheres (Sharp and Wasserburg 1995). We are currently preparing a more comprehensive set of condensation curves for minor species with the EGP and brown dwarf atmosphere models of Burrows et al. (1997).
The presence of condensed species can radically alter the gas phase composition. For example, the abundance of H2S decreases rapidly with temperature due to the formation of the condensate FeS. In our theoretical model of Gl229 B, FeS, and of lesser importance due to the relatively low cosmic abundance of phosphorus, Mg3P2O8, form above the photosphere. This suggests that clouds containing grains of these species can form in the atmosphere, and possibly play an important role in modifying the emergent flux and in altering the Bond albedo. The more refractory condensates whose condensation points lie well below the photosphere still play an important role in depleting the observed atmosphere of a number of abundant elements, e.g., Si, Mg, Ca, and Fe. The direct effect of clouds on the emergent fluxes of EGPs and brown dwarfs in the important Teff range below 1300 K has yet to be properly addressed. However, the presence or absence of clouds strongly affects the reflection albedos of EGPs and brown dwarfs.
Cloud formation depletes a gas–phase absorber from certain regions of the atmosphere; if this occurs around the photosphere the resulting radiative balance and emergent flux distribution are modified. Because of condensation, we expect that the gaseous water bands will disappear for objects with effective temperature below about 400 K and that ammonia bands will disappear below Teffs of 200 K. We expect the disappearance of silicate or iron features below about 1200 K (depending, modestly, on surface gravity).
Beyond predicting where the water and ammonia bands should disappear due to condensation, the spectral and radiative effects of clouds are difficult to quantify. Simple models in which clouds are uniformly distributed over the surface of the EGP, and are characterized by a single particle size, fail to take account of atmospheric dynamics which can lead to dramatic changes in the effects of clouds. In particular, convective processes lead to growth in the mean particle size, as well as a potentially heterogenous distribution of clouds across the disk of the object. In the case of water and magnesium silicates, the latent heat of condensation increases the mean upwelling velocity and can exaggerate these effects, as quantified by Lunine et al. (1989). The simple model of the transport processes in magnesium silicate clouds presented in Lunine et al. suggests particle sizes in the range of 100 microns are possible by coalescence, much larger than the micron–sized particles one would assume from simple condensation. The radiative properties of a cloud clearly depend upon the actual particle size, as well as the large–scale cloud morphology (broken or continuous).
It is now clear that silicate grain formation modifies the characteristics of hot brown dwarfs () and late M dwarfs () in ways not fully understood (Lunine et al. 1989; Allard et al. 1997; Jones & Tsuji 1997; Tsuji et al. 1996). In particular, the near–infrared and optical colors of the objects newly discovered in the DENIS survey (Delfosse 1997), the 2MASS survey (Kirkpatrick, Beichman, & Skrutskie 1997), and in the Pleiades (Martin, Rebolo, & Zapatero-Osorio 1996) deviate from what is currently theoretically predicted by as much as one magnitude. Our group was the first to include silicate grains in calculations of the atmospheres of M and brown dwarfs (Lunine et al. 1986; Lunine et al. 1989). However, we produced only very low resolution spectra, and those were solely for the purposes of calculating boundary conditions for the evolutionary calculations, not for the generation of colors and useful spectra for objects above 2000 K. One of our goals for the future is to model the effects of refractory clouds at high Teffs and H2O and NH3 clouds at low Teffs on emergent spectra and colors.
5. Conclusions
Our previous theoretical work has led us to certain general conclusions, among which are:
-
•
The opacity due to grains lowers the Teff, the luminosity, and the mass at the edge of the solar–metallicity hydrogen–burning main sequence from 2000 K to 1750 K, from 10-4to 6.010-5, and from 0.085 to 0.074 , respectively.
-
•
H2O, H2, and CH4 dominate the spectrum below Teff1200 K. For such Teffs, most or all true metals are sequestered below the photosphere.
-
•
Enhancements and suppressions of the emergent flux relative to black body values can be by many orders of magnitude.
-
•
The infrared colors of EGPs, brown dwarfs, and M dwarfs are much bluer than the colors previously derived using either the black body assumption or primitive non–gray models.
-
•
In some IR colors (e.g., ), a substellar object gets bluer, not redder, with age and for a given age, lower–mass substellar objects are bluer than higher–mass substellar objects.
-
•
Clouds of H2O and NH3 are formed for Teffs below 400 K and 200 K, respectively. Their formation will affect the colors and spectra of EGPs and brown dwarfs in ways not yet fully characterized.
The present pace of M dwarf, brown dwarf, and giant planet discovery and NASA’s future plans for planet searches suggest that many more objects with Teffs from 200 K to 4000 K will be identified and subject to spectroscopic examination. We have now developed most of the theoretical tools necessary to support and interpret indirect observations (radial velocity, astrometry), direct detections, and the spectroscopy of the brighter objects. We will soon be able to reliably predict the spectral and broadband signatures of those objects that have not been directly detected, and constrain the atmospheric composition and thermal structure of those for which we do have color or spectroscopic information.
It is important to note that there is still considerable room for improvement in the modeling of substellar objects. The direct effects of grains and clouds for Teffs from 2000 K to 100 K has yet to be properly included and, in particular, should mute the extreme suppressions we see due to the H2O bands. In our recent work, we generated low–resolution spectra; higher–resolution spectra are necessary to obtain more accurate colors (Figure 4). The effect of metallicity has yet to be explored and promises to bring many surprises. Some opacity databases, especially that for CH4, are inadequate and bear directly upon the detectability and colors of EGPs. All in all, giant planet and brown dwarf theory should be a quite lively arena in the years ahead.
Acknowledgments.
We thank F. Allard, W. Benz, S. Kulkarni, J. Liebert, B. MacIntosh, G. Marcy, M. Mayor, and B. Oppenheimer for useful contributions and conversations. This work was supported under NSF grants AST-9318970 and AST-9624878, under NASA grants NAG5-2817, NAGW-2250, and NAG2-6007, and in part by the NSF under grant PHY94-07194 to the Institute for Theoretical Physics at Santa Barbara, California.
Discussion
Dr. John Stauffer: Are there specific gravity–dependent differences predicted in the spectra between a 70 Myr old 0.03 or 0.04 brown dwarf and a VLM stellar object of the same luminosity and Teff (other than Lithium)?
Adam Burrows: At a Pleiades age, Teff for 0.03 or 0.04 brown dwarfs is from 500 to 1000 K cooler than for 0.08 or 0.1 stars. The temperature differences alone will be sufficient to discriminate stellar from substellar, as will grain effects. In , , , , , the IR color differences between such brown dwarfs and a late M dwarf should be at least 0.5 magnitudes, with the star being at times bluer, at times redder, depending upon the color. In addition, the luminosity of such a 70 Myr brown dwarf is an order of magnitude lower than that of a coeval object destined to ignite hydrogen stably. However, the gravity differences per se are not large, and translate into perhaps a few tenths of a magnitude; in this, theory is not yet precise enough to pontificate. Work aplenty remains. In order to obtain sufficiently good gravities, I surmise that modest–resolution () IR spectroscopy and spectrophotometry will be necessary.
Dr. Axel Brandenburg: You mentioned using mixing–length theory, but then you didn’t talk about possible convection zones. Could you please comment on the existence, location, and nature of convective zones in brown dwarfs? What are typical convective velocities? Do brown dwarfs have magnetic fields?
Adam Burrows: This is a large subject in itself and has received extensive comment. In sum, brown dwarfs in isolation are almost completely convective; the outer radiative zones might comprise only 10-10 % by mass of the object. However, as Guillot et al. (1995) have shown, Jupiter itself may have an inner radiative zone near 1500 K that can confuse the entropy mapping between core and atmosphere. We see the same effect in brown dwarfs and I refer you to our recent paper (Burrows et al. 1997) for a more detailed discussion of this important point. Being convective, brown dwarfs should have magnetic fields and be active, though their luminosties are low and their convective velocities are correspondingly low ().
Dr. Mark Giampapa: For potential searches for brown dwarfs/large planets using photometric transits, the magnitude of the effect of warming on the radius of these objects which are in proximity to the primary becomes important. What is the magnitude of this effect?
Adam Burrows: For the companion to 51 Peg, we have estimated this effect to be a mere 20%. At a given distance, in a steady–state with stellar insolation lower–mass objects are generally larger. Younger objects may still be contracting on their Hayashi tracks and, hence, can also be larger than after they achieve equilibrium, but the radii of objects greater than one Jupiter mass are less than 2 Rwithin 106 yrs. There are some interesting exceptions, but these are good general rules; the effect is generally small.
Dr. B.H. Foing: You showed the high potential of IR searches for isolated brown dwarfs. What strategies do you recommend for brown dwarfs companions, in order to discriminate them spatially or spectroscopically from the primary star?
Adam Burrows: The best long–term means of discriminating a brown dwarf or a planet from its primary are adaptive optics and interferometry in the near– to mid–IR, where the contrast is greatest and the Fried parameter is advantageous. Another potentially rewarding technique is to look for the contrast across a feature, such as one of methane’s, unique to substellar objects. This approach has already been demonstrated for Gl229 B by Rosenthal et al. .
References
Allard, F., & Hauschildt, P.H. 1995, ApJ, 445, 433
Allard, F., Hauschildt, P.H., Baraffe, I., & Chabrier, G. 1996, ApJ, 465, L123
Allard, F., Hauschildt, P. H., Alexander, D. R. & Starrfield, S. 1997, ARA&A, 35, 137
Angel, J.R.P. 1994, Nature, 368, 203
Baraffe, I., Chabrier, G., Allard, F., & Hauschildt, P. 1995, ApJ, 446, L35
Benvenuti, P. et al. 1994, in ESA’s Report to the 30th COSPAR Meeting, ESA SP-1169, Paris, p. 75 (ISO)
Bessell, M.S. 1990, PASP, 102, 1181
Bessell, M.S., & Brett, J.M. 1988, PASP, 100, 1134
Bodenheimer, P. & Pollack, J. B. 1986, Icarus, 67, 391
Borysow, A. & Frommhold, L. 1990, ApJ, 348, L41
Boss, A. P. 1995, Science, 267, 360
Brown, L.R. & Peterson, D.B. 1994, J. Mol. Spect., 168, 593
Brown, L.R. & Plymate, C. 1996, J. Quant. Spect. Rad. Transfer, 56, 263
Bulanin, M.O., Dokuchaev, A.B., Tonkov, M.V., & Filippov, N.N. 1984, J. Quant. Spect. Rad. Transfer, 6, 521
Burrows, A., Hubbard, W.B., & Lunine, J.I. 1989, ApJ, 345, 939
Burrows, A., Hubbard, W.B., Saumon, D., & Lunine, J.I. 1993, ApJ, 406, 158
Burrows, A., Saumon, D., Guillot, T., Hubbard, W.B., & Lunine, J.I. 1995, Nature, 375, 299
Burrows, A., Marley, M., Hubbard, W.B., Lunine, J.I., Guillot, T., Saumon, D., Freedman, R., Sudarsky, D., & Sharp, C. 1997, accepted to Ap. J.
Butler, R. P. & Marcy, G. W. 1996, ApJ, 464, L153
Butler, R. P., Marcy, G. W., Williams, E., Hauser, H., & Shirts, P. 1997, ApJ, 474, L115
Chabrier, G. & Baraffe, I. 1997, submitted to A&A
Cochran, W.D., Hatzes, A.P., Butler, R.P., & Marcy, G. 1997, Science, in press
Conrath, B.J., Hanel, R.A. & Samuelson, R.E. 1989, in Origin and Evolution of Planetary and Satellite Atmospheres, eds. S.K. Atreya, J.B. Pollack, & M.S. Matthews, University of Arizona Press: Tucson, p. 513.
D’Antona, F. & Mazzitelli, I. 1985, ApJ, 296, 502
Delfosse, X. 1997, DENIS preprint
Dreiling, L.A. & Bell, R.A. 1980, ApJ, 241, 736
Eisenberg, D. & Kauzmann, W. 1969, The Structure and Properties of Water (New York: Oxford University Press)
Erickson, E. F. 1992, Space Science Reviews, 61, 61 (SOFIA)
Erickson, E. F. & Werner, M. W. 1992, Space Science Reviews, 61, 95 (SIRTF)
ExNPS: A Road Map for the Exploration of Neighboring Planetary Systems, JPL Publication 96–22, August 1996
Fegley, B. & Lodders, K. 1994, Icarus, 110, 117
Fegley, B. & Lodders, K. 1996, ApJ, 472, L37
Gamache, R.R., Lynch, R., & Brown, L.R. 1996, J. Quant. Spect. Rad. Transfer, 56, 471
Geballe, T. R., Kulkarni, S. R., Woodward, C. E., & Sloan, G. C. 1996, ApJ, 467, L101
Goody, R., West, R., Chen, L., & Crisp, D. 1989, J. Quant. Spectr. Rad. Transfer, 42, 539
Goorvitch, D. 1994, ApJS, 95, 535
Graboske, H. C., Pollack, J. B., Grossman, A. S., & Olness, R. J. 1975, ApJ, 199, 265
Grossman, A.S. & Grant, K. 1992, LLNL Rept. UCRL-ID-111805
Grossman, A.S. & Grant, K. 1994, LLNL Rept. UCRL-ID-116533
Guillot, T., Burrows, A., Hubbard, W.B., Lunine, J.I., & Saumon, D. 1996, ApJ, 459, L35
Guillot, T., Chabrier, G., Gautier, D., & Morel, P., 1995, ApJ, 450, 463
Handbook of Chemistry and Physics, 74th Edition, 1993, ed. D.R. Lide, CRC Press Inc.
Hubbard, W. B., 1977, Icarus, 30, 305
Husson, N., Bonnet, B., Scott, N.A., & Chedin, A. 1994, J. Quant. Spect. Rad. Transfer, 48, 509
Ingersoll, A.P. & Pollard, D. 1982, Icarus 52, 62
ISO Observer’s Manual Version 2.0, 31 March 1994, prepared by the ISO Science Operations Team, p6
Jones, H. & Tsuji, T. 1997, submitted to A&A
Kirkpatrick, J.D., Beichman, C.A., & Skrutskie, M.F. 1997, ApJ, 476, 311
Kirkpatrick, J.D., Henry, T.J., & Simons, D.A. 1994, AJ, 108, 1437
Kirkpatrick, J.D., Henry, T.J., & Simons, D.A. 1995, AJ, 109, 797
Kurucz, R.L., 1970, Smithsonian Obs. Spec. Rep., 309, 1-291
Lacis, A.A. & Oinas, V. 1991, J. Geophys. Res., 96, 9027
Lange’s Handbook of Chemistry, 1979, ed. J.A. Dean, McGraw-Hill Book Company, New-York
Latham, D. W., Mazeh, T., Stefanik, R.P., Mayor, M., & Burki G. 1989, Nature, 339, 38
Leggett, S.K. 1992, ApJS, 82, 351
LeMoal, M.F. & Severin, F. 1986, J. Quant. Spect. Rad. Transfer, 35, 145
Levy, A., Lacome, N., & Tarrago, G. 1994, J. Mol. Spect., 166, 20
Lindal, G. 1992, AJ, 103, 967
Lunine, J.I., Hubbard, W.B., Burrows, A., Wang, Y.P., & Garlow, K. 1989, ApJ, 338, 314
Marcy, G. W. & Butler, R. P. 1996, ApJ, 464, L147
Margolis, J. 1993, J. Quant. Spect. Rad. Transfer, 50, 431
Margolis, J. 1996, J. Quant. Spect. Rad. Transfer, 55, 823
Marley, M., Saumon, D., Guillot, T., Freedman, R.S., Hubbard, W.B., Burrows, A., & Lunine, J.I. 1996, Science, 272, 1919
Marley, M. 1997, to be published in the proceedings of the Tenerife Workshop on Extrasolar Planets and Brown Dwarfs, March 17–21
Martin, E., Rebolo, R., & Zapatero-Osorio, M.R. 1996, ApJ, 469, 706
Matthews, K., Nakajima, T., Kulkarni, S.R., & Oppenheimer, B.R. 1996, AJ, 112, 1678
Mayor, M. & Queloz, D. 1995, Nature, 378, 355
McKay, D. S., et al. 1996, Science, 273, 924
McKay, C.P, Pollack, J.B., & Courtin, R. 1989, Icarus, 80, 23
Mountain, M., R. Kurz, R., & Oschmann, J. 1994, in The Gemini 8-m Telescope Projects, S.P.I.E. Proceedings on Advanced Technology Optical Telescopes V, 2199, p. 41 (Gemini)
Nakajima, T., Oppenheimer, B.R., Kulkarni, S.R., Golimowski, D.A., Matthews, K., & Durrance, S.T. 1995, Nature, 378, 463
Noyes, R.W. et al. 1997, submitted to ApJ
Oppenheimer, B.R., Kulkarni, S.R., Matthews, K., & Nakajima, T. 1995, Science, 270, 1478
Partridge, H. & Schwenke, D.W. 1997, J. Chem. Phys., 106, 4618
Podolak, M., Hubbard, W.B. & Pollack, J.B. 1993, in Protostars and Planets III, eds. E.H. Levy and J.I. Lunine (Tucson, Univ. of Arizona Press), 1109.
Pollack, J.B. 1984, ARA&A, 22, 389
Rages, K., Pollack, J.B., Tomasko, M.G., & Doose, L.R. 1991, Icarus, 89, 359
Rothman, L.S., Gamache, R.R., Tipping, R.H., Rinsland, C.P., Smith, M.A.H., Benner, D.C., Malathy Devi, V., Flaud, J.-M., Camy-Peyret, C., Perrin, A., Goldman, A., Massie, S.T., Brown, L.R., & Toth, R.A. 1992, J. Quant. Spect. Rad. Transfer, 48, 469.
Rothman, L.S., Wattson, R.B., Gamache, R.R., Goorvitch, D., Hawkins, R.L., Selby, J.E.A., Cambry-Peyret, C., Flaud, J.-M., Schroeder, J., & McCann, A. 1997, J. Quant. Spect. Rad. Transfer, submitted
Saumon, D., Hubbard, W.B., Burrows, A., Guillot, T., Lunine, J.I., & Chabrier, G. 1996, ApJ, 460, 993
Saumon, D., Chabrier, G., & Van Horn, H. 1995, ApJS, 99, 713
Saxner, M. & Gustafsson, B. 1984, A&A, 140, 334
Stevenson, D. J. 1991, ARA&A, 29, 163
Thompson, R. 1992, Space Science Reviews, 61, 69 (NICMOS)
Tipping, R. 1990, Report on Calculation of Spectroscopic Parameters for Diatomic Molecules of Atmospheric Interest, Univ. of Alabama Report, Dept. of Physics and Astronomy
TOPS: Toward Other Planetary Systems, NASA Solar System Exploration Division, Washington, D.C., 1992
Tsuji, T., Ohnaka, W., Aoki, W., & Nakajima, T. 1996, A&A, 308, L29
Tyuterev, Vl.G., Babikov, Yu.L., Tashkun, S.A., Perevalov, V.I., Nikitin, A., Champion, J.-P., Wegner, Ch., Pierre, C., Pierre, G., Hilico, J.-C., & Loete, M. 1994, J. Quant. Spect. Rad. Transfer, 52, 459
Sharp, C.M. & Wasserburg, G.J. 1995, Geochim. Cosmochim. Acta., 59, 1633
Tinney, C. 1996, MNRAS, 281, 644
Wattson, R.B., and Rothman L.S. 1992, J. Quant. Spectr. Rad. Transfer, 48, 763
Zapatero-Osorio, M.R., Rebolo, R., & Martin, E.L. 1997, A&A, 317, 164
Zapatero-Osorio, M.R., Martin, E.L., Rebolo, R. 1997, submitted to å
Zheng, C. & Borysow, A. 1995, Icarus, 113, 84