11.03.4 Coma cluster; 04.03.1; 11.03.1; 11.04.1 11institutetext: IGRAP, Laboratoire d’Astronomie Spatiale, Traverse du Siphon, F-13012 Marseille, France 22institutetext: Istituto TeSRE, CNR, via Gobetti 101, I-40129 Bologna, Italy \offprintsC. Adami
Segregations in clusters of galaxies ††thanks: http://www.astrsp-mrs.fr/www/enacs.html
Abstract
We analyse a sample of about 2000 galaxies in 40 regular clusters, to look for evidence of segregation with respect to galaxy luminosities and morphological types.
We find evidence of luminosity segregation for galaxies brighter than , i.e. typically the four brightest members of each cluster. We also find evidence of morphological segregation: both the core-radius and the velocity dispersion increase along the Hubble sequence (ellipticals - S0 - early spirals - late spirals).
Galaxies of different types have different velocity dispersion profiles, being steeper for later type galaxies. Simple modelling allows us to show that elliptical (and, to a lesser extent, S0) orbits are mostly tangential in the cluster core, and nearly isotropic outside, while spiral (in particular late-spiral) orbits are predominantly radial.
A viable interpretation of our results is that (1) late spirals, at variance with other type galaxies, are a non-virialized cluster population, still on partially radial infalling orbits, (2) the elliptical phase-space distribution is evolving towards energy equipartition through the process of dynamical friction, (3) S0 and early-spirals have intermediate distributions between these two extremes.
keywords:
Galaxies: clusters: general-cluster: individual: Coma cluster1 Introduction
The analysis of the phase-space distributions of cluster galaxies helps to constrain models of galaxy formation and evolution. In particular, it is important to distinguish among galaxies of different luminosities and morphological types, as they may not have formed and evolved in the same way. Moreover, it is important to know the phase-space distributions of different cluster galaxies for a proper determination of the cluster mass (Girardi et al. 1996).
The observational evidence that early-type galaxies occupy denser environments than late-types dates back to Curtis (1918) and Hubble & Humason (1931), and was quantified by Oemler (1974). Melnick & Sargent (1977) showed that the relative fraction of S0 and spiral galaxies depends on the distance from the cluster centre. Most subsequent studies were based on the data sample of Dressler (1980a) containing over 6000 galaxies in 55 cluster fields. While Dressler (1980b) concluded that the basic correlation is between morphology and local density in clusters, Sanroma & Salvador-Sole (1990) and Whitmore & Gilmore (1991), based on the same sample, have independently reached the conclusion that the fundamental correlation is between morphology and global cluster properties, such as the the clustercentric distance. For more complete reference, we refer the reader to Whitmore et al. (1993).
More recently, ellipticals and S0 were found to have smaller velocity dispersions ( in the following) than spirals and irregulars (Tammann 1972; Melnick & Sargent 1977; Moss & Dickens 1977; Sodré et al. 1989; Biviano et al. 1992, hereafter B92; Stein 1997, hereafter S97). As morphologies are usually more difficult to reliably determine than colours, and colours and morphologies are correlated, many authors have analysed the correlation between kinematics and colours. Andreon (1996), Biviano et al. (1996), Colless & Dunn (1996), all found that the ratio between the of the blue and the red galaxy populations in the Coma cluster is –1.4. Similar evidence has recently been found by Carlberg et al. (1997) in their analysis of the CNOC survey medium-z clusters. Based on a sample of galaxies in 15 clusters, S97 has recently confirmed the larger for spirals as compared to early-type galaxies, and has shown that within the class of early-type galaxies, S0 have a larger than ellipticals.
Further, possibly related, observational evidence is the existence of luminosity segregation: the most luminous galaxies are closer to the cluster centres (e.g. Rood & Turnrose 1968, Capelato et al. 1981, Yepes et al. 1991), and have a significantly lower velocity dispersion (Rood et al. 1972, Chincarini & Rood 1977, Struble 1979, Kent & Gunn 1982, B92, S97). The anti-correlation between luminosity and velocity dispersion seems however to hold for the very bright galaxies only (luminosity ), and to depend on the galaxy morphological type, being strongest for ellipticals (B92, S97). S97 in particular has pointed out that there is no evidence whatsoever for a –luminosity (anti-)correlation in galaxies other than ellipticals.
Only very recently, large data-sets have allowed the analysis of the velocity dispersion profiles (vdp in the following) of galaxies of different properties. Mohr et al. (1996) have shown that the emission-line galaxies in the A 576 cluster have a steeper vdp than non-emission-line galaxies; Biviano et al. (1997, hereafter B97) have come to the same conclusion on the basis of the ENACS data-set of 75 clusters (see Katgert et al. 1996, hereafter K96). A similar difference is found between the vdp of red and blue galaxies in 15 clusters from the CNOC survey (Carlberg et al. 1997).
From the theoretical side, the evidence for segregation is interpreted either as arising in a different formation process for galaxies of different luminosities and/or morphologies, or as being due to a different evolutionary history (the ”nature vs. nurture” problem). Many physical processes can affect the morphology, luminosity, and velocity of a galaxy. Dynamical friction can slow down the more massive galaxies, circularize their orbits (den Hartog & Katgert 1996 and references therein), and enhance their merger rate (Mamon 1992, 1996 and references therein); ram pressure and collisions can transform a star forming galaxy into a quiescent one; tidal effects can truncate the galaxy sizes and reduce their luminosities while producing a reservoir of debris for centrally located cD galaxies (Oemler 1992, Whitmore 1994, and references therein). The steep vdp and large of star-forming galaxies, as compared to quiescent ones, suggests that star-forming galaxies are falling into the cluster, maybe for the first time (B97).
In this paper we revisit these issues, via the analysis of a large data-set of about 2000 cluster galaxies, partly based on the ENACS catalogue (K96, Katgert et al. 1997), and partly drawn from the literature. Taking a step further from previous studies on segregation, we distinguish spirals into two classes (early- and late-type), and determine the vdp of ellipticals, S0, early-spirals and late-spirals.
The structure of the paper is as follows: in § 2 we describe the data-sample, in § 3 we address the issues of segregation in velocities and spatial segregation, and determine the vdp for different morphological classes; in § 4 we discuss our findings, and in § 5 we give our conclusions.
2 The data
2.1 The compilation of the catalogue
The data sample on cluster galaxies which we use in this paper is a merging of the ENACS data-base (K96 and Katgert et al. 1997) and available data from the literature, which includes the December 1994 version of ZCAT (Huchra et al. 1995). Coordinates and redshifts are available for all galaxies in our data sample, and magnitudes and morphological types are available for most of them.
In compiling this data-base, we had to make a compromise between collecting as much data as possible, and keeping the data-base homogeneous. For this reason, before putting together data from different sources, we first compared the different redshift estimates for galaxies common to different data-sets. Only when the average velocity difference of all common galaxies was not statistically significant (at the 90 % confidence level) and less than 200 km s-1, were the different source redshift scales considered compatible and the data-sets merged together. For a comparison of ENACS and literature data we refer the reader to K96.
In merging different data-sets, one has to take special care not to insert the same galaxy twice. This may happen if the galaxy coordinates in either of the two data-sets are not accurate enough. For the ENACS clusters, we made use of the (unpublished) catalogue of galaxies obtained by scanning film copies of the SERC blue survey and glass copies of the first Palomar Sky Survey, with the Astroscan measuring machine (K96 and references therein). This catalogue was used in preparing the Optopus observations; for all detected galaxies a photometric parameter was derived, which was later converted into an isophotal magnitude () using CCD-observations for calibration (more details are given in K96). This photometric catalogue is meant to be complete, but only for selected cluster regions specifically chosen for the Optopus observations. When a galaxy with a redshift measurement from the literature was located in the Optopus plate cluster regions, it was possible to find a corresponding entry in the Astroscan catalogue. If the galaxy already had an ENACS redshift measurement, this was adopted; otherwise, the literature redshift was used, but the coordinates and magnitudes were taken from the Astroscan catalogue, for a better consistency with other ENACS galaxies.
For the non-ENACS clusters, or for regions of the ENACS cluster not covered by the Optopus plates, we took a conservative approach and rejected all suspected double entries for the same galaxy. The decision was based upon similarity of coordinates (up to 30” difference), and galaxy properties like redshift, and/or magnitude, and/or morphology. We may have eliminated galaxy pairs, but this is not a concern for the present analysis, as long as the probability for galaxies to be in pairs does not depend strongly on their morphological type and/or luminosities.
The average galaxy velocity uncertainty in our final data-set, using the errors quoted in the original references, is 69 km s-1, and the maximum quoted uncertainty is 276 km s-1. External errors are likely to be larger, due to the non-perfect match of the redshift scales of merged data-sets.
Magnitudes were corrected for galactic absorption, using the extinction-maps of Burstein & Heiles (1982), and the relations between and absorption in several magnitude bands as given by Colless (1989), Oemler (1974), and Postman & Lauer (1995). We applied k-corrections using the relations given by Colless (1989), Postman & Lauer (1995), Sandage (1973), and Schneider et al. (1983). All magnitudes were then converted to ENACS magnitudes. When possible, the linear regression between the ENACS and the literature magnitudes for common galaxies was used as a conversion formula. Otherwise, we used relations given in the literature to convert from total to isophotal magnitudes, when needed, and from different bands to the red bandpass (ref.s mentioned above and: Dickens et al. 1986, Lugger 1989, Oegerle & Hoessel 1989, and Sharples et al. 1988).
The uncertainty of ENACS magnitudes is mag (and even lower for galaxies in clusters with CCD-calibration, see K96). The uncertainty of the magnitudes taken from the literature is probably larger ( mag), because of the additional error introduced in transforming them to the ENACS bandpass.
All the morphological type estimates were taken from the literature, as there is no morphological information available in the ENACS data-set.
2.2 The definition of clusters
Several methods have been proposed in the literature for defining cluster membership. As a large part of our data comes from ENACS, it would be natural to follow K96’s methodology of fixed gaps: redshift boundaries for a cluster are defined such that the closest non-cluster member in redshift space is separated by at least 1000 km s-1 from either of the two boundaries. However, a fixed gap of 1000 km s-1 is a valid choice only for the relatively homogeneous ENACS sample, but cannot work for all data-sets, simply because the average density of observed galaxies per redshift interval may change (as a consequence of one survey being deeper than another). As an example, the fixed gap fails to effectively identify the Coma cluster in redshift space.
For this reason, we adopted a gap that depends on the galaxy density per redshift interval along the line-of-sight to a given cluster, and we call it the density-gap, equal to km s-1, where is the total number of galaxies with measured redshift in the cluster region. This expression was derived from simulations of the occurrence of gaps of a given size in gaussian distributions with varying numbers of objects. When applied on the ENACS data-base it identifies similar systems as those identified using the fixed gap criterion (see also Adami et al. 1997a).
Using the density-gap method we identified the main systems along the lines of sight. For the cluster A 548 alone we also applied a splitting in coordinate space, since it is clearly bimodal in projection (Escalera et al. 1994).
In order to further reject possible remaining interlopers, we then applied the method of den Hartog & Katgert (1996) to the systems with at least 50 galaxies (the method is unreliable for poorer data-sets).
| Name | Bright galaxies | Nb of redshifts | Mean redshift | Extension | Center | References | |
|---|---|---|---|---|---|---|---|
| (h-1 kpc) | (km/s) | ||||||
| A0119 | 1 | 73 | 0.042 | 994 | 943 | I | F2+ENACS |
| A0151 | 1 | 31 | 0.052 | 897 | 804 | I | D4+P3+ENACS |
| A0168 | 1 | 59 | 0.044 | 977 | 528 | I | F1+Z2+ENACS |
| A0194 | 0 | 52 | 0.017 | 965 | 523 | X | C2+B3 |
| A0262 | 0 | 40 | 0.016 | 996 | 506 | X | G3+G4+M2+Z3 |
| A0400 | 0 | 69 | 0.023 | 909 | 629 | X | B1+B5+D4 |
| A0426 | 0 | 75 | 0.017 | 798 | 1329 | X | B3+K+P2+Z3 |
| A0496 | 1 | 56 | 0.033 | 898 | 746 | X | D4+M1+Q1 |
| A0539 | 0 | 71 | 0.029 | 996 | 1095 | X | O+N+Z3 |
| A0548 | 0 | 88 | 0.041 | 992 | 736 | X | D3+ENACS |
| A0548 | 0 | 95 | 0.042 | 990 | 885 | X | D3+ENACS |
| A0576 | 0 | 26 | 0.038 | 670 | 927 | X | H1+H3+F4 |
| A0754 | 1 | 51 | 0.056 | 878 | 914 | X | D3+ENACS |
| A0978 | 1 | 18 | 0.056 | 992 | 674 | I | D4+ENACS |
| A0999 | 1 | 23 | 0.033 | 700 | 393 | cD | A+C1 |
| A1016 | 1 | 22 | 0.033 | 575 | 257 | cD | A+C1 |
| A1060 | 2 | 112 | 0.013 | 951 | 665 | X | R1+R2 |
| A1142 | 0 | 32 | 0.037 | 958 | 441 | X | B3+D4+G2 |
| A1367 | 0 | 50 | 0.023 | 863 | 878 | X | D2+G1+G5+T3+Z3 |
| A1631 | 1 | 43 | 0.048 | 996 | 706 | X | D3 |
| A1644 | 1 | 58 | 0.049 | 964 | 966 | X | D3 |
| A1656 | 1 | 196 | 0.024 | 974 | 1135 | X | B6 |
| A1983 | 2 | 42 | 0.045 | 903 | 593 | X | D3 |
| A2040 | 0 | 25 | 0.046 | 796 | 730 | X | Z2+ENACS |
| A2063 | 1 | 38 | 0.035 | 928 | 744 | X | B2+D4+H2 |
| A2147 | 0 | 22 | 0.037 | 971 | 1194 | X | T1+Z3 |
| A2151 | 0 | 74 | 0.037 | 983 | 861 | X | D3 |
| A2256 | 1 | 56 | 0.059 | 890 | 1403 | X | F3 |
| A2634 | 0 | 22 | 0.030 | 832 | 938 | X | B4+B5+D4+H4+ P1+S1+Z1 |
| A2670 | 2 | 95 | 0.075 | 978 | 1120 | X | S2 |
| A2877 | 1 | 37 | 0.023 | 865 | 790 | X | M1 |
| A3128 | 1 | 80 | 0.059 | 997 | 1041 | I | C4+C5+ENACS |
| A3158 | 5 | 33 | 0.059 | 778 | 1064 | I | C3+L2+ENACS |
| A3376 | 1 | 53 | 0.047 | 995 | 790 | X | D3 |
| A3381 | 1 | 26 | 0.038 | 777 | 306 | X | D3 |
| A3389 | 2 | 37 | 0.027 | 585 | 620 | X | D3+T2 |
| A3526 | 0 | 107 | 0.013 | 994 | 962 | X | D1+L1 |
| A3574 | 0 | 33 | 0.016 | 881 | 513 | X | W |
| A3716 | 0 | 57 | 0.044 | 966 | 845 | X | C4+D3 |
| A4038 | 1 | 42 | 0.028 | 771 | 872 | X | E+L3 |
It is important to use only the central regions of clusters in our analysis, in order to minimize spatial selection effects. In denser regions, multi-object spectroscopy – from which most of our data comes – tends to select brighter galaxies than in less dense region. On the other hand, deeper surveys are done with smaller fields of view, which means that the central cluster regions are generally sampled to fainter magnitudes than the wider external regions. While a detailed analysis has shown that these selection effects are of no concern for the ENACS data-set (Adami et al. 1997b), we do need to worry about this issue when using literature data. To reduce this problem, we chose to consider only galaxies within 1 h-1 Mpc radius111Throughout the paper hH, and the deceleration parameter from the cluster centres. Via this selection we also implicitly exclude regions that have not yet reached virialization (e.g. White 1992), yet which inlude most of the cluster galaxies, as their projected density at 1 h-1 Mpc is low, being % of the central density for 80 % of the clusters (Girardi et al. 1995). Centres were defined by choosing the peak of the X-ray emission, when available, or the location of the cD, when present, or else the isodensity contour peak (as in Adami et al. 1997b).
As was shown by Beers et al. (1990), data-points are sufficient to provide robust estimates of the central location and scale of a data-set, when the biweight estimators are used (see also Lax 1985). On the other hand, Girardi et al. (1993) have shown that changing the cluster membership criterion changes the cluster estimate if only 10 galaxies per cluster are available. As a consequence, we considered in our analysis only those clusters with at least galaxy members within a circle of 1 h-1 Mpc radius (the minimum number of cluster galaxies in our sample is 18, in the cluster A 978).
The final sample contains 1997 galaxy members from 40 nearby clusters (counting the subclusters in A 548 as two independent systems). The mean cluster redshifts range from 0.013 to 0.075; the absolute R25 magnitudes of cluster galaxies range from -23 to -16; the morphological fractions of the 1997 galaxies are: 24 % ellipticals (E, hereafter), 49 % S0, 21 % early spirals (Sa to Sb in the Hubble sequence, globally labelled Se, hereafter), and only 6 % late spirals or irregulars (Sl, hereafter). These fractions are similar to the average fractions for all kinds of clusters (spiral poor, spiral rich and cD) as given by Oemler (1974).

In Table 1 we list for each system the cluster Abell number, the number of very bright galaxies (i.e. those with a cD morphology and those separated by a gap of at least 0.5 mag from the fainter galaxies), the total number of redshifts, the mean redshift of the cluster, the clustercentric distance that defines the region analysed in this paper, the velocity dispersion and its bootstrap error based on 1000 resamplings, the type of the selected centre (”I” means the centre was chosen at the isodensity peak, ”cD” that it coincides with the position of the cD galaxy, ”X” that it coincides with the position of the X-ray peak), and the relevant references to the collected data.
While this paper was being written, the data-set of Stein (1996) on cluster galaxies became available. As this data-set is not included in our compilation, it makes sense to compare Stein’s determinations of the cluster parameters with ours. There are five clusters in common with Stein (1996) in our data-set: A 400, A1016, A1060 (Hydra), A3526 (Centaurus) and A4038. As Stein’s sample is limited to the inner 0.5 h-1 Mpc, we restricted our samples to this inner region as well, for the sake of comparison. We find an average difference of 37 km/s in the estimates, and of -122 km/s in the average velocity estimates, both within their 1-sigma uncertainties.
3 Analysis and results
Our results are based on the analysis of a synthetic cluster that we have created by joining all 40 cluster samples (as in B92; see also B97 and S97). In the synthetic cluster, galaxy distances are in unit of h-1 Mpc from the centre of the cluster they belong to. Galaxy absolute magnitudes, , are obtained from apparent magnitudes by using the mean cluster distances, and galaxy velocities are referred to the cluster average velocities and scaled by the cluster velocity dispersions,
| (1) |
where and are, respectively, the galaxy and the cluster indices.
In order to check the results obtained on the synthetic cluster, the same analysis was also performed on a single cluster, Coma (A 1656), for which a large enough data-sample was available. The morphological fractions of Coma galaxies are similar to those of the synthetic cluster.
In all following analyses, error-bars are obtained from a bootstrap technique with 1000 resamplings.
3.1 Segregation in velocity
In order to test for the presence of luminosity segregation in velocity space, we have computed the (normalised) velocity dispersion, , of the synthetic cluster for galaxies of different (absolute) magnitude, without making any distinction according to the morphological type. In Fig. 1a we plot vs. mag using 0.5-mag bins; it can be seen that the velocity dispersion is roughly independent of magnitude for but monotonically decreases at brighter magnitudes, from at , to at . The difference between the velocity dispersions for galaxies brighter and, respectively, fainter than is significant at the 0.999 confidence level, according to an F-test.
Galaxies brigther than this magnitude limit are moving more slowly than other cluster galaxies. While it is well known that most cD and D galaxies sit at the bottom of their cluster potential wells, there are at most 31 such galaxies in our sample (see Table 1), as compared to 166 galaxies brighter than ; this effect thus concerns the 4 brightest galaxies of each cluster on average. This segregation in the velocity space may be interpreted as evidence that the brightest cluster galaxies have reached energy equipartition as a consequence of dynamical friction (e.g. Capelato et al. 1981). For a constant galaxy mass-to-light ratio, energy equipartition implies . For this relation is consistent with our data: the regression line between and , has a slope of . The same relation (normalized at ) is also shown superposed on the data points in Fig. 1a.
In order to analyse the dependence of luminosity on the galaxy morphological class, we have repeated the previous analysis on the three subsamples of E, S0 and SeSl (early- and late-spirals and irregulars are considered together to avoid poor statistics). The -magnitude relation for E is similar to that for all galaxies together (see Fig. 2a), and the of E brighter than is significantly lower than the of fainter E (0.99 confidence level, according to an F-test). On the other hand, this magnitude dependence is not found for the galaxies of other morphological classes.
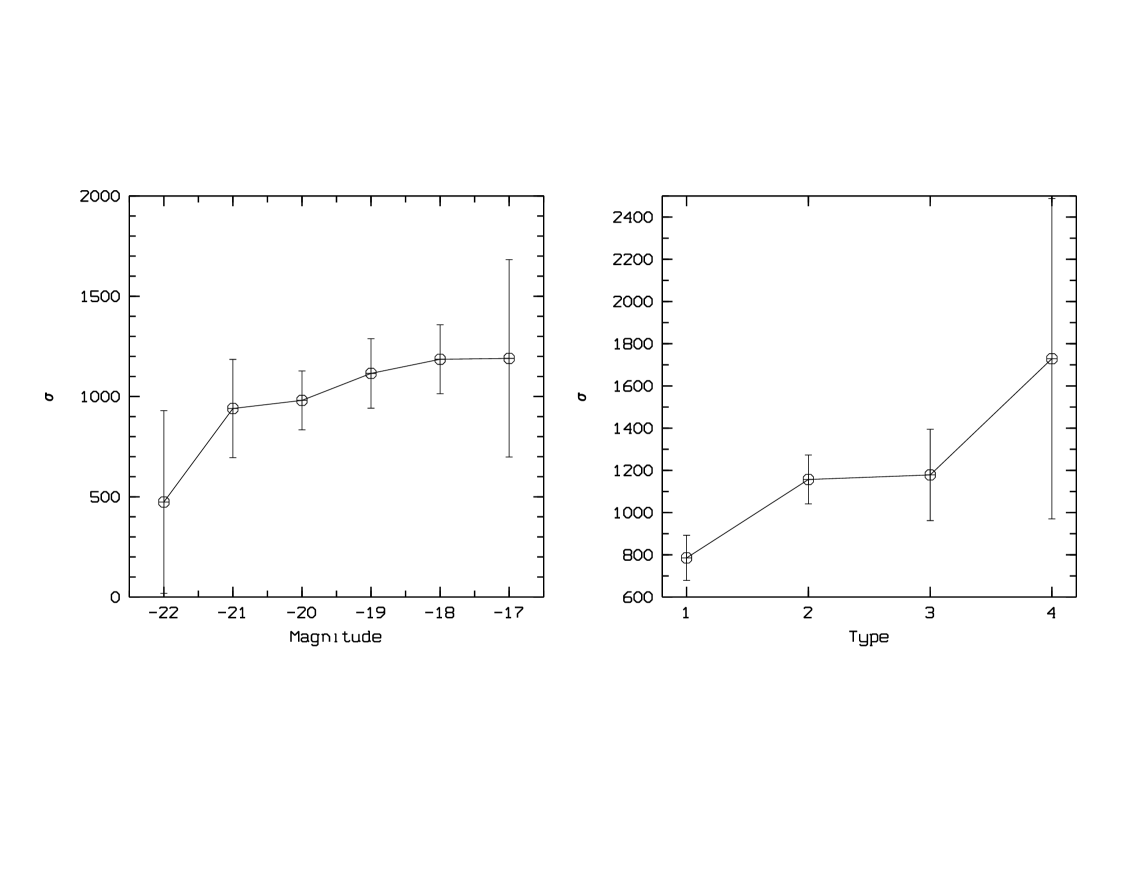
We then computed separately for E, S0, Se and Sl of all luminosities (see Fig. 1b). In general, later morphological type galaxies have a larger velocity dispersion than early type galaxies, although there is no significant difference between the S0 and the Se . The E is 15 % lower than the S0Se , and the latter is 20 % lower than the Sl . An F-test qualifies these differences as significant at more than 0.999 confidence level.
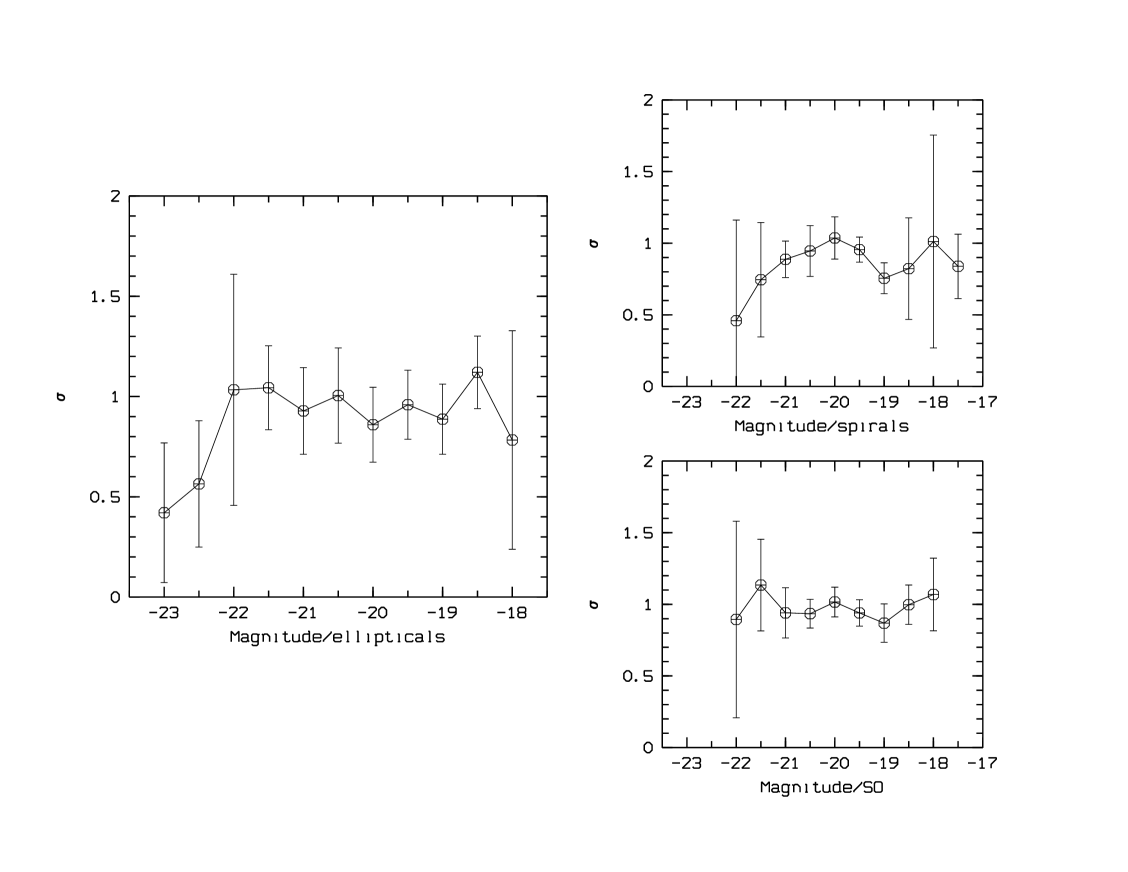
We have then considered the Coma (A 1656) cluster independently. In order to achieve a higher signal-to-noise, we used in this case bins of 1 mag, instead of 0.5 mag. We do not need to consider normalized velocities in this case, as all galaxies belong to the same cluster.
Similarly to what was found for the synthetic cluster sample, in the Coma cluster there is evidence for both luminosity and morphology-based segregation in velocity (see Fig. 3). In this case however, the velocity dispersion seems to monotonically increase with magnitude up to the fainter magnitude bin, where km s-1. The difference between the of galaxies in the brightest magnitude bin and that of galaxies in the adjacent magnitude bin, is consistent with the energy equipartition model, but the global trend is not.
As far as the morphological segregation is concerned, in general later types seem to have larger , but the only significant difference is between the of E and the of other galaxies.
3.2 Spatial segregation

In the analysis of the spatial segregation, we have to take into account the fact that our sample is not magnitude complete. Magnitude incompleteness is not a problem for the analysis of segregation in velocity, since velocities and magnitudes of cluster galaxies are mostly uncorrelated. On the other hand, observational biases may induce a spurious variation of the average galaxy magnitude with clustercentric distance that may be taken for evidence of spatial luminosity segregation. In particular: (i) the limiting magnitude of galaxies selected for observations with multi-fiber spectroscopy is generally brighter in fields of higher galaxy density (i.e. in the cluster centres); (ii) deep observations generally only cover small fields of view, i.e. the cluster centres and not the wider external regions. Note however that the two biases result in opposite selection effects.
We think that these biases do not seriously affect our analysis for the following reasons: (i) the ENACS sample (which constitutes a large part of our sample) is free of these observational biases (Katgert et al. 1997); (ii) our analysis is limited to the inner cluster regions, where the sampling may be less inhomogeneous; (iii) the combination of several samples is likely to further reduce the problem, unless all samples are biased the same way.
In Fig. 4 we plot the average magnitude vs. clustercentric distance. Note that the total number of galaxies per bin ranges from 92 to 316, large enough to provide an adequate sampling of the luminosity function at the bright end. Galaxies in the central bin are clearly brighter than those in the adjacent bin. In other bins the magnitude decreases towards the outer parts of the (synthetic) cluster. It is difficult to see how observational biases can produce an artificial decrease of the magnitude with increasing clustercentric distance, while leaving, at the same time, an opposite trend just in the very centre of a cluster. It is possible that a real effect, spatial segregation of the very bright galaxies, is seen superposed on a more general trend that is created by an observational bias. The evidence for spatial segregation must however be considered as tentative only.
| Type | ||
|---|---|---|
| E | 27611 | 56142 |
| S0 | 3738 | 132111 |
| Se | 45113 | 159243 |
| Sl | 54923 | 197174 |
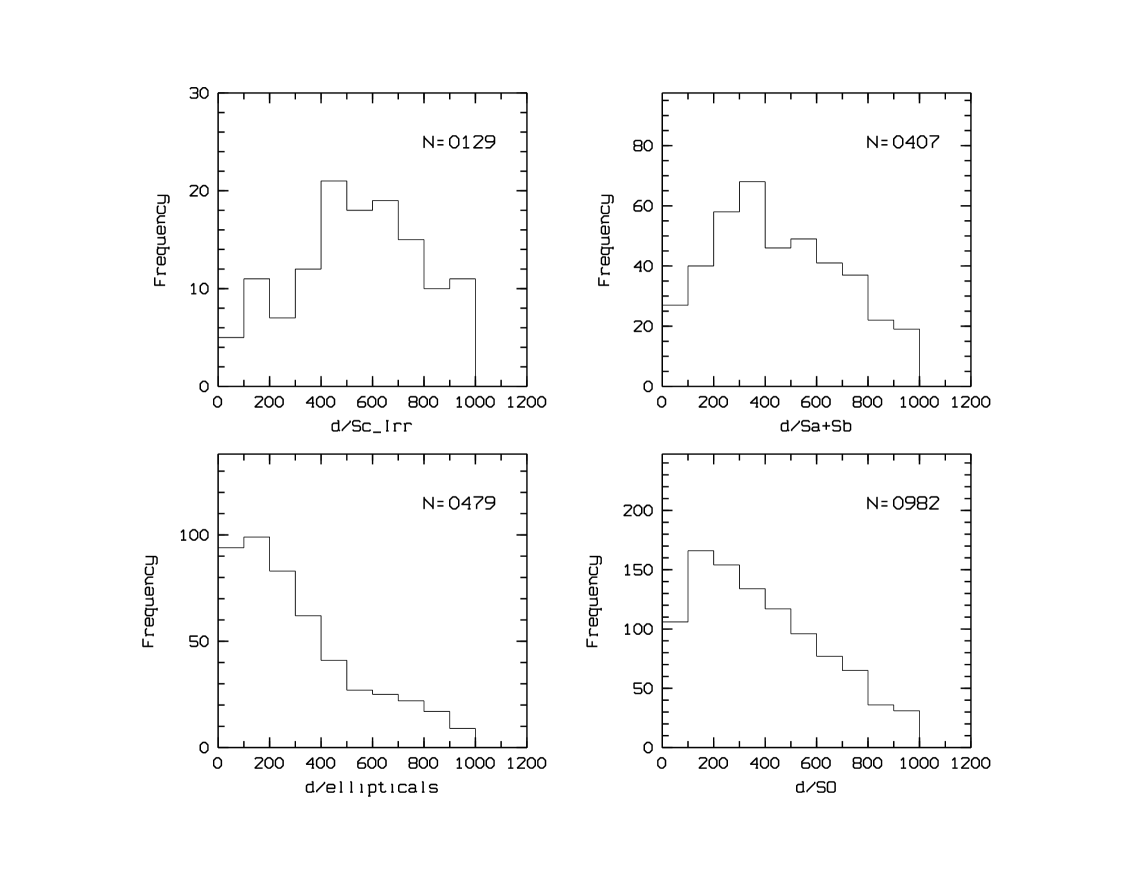
For what concerns the morphological segregation, we have considered the distributions of clustercentric distances of E, S0, Se and Sl, separately (see Fig. 5). A Kruskall-Wallis test (see, e.g., Ledermann 1982) indicate that the four distributions are significantly different (0.999 confidence level). In Table 2 we list the average clustercentric distances of galaxies in the four morphological classes, and the core-radii of the King (1962) functions that best fit the four distributions. Both the average clustercentric distance and the core-radius increase along the Hubble sequence (E-S0-Se-Sl).
Note that the evidence for morphological segregation cannot be accounted for by the trend of galaxy magnitudes with clustercentric distances, since the average magnitudes of E, S0, Se and Sl are similar (, respectively).
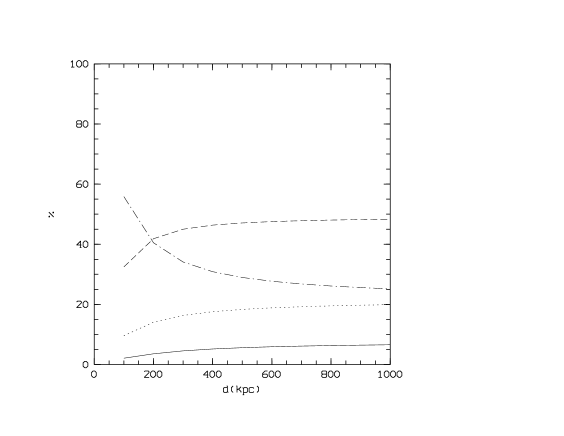
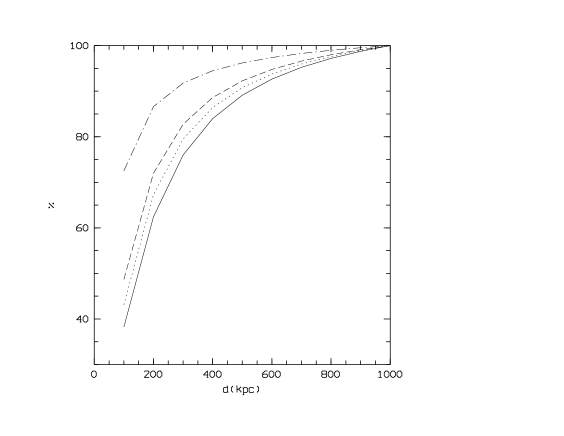
Via the Abel inversion, we have deprojected the King functions to determine the relative fractions of the four morphological types within spheres of given radius; these are plotted in Fig. 6. In Fig. 7 we plot the integrated number of galaxies in each class within a sphere of given radius, normalised to the total number of galaxies in that same class. In addition to the well known morphological segregation between E, S0 and spirals (see, e.g., Whitmore 1994), we also show here the segregation between Se and Sl.
We found similar results by considering the Coma cluster sample alone.
3.3 Phase-space segregation
In the previous sections we have shown that galaxies of different morphological types have different (§ 3.1) and different spatial distributions (§ 3.2). The size of our data-sample allowed us to look for morphological segregation in phase-space, through the determination of the vdp of each different morphological class. Each vdp was determined using the LOWESS technique (Gebhardt et al. 1994; see B97 for a recent application of this technique to galaxy clusters).
In Fig. 8 we plot the vdp of all the galaxies of the synthethic cluster, and the vdp of E, S0, Se and Sl, separately. Confidence levels are not shown, for clarity, but they are shown in Fig. 9, where we plot the vdp for each class (with models superposed, see below). The all-galaxy vdp is similar to the E-vdp and the S0-vdp , not surprisingly so, since most cluster galaxies are E and S0. There are notable differences among the vdp of the different classes:
-
•
the late-type galaxies have a decreasing vdp in the centre, while the early-type galaxies have an increasing vdp out to 0.2 h-1 Mpc;
-
•
the vdp of E, S0 and Se are similar for distances h-1 Mpc, and nearly flat, while the Sl vdp is different and decreasing.


Interpreting these differences requires some modelling of the vdp . We have fitted the vdp using simple kinematical models in which we take into account the 3D galaxy distribution, as obtained from the King profiles (see § 3.2), and in which we allow the radial velocity profile to vary linearly with clustercentric distance, while the anisotropy, , is allowed to vary only when a constant anisotropy model could not provide a reasonable fit.
We found that the steep rise of the E vdp requires a substantial degree of tangential anisotropy in the centre () and more or less isotropic orbits outside 0.2–0.3 h-1 Mpc. The same is true for the S0 vdp , although in this case only a modest tangential anisotropy is needed in the cluster centre (). On the other hand, both the Se and the Sl vdp are sufficiently well fitted by constant anisotropy models (with decreasing radial velocity dispersion with radius), with for Se, and for Sl.
4 Discussion
Based on a data-set of galaxies in 40 Abell clusters, we have found that the galaxy phase-space distributions depend on the galaxy morphological types and luminosities. These results are based on a synthetic cluster, generated by combining all available cluster samples, and also on the Coma cluster sample alone, for which enough data are available to allow such an analysis.
Both the galaxy velocity dispersion and the average clustercentric distance are smaller, on average, for earlier type galaxies; galaxies brighter than have a smaller velocity dispersion than the other cluster galaxies, and the average magnitude of galaxies within 0.1 h-1 Mpc from the cluster centre is mag lower than the average magnitude of the other cluster galaxies (although the statistical significance of this last result is not well established, as it may be biased by the incompleteness of our sample). Note that the decrease of with magnitude only concerns E.
These findings confirm previous ones: the evidence for morphological segregation dates back to Curtis (1918) and Humason et al. (1956), with regards to the spatial distribution, and to Tammann (1972), Melnick & Sargent (1977), and Moss & Dickens (1977) with regards to the velocity distribution. The evidence for luminosity segregation dates back to Rood & Turnrose (1968), with regards to the spatial distribution, and to Rood et al. (1972) with regards to the velocity distribution (see § 1 for reference to more recent works).
The large size of our data-set has allowed us to go beyond these early results and get a better insight into these topics:
-
1.
Within the spiral class, we have considered separately early-spirals and late-spirals irregulars, and have shown that their distributions are different.
-
2.
We have combined the spatial and velocity distributions to determine the vdp of each morphological class, and have shown that they are different.
Modelling of these vdp has allowed us to show that the E and S0 orbits are predominantly tangential in the cluster core, and isotropic outside, while Se and Sl orbits have some degree of radial anisotropy (more marked for Sl). The central 3D velocity dispersions (in normalized units) are 1.4, 1.8, 2.1 and 2.4 for E, S0, Se and Sl respectively, and the Sl 3D- is larger than the E, S0 and Se 3D- at all radii. The Se and Sl vdp are steeper than the E and S0 vdp ; a peaked density profile can produce a steep vdp (den Hartog & Katgert 1996), but in our sample we see the opposite, late-type galaxies are characterized by flatter density profiles and at the same time steeper vdp than early-type galaxies. More likely, the different morphological-type populations do not share the same dynamical status: if S0 are the virialized cluster population, the fact that the Sl kinetic energy is almost twice the S0 kinetic energy in the cluster centre indicates that Sl are a bound yet not virialized cluster population. Their radial anisotropy then suggests that Sl may be falling into the cluster for the first time, similarly to what has been suggested for narrow-angle-tail radio sources (O’Dea et al. 1987). These conclusions recall those of B97 about emission-line galaxies, and those by Tully & Shaya (1984) about spirals in the Virgo cluster.
On the other hand, the low velocity dispersion of E, their tangential anisotropy, and their central location, are all suggestive of a phase-space distribution modified by the process of dynamical friction (den Hartog & Katgert 1996 and references therein). Indeed, if the mass-to-light ratio of cluster galaxies is not a steep function of their luminosities, it is easy to show that the timescale of the dynamical friction process is Gyr for ellipticals in the cluster core (Sarazin 1986). Consistently with this scenario, faint E (), i.e. those less affected by the process of dynamical friction (assuming they are also less massive), do not share the same vdp as bright E, their orbits being more isotropic and their vdp more isothermal (a different kinematics for bright and faint galaxy in the Coma cluster was already suggested by Biviano et al. 1996).
5 Conclusions
Our analysis of the phase-space distributions of cluster galaxies has shown that they differ according to the galaxy luminosities and morphological types. We have interpreted these differences as evidence that the elliptical phase-space distribution is evolving towards energy equipartition (e.g. Capelato et al. 1981), while, at the other extreme, the late spirals are still falling into the cluster for the first time (e.g. Melnick & Sargent 1977, Moss & Dickens 1977, B97). The phase-space distributions of S0 and early spirals are intermediate between these two extremes.
These findings constrain theories of cluster formation and evolution, as they suggest an ongoing evolution of the cluster population through the process of dynamical friction and of secondary infall. The comparison of the phase-space distributions of distant cluster galaxies with local ones is needed to shed light on this topic. Observations with the Hubble Space Telescope (e.g. Dressler & Smail 1997) and/or accurate spectroscopy on 8 m class telescopes should make such a comparison feasible soon.
Acknowledgements.
We wish to thank Dr. Leo Metcalfe for a careful reading of the manuscript. We acknowledge financial support from the French GDR Cosmologie and INSU. AB acknowledges the hospitality of the Leiden Sterrewacht, during his postdoctoral fellowship, when the catalogue used in this paper was compiled.References
- [1] Adami C., Mazure A., Biviano A., Katgert P., Rhee G. 1997a, A&A submitted
- [2] Adami C., Mazure A., Katgert P., Biviano A. 1997b, A&A in preparation
- [3] Adams M.T., Strom K.M., Strom, S.E. 1980, ApJ 238, 445
- [4] Andreon S. 1996, A&A 314, 763
- [5] Beers T.C., Bothun G.D. 1992, ApJ 400, 410
- [6] Beers T.C., Flynn K., Gebhardt K. 1990, AJ 100, 32
- [7] Beers T.C., Forman W., Huchra J.P., Jones C., Gebhardt K. 1991, AJ 102, 1581
- [8] Biviano A. 1986, Laurea thesis
- [9] Biviano A., Durret F., Gerbal D. et al. 1996, A&A 311, 95
- [10] Biviano A., Girardi M., Giuricin G., Mardirossian F., Mezzetti M. 1992, ApJ 396, 35 (B92)
- [11] Biviano A., Katgert P., Mazure A. et al. 1997, A&A 321, 84 (B97)
- [12] Bothun G.D., Schombert J.M. 1988, ApJ 335, 617
- [13] Burstein D., Heiles C. 1982, AJ 87, 1165
- [14] Butcher H.R., Oemler A.Jr. 1985, ApJS 57, 665
- [15] Capelato H.V., Gerbal D., Mathez G. et al. 1981, A&A 96, 235
- [16] Carlberg R.G., Yee H.K.C., Ellingson E. et al. 1997, ApJ 476, 7
- [17] Chapman G.N.F., Geller M.J., Huchra J.P. 1987, AJ 94, 571
- [18] Chapman G.N.F., Geller M.J., Huchra J.P. 1988, AJ 95, 999
- [19] Chincarini G., Rood H.J. 1977, ApJ 214, 351
- [20] Chincarini G., Tarenghi M., Bettis C. 1981, A&A 96, 106
- [21] Colless M. 1989, MNRAS 237, 799
- [22] Colless M., Dunn A. 1996, ApJ 458, 435
- [23] Colless M., Hewett P. 1987, MNRAS 224, 453
- [24] Curtis H.D. 1918, Pub. Lick Obs. 13, 55
- [25] den Hartog R., Katgert P. 1996, MNRAS 279, 349
- [26] Dickens R.J., Currie M.J., Lucey J.R. 1986, MNRAS 220, 679
- [27] Dickens R.J., Moss C. 1976, MNRAS 174, 47
- [28] Dressler A. 1980a, ApJS 42, 565
- [29] Dressler A. 1980b, ApJ 236, 351
- [30] Dressler A., Shectman S.A. 1988, AJ 95, 284
- [31] Dressler A., Smail I. 1997, in HST and the High Redshift Universe, eds. N. Tanvir, A. Aragón-Salamanca, J.V. Wall, World scientific, in press.
- [32] Escalera E., Biviano A., Girardi M. et al. 1994, ApJ 423, 539
- [33] Ettori S., Guzzo L., Tarenghi M. 1995, MNRAS 276, 689
- [34] Faber S.M., Dressler A. 1977, AJ 82, 187
- [35] Fabricant D.G., Kent S.M., Kurtz M.J. 1989, ApJ 336, 77
- [36] Fabricant D., Kurtz M., Geller M. et al. 1993, AJ 105, 788
- [37] Fanti C., Fanti R., Feretti L. et al. 1982 A&A 105, 200
- [38] Gavazzi G. 1987, ApJ 320, 96
- [39] Gebhardt K., Pryor C., Williams T.B., Hesser J.E. 1994, AJ 107, 2067
- [40] Geller M.J., Beers T.C., Bothun G.D., Huchra J.P. 1984, AJ 89, 319
- [41] Giovanelli R., Haynes M.P., Chincarini G.L. 1982, ApJ 262, 442
- [42] Girardi M., Biviano, A., Giuricin G., Mardirossian F., Mezzetti M. 1993, ApJ 404, 38
- [43] Girardi M., Biviano, A., Giuricin G., Mardirossian F., Mezzetti M. 1995, ApJ 438, 527
- [44] Girardi M., Fadda D., Giuricin G. et al. 1996, ApJ 457, 61
- [45] Gregory S.A., Thompson L.A. 1978, ApJ 222, 784
- [46] Gregory S.A., Thompson L.A., Tifft W.G. 1981, ApJ 243, 411
- [47] Haynes M.P. 1980, ApJS 42, 83
- [48] Hill J.M., Oegerle W. R. 1993, AJ 106, 831
- [49] Hintzen P. 1980, AJ 85, 626
- [50] Hintzen P., Hill J.M., Lindley D., Scott J.S., Angel J.R.P. 1982, AJ 87, 1656
- [51] Hubble E. & Humason M.L. 1931, ApJ 74, 43
- [52] Huchra J.P., Geller M.J., Clemens C.M., Tozrk S.P., Michel A. 1995, The Center for Astrophysics Redshift Catalogue (ZCAT)
- [53] Humason M.L., Mayall N.V., Sandage A.R. 1956, AJ, 61, 144
- [54] Katgert P., Mazure A., Perea J. et al. 1996, A&A 310, 8
- [55] Katgert P., Mazure A., den Hartog R. et al. 1997, A&A submitted
- [56] Kent S.M., Gunn J.E. 1982, AJ 87, 945
- [57] Kent S.M., Sargent W.L.W. 1983, AJ 88, 697
- [58] King, I. 1962, ApJ 62, 471
- [59] Lauberts A., Valentijn E.A. 1989 The Surface Photometry Catalogue of the ESO-Uppsala Galaxies, Garching bei Munchen: ESO
- [60] Lax D. 1985, J.Am.Stat.Assoc. 80, 736
- [61] Ledermann W. 1982, Handbook of Applicable Mathematics, 6 New York: Wiley
- [62] Lucey J.R., Carter, D. 1988, MNRAS 235, 1177
- [63] Lucey J.R., Dickens R.J., Mitchell R.J., Dawe J. A. 1983, MNRAS 203, 545
- [64] Lugger P.M. 1989, ApJ 343, 572
- [65] Malumuth E.M., Kriss G.A., Van Dyke Dixon W., Ferguson H.C., Ritchie C. 1992, AJ 104, 495
- [66] Mamon G.A. 1992, ApJ 401, 1
- [67] Mamon G.A. 1996, in ”Third Chalonge Colloque Cosmologie”, p.95, H. de Vega, N.S. Sánchez eds. (Singapore: World Scientific) (astro-ph/9511101)
- [68] Melnick J., Sargent W.L.W. 1977, ApJ 215, 401
- [69] Mohr J.J., Geller M.J., Fabricant D.G. et al. 1996, ApJ 470, 724
- [70] Moss C., Dickens R.J. 1977, MNRAS 178, 701
- [71] Nilson P. 1973, Uppsala General Catalogue of Galaxies, Stockholm, Almquist and Wiksell
- [72] O’Dea C.P., Sarazin C.L., Owen F.N. 1987, ApJ, 316, 113
- [73] Oegerle W.R., Hoessel J.G. 1989, AJ 98, 15230
- [74] Oemler A. Jr. 1974, ApJ 194, 1
- [75] Oemler A. Jr. 1992, in ”Clusters and Superclusters of Galaxies”, p.29, A. Fabian ed. (Dordrecht: Kluwer Academic Publishers)
- [76] Ostriker E.C., Huchra J.P., Geller M.J., Kurtz M.J. 1988, AJ 96, 1775
- [77] Pinkney J., Rhee G., Burns J.O. 1993, ApJ 416, 36
- [78] Postman M., Lauer T. R. 1995, ApJ 440, 28
- [79] Poulain P., Nieto J.L., Davoust E. 1992, A&AS 95,129
- [80] Proust D., Quintana H., Mazure A. et al. 1992, A&A 258, 243
- [81] Quintana H., Ramirez A. 1990, AJ 100, 1424
- [82] Richter O.G. 1987, A&AS 67, 237
- [83] Richter O.G. 1989, A&AS 77, 237
- [84] Rood H.J., Page T.L., Kintner E.C., King I.R. 1972, ApJ, 175, 627
- [85] Rood H.J., Turnrose B.E. 1968, ApJ 152, 1057
- [86] Sandage A. 1973, ApJ 183, 711
- [87] Sanroma M., Salvador-Sole E. 1990, ApJ 360, 16
- [88] Sarazin C.L. 1986, Rev. Mod. Phys. 58, 1
- [89] Schneider D.P., Gunn J.E., Hoessel J.G. 1983, ApJ 264, 337
- [90] Scodeggio M., Solanes J.M., Giovanelli R., Haynes M.P. 1995, ApJ 444, 41
- [91] Sharples R.M., Ellis R.S., Gray P.M. 1988, MNRAS 231, 479
- [92] Sodré L.Jr., Capelato H.V., Steiner J.E., Mazure A. 1989, AJ 97, 1279
- [93] Stein P. 1996, A&AS 116, 203
- [94] Stein P. 1997, A&A 317, 670 (S97)
- [95] Struble M.F. 1979, AJ 84, 27
- [96] Tammann G.A. 1972, A&A 21, 355
- [97] Tarenghi M., Tifft W. G., Chincarini G., Rood H.J., Thompson L.A. 1979, ApJ 234, 793
- [98] Teague P.F., Carter D., Gray P.M. 1990, ApJS 72, 715
- [99] Tifft W.G. 1978, ApJ 222, 54
- [100] Tully R.B., Shaya E.J. 1984, ApJ 281, 31
- [101] White S.D.M. 1992, in ”Clusters and Superclusters of Galaxies”, p.17, A. Fabian ed. (Dordrecht: Kluwer Academic Publishers)
- [102] Whitmore B.C. 1994, in ”Clusters of Galaxies”, proc. of the XXIX Rencontre de Moriond, p.69, F. Durret, A. Mazure, J. Trân Thanh Vân eds. (Singapore: Editions Frontières)
- [103] Whitmore B.C., Gilmore D.M. 1991, ApJ 367, 94
- [104] Whitmore B.C., Gilmore D.M., Jones C. 1993, ApJ, 407, 489
- [105] Willmer C.N.A., Focardi P., Chan R., Pellegrini P.S., Nicolaci Da Costa L. 1991, AJ 101, 57
- [106] Yepes G., Dominguez-Tenreiro R., Del Pozo-Sanz R. 1991, ApJ 373, 336
- [107] Zabludoff A.I., Geller M.J., Huchra J.P., Vogeley M.S. 1993, AJ 106, 1273
- [108] Zabludoff A.I., Huchra J.P., Geller M.J. 1990, ApJS 74, 1
- [109] Zwicky F., Herzog E., Wild P., Karpowicz M., Kowal C. 1961-1968 Catalog of Galaxies and of Clusters of Galaxies, vol.s 1-6, Pasadena: California Institute of Technology