Molecular Hydrogen Line Emission from the Reflection Nebula Parsamyan 18
Abstract
The newly-commissioned University of New South Wales Infrared Fabry-Perot (UNSWIRF) has been used to image molecular hydrogen emission at 2.12 and 2.25 m in the reflection nebula Parsamyan 18. P 18 is known to exhibit low values of the ratio suggestive of UV-pumped fluorescence rather than thermal excitation by shocks. Our line ratio mapping reveals the full extent of this fluorescent emission from extended arc-like features, as well as a more concentrated thermal component in regions closer to the central exciting star. We show that the emission morphology, line fluxes, and gas density are consistent with the predictions of photodissociation region (PDR) theory. Those regions with the highest intrinsic intensities also tend to show the highest line ratios. Furthermore, variations in the line ratio can be attributed to intrinsic fluctuations in the incident radiation field and/or the gas density, through the self-shielding action of H2. An isolated knot of emission discovered just outside P 18, and having both an unusually high ratio and relative velocity provides additional evidence for an outflow source associated with P 18.
keywords:
reflection nebulae – ISM: individual: Parsamyan 18 – shock waves – molecular processes1 Introduction
The ‘cometary nebula’ Parsamyan 18 (P 18 = NGC 2316 = L 1654) has properties characteristic of both reflection and emission nebulae. Near-infrared emission lines of molecular hydrogen have been observed, as well as emission features at 3.3, 6.2, 7.7, 8.6, and 11.3 m (Sellgren 1986; Burton et al. 1990; Sellgren, Werner, & Allamandola 1996) attributed to aromatic hydrocarbons. Similar emission features and near-infrared colours were found in over half of the visual reflection nebulae surveyed by Sellgren et al. (1996). López et al. (1988) used a combination of optical, infrared, and radio continuum observations to argue that the two brightest regions of P 18 are not in fact stars, but actually represent light from a heavily-obscured H ii region breaking through a dust shell surrounding the exciting early B-type star. On the basis of (unpublished) optical spectra however, Sellgren et al. (1996) list both components as being stellar, with the northeastern star (Star ‘A’, a B2-3e star with ) illuminating the dust as well as exciting the atomic and molecular hydrogen.
P 18 was only the second object (after NGC 2023; Gatley et al. 1987) found to have infrared H2 emission line ratios similar to the predictions of UV-pumped fluorescence, rather than thermal excitation by shocks (Sellgren 1986). In nearly all such studies to date, line ratios and inferred excitation mechanisms are based on large-aperture spectra, or from only a single pointing. With the advent of imaging infrared Fabry-Perot systems (with resolving powers that provide the necessary contrast between line and continuum), it has now become possible to carry out line ratio mapping. This could be a useful aid in discriminating between the sources of excitation, on the basis of line ratio trends and morphology. In this paper, we report the results of our H2 line imaging of P 18 using the University of New South Wales Infrared Fabry-Perot (UNSWIRF).
Our results show that ‘collisional fluorescence’ is occurring in P 18. That is, pure fluorescent line ratios are thermally modified by the effects of collisions. This occurs in dense molecular clouds where H2 self-shielding maintains a significant column density of the molecule close to the cloud surface (i.e., A), where the gas temperature can reach a few thousand degrees (e.g., Sternberg & Dalgarno 1989; Burton, Hollenbach, & Tielens 1990 [hereafter BHT]). Emission line ratios are then sensitive to the density and radiation field, and so observations with sufficiently high spatial resolution can be used to trace the variation of these parameters within a source. Large aperture measurements of both H2 and high– CO lines (e.g., Hayashi et al. 1985; Stutzki et al. 1990) of many such ‘photodissociation regions’ or PDRs (Tielens & Hollenbach 1985; BHT) have indicated they are clumpy, containing regions where the density must be ten to a hundred times greater than the surrounding cloud. High spatial resolution H2 line ratio measurements may now be used to probe how this high density gas is distributed.
2 Observations
UNSWIRF is a 70 mm diameter Queensgate (UK) Ltd. etalon with , tunable over both the and windows (Ryder et al. 1997). When used in conjunction with the wide-field mode of IRIS111The Infrared Imager and Spectrometer (Allen et al. 1993) uses a HgCdTe array manufactured by Rockwell International Science Centre, CA. at the focus of the Anglo-Australian Telescope, a (roughly circular) field of 1.7 arcmin diameter at 0.77 arcsec pixel-1 is produced. Appropriate 1 per cent bandpass filters are used to ensure only a single order is passed by the etalon.
Observations of P 18 in the H2 (2.122 m) and H2 (2.248 m) lines were obtained on 1996 April 4 UT. A sequence of four images spanning the peak of the 2.122 m line (as determined from observations of OMC-1) and separated by of the instrumental profile width were obtained with UNSWIRF, while for the 2.248 m line, just three images spaced of the profile width apart were taken. In each case, another image at 3–4 profile widths from the line centre was obtained in order to sample the continuum. An integration time of 120 s per etalon setting was used, with non-destructive readouts every 5 s. The same exposure sequence was carried out on the sky 5 arcmin east of P 18. The object and sky exposures were repeated (with slight offsets from the previous positions), leading to total on-source integration times of 1920 s and 2880 s in the 2.122 and 2.248 m lines, respectively.
Dark current subtraction and linearisation are performed during readout. The object frames were sky-subtracted, and then flatfielded using normalised dome flatfields, using in each case images at the matching etalon settings. All frames were first registered using field stars, and all frames at a given etalon setting were averaged together. The continuum frames, appropriately scaled, were then subtracted from all other images to leave just pure line emission in each.
At this stage, the emission line images were ‘stacked’ into cubes of increasing etalon spacing / wavelength, so that a Lorentzian profile could be fitted to the (3 or 4) point spectrum at each pixel. Having already fixed the continuum level to be zero, the number of free parameters in the fitting was further reduced by constraining the width of the profile to be the same as that found by fits to high-resolution scans of Krypton arc lines (2.1165 m and 2.2485 m for the 2.12 m and 2.25 m cubes, respectively). We justify this on the basis that the narrow H2 line widths (16–20 ) observed in P 18 by Burton et al. (1990) would not be resolvable by UNSWIRF ( at 2.12 m). The output of the line fitting includes maps of the peak intensity, as well as the etalon setting corresponding to that peak. Blanking masks are constructed by requiring that the fitted peak position must lie within the range covered by the etalon sequence. Flux calibration, and continuum scaling factors, are provided by photometry of s observations of the spectroscopic standard BS 2882 (), also at the same etalon settings used for P 18.
3 Results
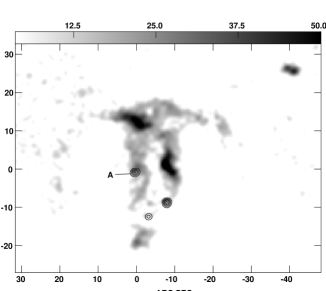
Figure 1 shows a grey-scale map of the 2.12 m line intensity, with contours of the three brightest 2.12 m continuum sources superimposed (including star ‘A’) to aid in comparing our new data to that elsewhere in the literature (e.g., López et al. 1988). The H2 emission structure can be conveniently divided into a number of distinct regions, as outlined in Figure 2. The emission line fluxes of each region are tabulated in Table 1. The integrated emission line flux of P 18 measured from the 2.12 m image is ergs cm-2 s-1, compared with the ergs cm-2 s-1 found in the matching 2.25 m image. Uncertainties in the absolute flux calibration and line-fitting procedures are roughly comparable in magnitude with the noise contribution ( ergs cm-2 s-1) per pixel over which the emission is summed.
| Regiona | db | FUV | Nd | Ratio | Peak | Ratio | Relative | ||
|---|---|---|---|---|---|---|---|---|---|
| Fieldc | Flux | Flux | Flux in region | at Peak | Velocitye | ||||
| (arcsec) | (G0) | (ergs ) | (ergs ) | (ergs arcsec-2) | () | ||||
| Whole Source | … | … | 2147 | … | … | … | |||
| 1 (E Arc) | 22 | 2400 | 766 | 1.6 | |||||
| 2 (N Peak) | 15 | 5060 | 248 | 2.9 | |||||
| 3 (Central Arc) | … | … | 260 | 4.8 | 0 | ||||
| 4 (S Peak) | 18 | 3500 | 147 | 3.3 | |||||
| 5 (W Peak) | 8 | 17800 | 373 | 7.0 | |||||
| 6 (NW Arc) | 19 | 3200 | 141 | 2.9 | |||||
| 7 (W Arc) | 25 | 1800 | 172 | 2.4 | |||||
| 8 (P 18-NW)f | 48 | 500 | 40 | 13.7 |
aNumbering as in Figure 2.
bProjected distance from Star A.
cIn units of the average interstellar field, for the projected distance from Star A.
dNumber of pixels, of size , included in region.
eRelative velocity of H2 emission from region.
fThis region is not linked with the others and is probably shock-excited, rather than irradiated by Star A (Section 4.4).
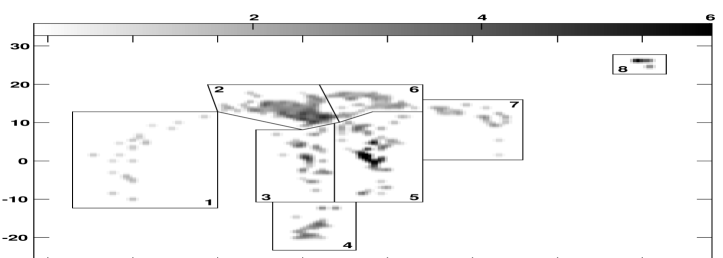
The morphology of the infrared molecular hydrogen emission differs somewhat from the ‘cometary’ nature displayed in the optical (Cohen 1974), and from the broad-band infrared and radio continuum images of López et al. (1988). Instead of a cone, the appearance is one of two incomplete, but overlapping arcs. With reference to Figure 2, one arc is outlined by the contiguous regions (1, 2, 5, 4), while the other is defined by the regions (4, 3, 6, 7). Each arc, if it were part of a complete ring, would have a diameter of arcsec, or 0.16 pc, assuming P 18 to be 1.1 kpc away (Hilton & Lahulla 1995). Star ‘A’, assumed to be the exciting source, sits on the periphery of the arc that extends to the west, and halfway between the centre and the edge of the easterly arc. The emission peaks (in both the 2.12 m and the 2.25 m images) in the areas due north and south of star ‘A’, where these two arcs overlap. In addition, more prominent emission at 2.12 m is found on the western edge of the eastern arc, arcsec due west of star ‘A’, as well as in an isolated knot of emission some 50 arcsec to the northwest of star ‘A’. This isolated patch (hereafter designated P 18-NW) has no continuum counterpart or obvious exciting source. Although none of this emission-line structure is apparent in the -band image of López et al. (1988), it is faintly visible in the FITS version of the imaging survey of CO molecular outflow sources carried out by Hodapp (1994).
Figure 2 is a grey-scale image of the ratio in P 18 for all points in which the intensity could be determined. The values found range from in the eastern arc, to as much as 7 in the nebular arc just west of Star ‘A’, and even higher in P 18-NW (though the detection here is barely at the 1 level). Figure 2 also demarcates the eight distinct regions whose fluxes, flux ratios, and relative velocities are tabulated in Table 1.
4 Discussion
4.1 Fluorescent Molecular Hydrogen
The average ratio of the and lines over the whole of P 18 is (Table 1), as expected for fluorescently excited gas slightly modified by a thermal contribution to the line. Pure fluorescent emission produces a line ratio of (e.g., Black & Dalgarno 1976; Black & van Dishoeck 1987), but this ratio can be exceeded when some of the gas is hot enough for the lower levels to be thermalised. We thus conclude, as did Sellgren (1986), that molecular gas in P 18 is irradiated by far–UV photons. It is situated in two arcs around star ‘A’, where some of the gas is hot enough for the level to be collisionally populated. This is characteristic of a dense photodissociation region (Sternberg & Dalgarno 1989; BHT). In these PDRs the gas is sufficiently dense that self-shielding of H2 occurs for optical depths from the cloud surface, so that molecules can exist in this warm, primarily atomic region. The typical line flux density in P 18 is ergs arcsec-2, and peaks at 8 ergs arcsec-2 just west of star ‘A’. These fluxes are consistent with the predictions for PDR models for gas of average density, irradiated by far–UV photons from star ‘A’, as we show below.
We estimate the far–UV flux from star ‘A’, a B2–3e star at 1.1 kpc (Sellgren et al. 1996) to be 5060 G0 in a shell away. Here G represents the average interstellar radiation field ( ergs ; Habing 1968). For gas of density exposed to far–UV fields G, BHT predict line fluxes of ergs arcsec-2 for a face-on PDR, consistent with the data. Note that our discovery of these arcs, and our interpretation of them as PDRs irradiated by star ‘A’, is at odds with the conclusion of López et al. (1988) that the continuum sources are not stellar, and merely unobscured sight-lines towards a compact H ii region. While P 18 shares some of the properties of an H ii region, we feel it would be too much of a coincidence if one of these spots also had a location and spectrum consistent with being the excitation source of the PDR.
For such conditions the models predict a purely fluorescent line ratio of , whereas the average ratio for the source is 2.9. This suggests that about half the emission is thermally contributed, and we discuss the implications of this further in § 4.3.
4.2 Geometry and Kinematics
The morphology suggests that star ‘A’ is surrounded by an (incomplete) shell seen in projection, and in this section we investigate whether the distribution of the H2 line emission is consistent with such a geometry.
Consider a spherical molecular shell surrounding an illuminating star as representing the arc through the N, W, and S peaks. Assuming that the average density in the cloud is low enough so that the emission is mainly fluorescent (see § 4.3), then the H2 emits primarily from a sheath whose thickness is A, with dust extinction determining the depth to which the far–UV photons penetrate. Viewed from afar the relative intensity along a line of sight is then proportional to the length of the sight line through the shell. We examined models where the thickness of the shell is varied as a proportion of its radius (see Figure 3), and found that when this is a reasonable fit to the data is achieved. Given the source distance of 1.1 kpc this provides a physical size to the shell, and assuming a standard extinction curve (i.e., ), yields an average density; specifically, for the N, S and W peaks respectively, we obtain thicknesses of , 5, and cm for the shell and average densities of , 4, and . The maximum filling factor in this model (ratio of the length of our sight line through the edge of the shell to that if seen face-on) is for a shell thickness of the radius. These densities are consistent with those derived by applying PDR models to the observed line intensities.


Although the ability of UNSWIRF to resolve lines is limited by its instrumental profile width ( , depending on parallelism), good signal-to-noise data such as the 2.12 m observations presented here allow us to measure changes in velocity over the image of only a few . The velocity data for the 2.12 m line centres (Table 1) show that motions in the gas must be small; differences of at most 10 are seen between the different regions, with the exception of P 18-NW (Section 4.4).
4.3 Line Ratios
4.3.1 Observed Parameter Space
For a dense PDR, where self-shielding is occurring, H2 exists at optical depths A from the front surface of the cloud. Then, for a sufficiently strong FUV radiation field, the gas temperature can reach K or higher, enabling collisions to redistribute the populations in the H2 energy levels. The line ratio then increases from the pure fluorescent value. It is sensitive to both the density and strength of the FUV field, and so can be used to constrain these parameters in a source. This is different from shock-excited gas where it has been shown empirically that there is little variation in this line ratio both among and within shocked sources (e.g., Burton et al. 1989). In particular, dense clumps of H2 inside the PDRs may have the level thermalised, while being surrounded by lower density gas exhibiting pure fluorescent line ratios. Such clumps would signal their presence by elevated levels of the ratio. This could then be used to probe the structure of the clouds.
We have thus sought to determine the fine-structure in the spatial variation of the ratio. We have registered the two images and applied a light Gaussian smooth (). In Figure 4 we plot the line ratio so derived against the line intensity. Two sets of symbols are shown in Fig 4; open circles for data points where both the and lines have , and lower limits for pixels where the S/N for the is (calculated as though its flux were ). The line ratio rises approximately linearly as the line flux increases, to a maximum line ratio of , but the dispersion in line ratio increases also. Similar plots for each of the eight distinct regions marked on Figure 2 are presented in Figure 5 (which also illustrates the effect of varying the FUV field) and indicate that most of this spread in line ratio for a given intensity is intrinsic to regions 2 and 6 (i.e., the northern regions of P 18). Our interpretation of such trends must be guarded however, owing to the large number of lower limits (non-detections in the line); high ratios for low fluxes cannot be excluded by our data. Nevertheless, line ratios consistent with pure fluorescence become progressively rarer as the line flux increases. We now seek to explain the apparent variations in line ratio with emission line flux.


4.3.2 Interpretation
In pure fluorescent gas we would obtain a line ratio of , independent of the line intensity. Localised regions of shocked gas would also be evident by a ratio of for a range of line intensities (see Brand et al. 1989). However we see neither such behaviour in P 18 (with the exception of P 18-NW, which we argue in Section 4.4 to be physically unassociated with the other molecular hydrogen emission regions).
Qualitatively the increase in line ratio can be understood as follows. At low density and FUV fields, the ratio is purely fluorescent. However for a fixed FUV field, H2 of sufficiently high density will be self-shielded, producing a thermal contribution to the line. Its flux will rise as the density does, while the line remains purely fluorescent. Thus we expect both the strength of the line and the ratio with the line to rise as the density rises.
This line ratio variation can also be understood quantitatively through the PDR models of BHT. BHT derive a number of scaling relations depending on (i) whether n/G0 is less than, or greater than 40 (determining if H2 self-shielding occurs), and (ii) whether n is less than, or greater than ncrit, the density where collisional de-excitation equals the radiative decay rate from a level. The line intensity can be divided into a UV–pumped () and a thermal () part, as follows:
When n/G (self-shielding unimportant):
| (1) |
When n/G (self-shielding important):
| (2) |
The thermal contribution is given by:
| (3) |
where N2 is the column of warm H2 (i.e., at A) with temperature , E is the energy of the level of interest, is the collisional excitation rate from the ground state, and Z(T) is the H2 partition function.
For the bulk of the gas, with density and G, we have both and n/G . The line intensity is then simply proportional to the product of the density and the filling factor, f. To within a factor of 3, for , ergs arcsec-2, where n4 is the density in units of (see equation 1). As discussed in § 4.1, this is consistent with the average line fluxes observed for filling factors of , with , the value deduced from the geometrical model (see § 4.2).
The detailed models of BHT show that the thermal contribution to the line intensities is negligible when G, and also when for G. However for the larger FUV–field, the thermal contribution to the line flux is for (the line remains purely fluorescent). Thus higher line fluxes and ratios imply the presence of some gas of at least this density.
For the E and W arcs (see Table 1), where the G0 is , the line ratio is constant at . In the N and S peaks and the NW arc, with G0 = 5060, 3500, and 3200 respectively, a thermal contribution to the line ratio is becoming apparent. At the W peak, closest to the illuminating source, where G, both the line intensity and ratio are highest; the line flux density is however, relatively diffuse at this latter position. On the basis of Figure 5, it would seem reasonable that the Central arc, although apparently superimposed on star ‘A’, must in fact lie at a similar distance from it as the E and W arcs.
These observations can be understood as follows. For the arcs, where the FUV field is low, the emission is purely fluorescent, but the line ratio is insensitive to density. At the N and S peaks, a thermal contribution would be expected for . The line ratios at the brightest pixels suggest that of the emission there is thermal, and thus has densities this high. At the W peak, self-shielding will occur when . The data here are thus sensitive to the presence of gas denser than this, a density also larger than ncrit. Ratios observed are as high as 7, implying that as much as 70% of the emitting gas at those positions is at least this dense.
Over the W peak, the specific intensity of the line is relatively weaker, in comparison with that of the line, than at the other peaks excited by star ‘A’. In this region, the FUV field G0 exceeds . There is a significant thermal contribution to the flux from dense gas. The flux however remains purely fluorescent. Indeed, as seen by equation 2, its intensity is predicted to decrease as 1/n, consistent with the observation that it gets relatively weaker. At other peaks, the FUV field is not sufficiently high for us to expect to observe this behaviour.
The maximum line intensity that is purely fluorescent, arising from gas of average cloud density, occurs when the filling factor is , and the flux density is ergs arcsec-2 for the spherical shell geometry we have modeled. For higher line fluxes a thermal component is present, and the line ratio rises above the pure fluorescent value. The thermal component arises from gas of density at least , and both the highest line fluxes and line ratios occur when the filling factor of this dense gas is greatest.
The spread of observed line ratios between the minimum and maximum values for a fixed line flux can be understood by a variation of the relative filling factors for the low density and high density gas. The lowest ratio occurs when the proportion of low density gas is highest and rises, for a fixed flux level, as both the fraction of low density gas falls and that of the high density gas rises. Thus data with sufficiently high S/N to accurately map the line ratio variation from pixel to pixel could be used to determine the micro-structure of the clumping. The line ratio map (Figure 2), for positions where G, is effectively showing the relative amounts of high and low density gas.
We thus conclude that the variations in the line ratio are consistent with the PDR models, self-shielding of gas occurring in its densest parts, with thermal contributions evident when exposed to the highest radiation fields. Localised regions where the density is more than ten times the average exist throughout the molecular cloud. The highest line fluxes and line ratios occur together, where both the filling factor of low and high density gas is greatest, and changes in line ratio from position to position reflect changes in the relative filling factors of these components.
4.4 P 18-NW
The isolated flux peak to the northwest (designated by us as P 18-NW) however, shows no evidence for fluorescent line emission. The line here is barely detected, and the line ratio is clearly thermal in nature, similar to shock-excited values. P 18-NW is too far from star ‘A’ for collisional fluorescence to be significant, as G. We suggest that there is a localised source of heating, possibly shocking the gas.
The simultaneous velocity coverage of UNSWIRF offers at least one clue. We notice that the line centre velocity in P 18-NW is also quite different to the rest of P 18. On account of its redshift of relative to the central arc, we speculate that P 18-NW might in fact be associated in some way with the CO outflow source observed by Fukui (1989) and by Felli, Palagi & Tofani (1992). Although Fukui identified the outflow with the position of star ‘A’, the 3 arcmin beam used for the CO observations is much larger than the 45 arcsec separation between star ‘A’ and P 18-NW. The IRAS point source discussed by López et al. (1988) and by Felli et al. (1992), namely IRAS , has a bolometric luminosity and colours suggestive of an ultra-compact H ii region, though neither H2O (Felli et al. 1992) nor methanol (Walsh et al. 1997) masers have been detected from it. While the IRAS positional uncertainties do not preclude an association of P 18-NW with the IRAS source, it is perhaps more likely that the H2 line emission observed from P 18-NW is shock-excited by the interaction of an outflow, from an embedded source in P 18, with the ambient cloud material. More detailed CO observations are needed to clarify the influence of any outflow activity on the excitation and environment of P 18.
5 Conclusions
The reflection nebula Parsamyan 18 has been imaged in both the 2.122 and 2.248 m emission lines of molecular hydrogen using the UNSW Infrared Fabry-Perot on the AAT, allowing us to study variations in their ratio within the nebula. The emission-line morphology appears as a pair of overlapping arcs, consistent with incomplete PDR shells irradiated by a single early B-type star. We believe we can identify this star in our continuum maps, which contradicts previous claims that the stellar-like sources in P 18 are ‘windows’ in a circumstellar dust shell, illuminated by a compact H ii region. Modeling suggests that the thickness of the fluorescing shells is roughly 25% of their radius, with average gas densities of , and dust extinction limiting the penetration of the FUV photons. In addition, some regions of P 18 display line ratios indicative of collisional fluorescence in the densest regions exposed to the highest radiation fields. In general, those regions with the highest intrinsic intensities also have the highest line ratios, a result of this process. Within these regions, large ranges in the observed line ratio can be understood as arising from the underlying variations in the relative filling factors of high- and low-density gas. We have discovered an isolated knot of shock-excited H2 gas just outside the nebula, which we argue on kinematical grounds is more likely to be associated with the CO outflow source reported in this region. This study highlights the advantages of an imaging Fabry-Perot system over traditional long-slit spectroscopy for emission-line imaging, and for understanding the excitation mechanism of molecular hydrogen in particular.
Acknowledgments
We acknowledge useful discussions with Peter Brand and Antonio Chrysostomou, and suggestions from the referee for improving the paper. We thank Yin-Sheng Sun for valuable assistance in calibrating UNSWIRF. S.D.R. acknowledges the receipt of a UNSW Vice-Chancellor’s Postdoctoral Fellowship. UNSWIRF was funded by a grant from the Australian Research Council.
References
- [1] Allen D. A. et al., 1993, PASA, 10, 298
- [2] Black J. H., Dalgarno A., 1976, ApJ, 203, 132
- [3] Black J. H., van Dishoeck E. F., 1987, ApJ, 322, 412
- [4] Brand P. W. J. L., Toner M. P., Geballe T. R., Webster A. S., Williams P.M., Burton M. G., 1989, MNRAS, 236, 929
- [5] Burton M. G., Brand P. W. J. L., Geballe T. R., Webster A. S., 1989, MNRAS, 236, 409
- [6] Burton M. G., Geballe T. R., Brand P. W. J. L., Moorhouse A., 1990, ApJ, 352, 625
- [7] Burton M. G., Hollenbach D. J., Tielens A. G. G. M., 1990, ApJ, 365, 620 (BHT)
- [8] Cohen M., 1974, PASP, 86, 813
- [9] Felli M., Palagi F. Tofani G., 1992, A&A, 255, 293
- [10] Fukui Y., 1989, in Low Mass Star Formation and Pre-Main Sequence Objects, ed. B. Reipurth (Garching: ESO), 95
- [11] Gatley I., Hasegawa T., Suzuki H., Garden R., Brand P., Lightfoot J., Glencross W., Okuda H., Nagata T., 1987, ApJ, 318, L73
- [12] Habing H. J., 1968 Bull. Astr. Inst. Netherlands, 19, 421
- [13] Hayashi M., Hasegawa T., Gatley I., Garden R., Kaifu, N., 1985, MNRAS, 215, 31P
- [14] Hilton J., Lahulla J. F., 1995, A&AS, 113, 325
- [15] Hodapp K.-W., 1994, ApJS, 94, 615
- [16] López J. A., Roth M., Friedman S. D., Rodríguez L. F., 1988, Rev. Mexicana Astron. Astrofis., 16, 99
- [17] Ryder S. D., Sun Y.-S., Storey J. W. V., Ashley M. C. B., Burton M. G., Allen L. E., 1997, in preparation
- [18] Sellgren K., 1986, ApJ, 305, 399
- [19] Sellgren K., Werner M. W., Allamandola L. J., 1996, ApJS, 102, 369
- [20] Sternberg A., Dalgarno A., 1989, ApJ, 338, 197
- [21] Stutzki J., Stacey G. J., Genzel R., Graf U. U., Harris A. I., Jaffe D. T., Lugten J. B., Poglitsch A., 1990, in Submillimetre Astronomy, eds. G. D. Watt & A. S. Webster (Dordrecht: Kluwer), 269
- [22] Tielens A. G. G. M. Hollenbach D. J., 1985, ApJ, 291, 722
- [23] Walsh A. J., Hyland A. R., Robinson G., Burton M.G., 1997, MNRAS, in press