Resolved structure in the nuclear region of the ultraluminous infrared galaxy Mrk 273
Abstract
We have studied the core morphology of the ultraluminous infrared galaxy Mrk 273 by combining a high-resolution adaptive optics near-infrared image with an optical image from the Hubble Space Telescope and interferometric radio continuum data, all at spatial resolutions of 150 mas or better. The near-infrared image reveals that the nucleus has two main components, both of which have radio counterparts. The strongest component (N) shows very similar extended structure in the radio and near-infrared. It has a flat radio spectrum and is resolved into a double-lobed structure (Ne; Nw), with a separation of mas (70 parsec). A similar structure is detected in the near-infrared. We identify this component as the location of the active nucleus. The second component (SW), strong in the near-infrared but relatively weak in the radio, is located arcsecond to the southwest. We interpret this as an obscured starburst region associated with the merger. The radio continuum images show a third, strong, component (SE) which has previously been interpreted as a second nucleus. However, it shows no associated optical or near-infrared emission, suggesting that it is in fact a background source.
keywords:
Galaxies: Active – Galaxies: Individual: Markarian 273 – Galaxies: Interactions – Galaxies: Nuclei – Galaxies: Seyfert – Radio Continuum: Galaxiesknapen, seppo, jyates, ar@star.herts.ac.uk
amsr@jb.man.ac.uk
doyon, nadeau@astro.umontreal.ca
1 Introduction
Ultraluminous infrared galaxies (ULIRGs) are among the brightest known galaxies, some with , comparable with quasars. These extreme, mostly infrared, luminosities are thought to be produced by dust which enshrouds, and is heated by, a powerful source of optical–UV continuum. The most likely candidates for this energy source are an active galactic nucleus (AGN) or a massive starburst (Joseph & Wright 1985; Sanders et al. 1988; Sanders, Scoville & Soifer 1991). In either case, it is probable that the nuclear activity is triggered by the merger of two gas-rich galaxies (Solomon et al. 1997). Optical imaging shows that ULIRGs generally exhibit morphological peculiarities such as tidal tails or double nuclei which are often associated with galaxy mergers (e.g. Sanders et al. 1988; Melnick & Mirabel 1990).
Mrk 273 (UGC 08696; 1342+561), at a distance of 151 Mpc111We adopt km s-1 Mpc-1. At the distance of Mrk 273 one arcsecond corresponds to 0.7 kpc., is one of the most luminous and best studied IRAS galaxies, with . Optical spectroscopy reveals strong emission lines characteristic of a Seyfert 2 nucleus (Koski 1978; Sanders et al. 1988), although the high Balmer decrement suggests that the narrow emission line region suffers considerable extinction ( mag). On the other hand, Goldader et al. (1995) find evidence for a starburst signature in a 3 arcsec aperture -band spectrum. The optical morphology of Mrk 273 suggests a highly disturbed system, the most striking feature being a “tail” extending nearly an arcminute ( kpc) south of the main body of the galaxy (Fig. 1), strongly indicative of a merger remnant (cf. Toomre & Toomre 1972). More detailed imaging observations suggest that the latter may have a multiple nucleus (Koroviakovskii et al. 1981; Mazzarella & Boroson 1993). Near-infrared (NIR) imaging by Majewski et al. (1993) first showed a double structure at 2.2 m, with components to the north and southwest separated by arcsec. Evidence for a multiple nucleus has also been presented by Condon et al. (1991), who mapped Mrk 273 as part of an 8.44 GHz survey of ULIRGs. Their 300 mas resolution image shows two strong radio components (N and SE) separated by 800 mas which they interpret as a double nucleus resulting from a recent merger.
New developments in optical, NIR and radio interferometry imaging technology have dramatically increased the spatial resolution at which multi-wavelength morphological studies can be performed. We have used these techniques to study the core structure of Mrk 273 with the aim of testing the merger hypothesis for this object, and, by extension, other ULIRGs. In this letter, we present a data set consisting of NIR -band, optical 7940 Å and 1.6, 5 and 8.4 GHz radio continuum images, all at resolutions around, or better than, 150 mas.
2 Observations and data processing
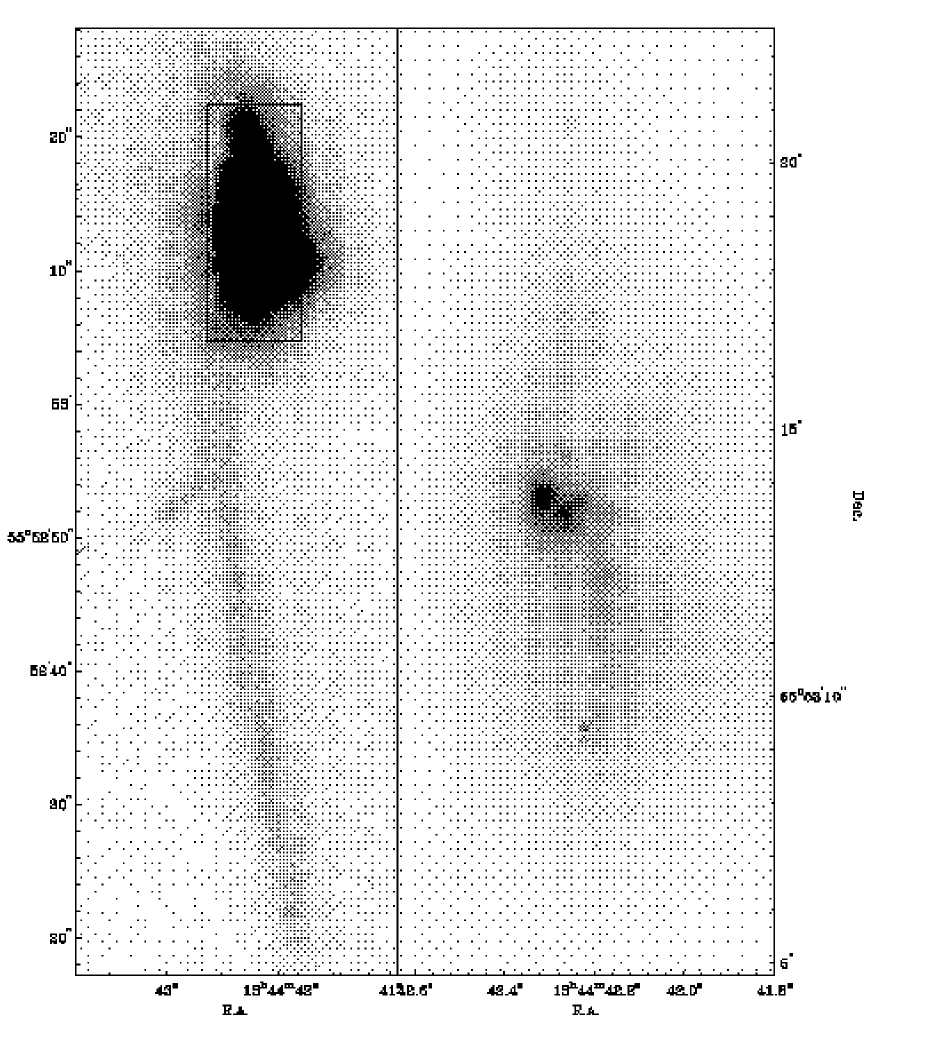
The optical image of Mrk 273 (Fig. 1) was obtained from the HST archive. It is a WFPC2 image taken through the F814W (-band) filter. We obtained the flat-fielded image and removed cosmic ray hits interactively (a few remain in the nuclear region).
The -band image (Fig. 2) was obtained on the night of 19 March 1997 on the Canada-France-Hawaii Telescope (CFHT) using the adaptive optics system PUEO (Rigaut et al. 1997a), combined with the NIR camera MONICA (Nadeau et al. 1994). PUEO uses a curvature mirror and a wavefront sensor working with guide stars up to magnitude 14 to give diffraction limited images at and . Individual images were sky-subtracted, flatfielded, corrected for bad pixels and combined in a final mosaic. The uncorrected seeing was 600 mas, while the corrected resolution was near the diffraction limit at , 125 mas. We used throughout the image scale of 34.380.07 mas/pixel and rotation prescription from Rigaut et al. (1997b). The orientation of the -band image is accurate to within 0.1 degree.
| Beam | Area | rms | |||||||||
|---|---|---|---|---|---|---|---|---|---|---|---|
| (GHz) | (mas) | (mJy/beam) | (mJy) | (arcsec2) | (mJy/bm) | ||||||
| \tableline | N | SE | SW | N | SE | SW | N | SE | SW | ||
| \tableline1.6 | 150 | 17.9 | 11.4 | 0.5 | 71.7 | 17.4 | 0.340 | 0.131 | 0.15 | ||
| 1.6 | 300 | 41.0 | 15.9 | 0.6 | 0.15 | ||||||
| 5 | 50 | 4.8\tablenotemarka | 2.4 | 0.1 | 40.8 | 4.8 | 0.145 | 0.023 | 0.04 | ||
| 5 | 150 | 17.0 | 2.4 | 0.3 | 0.10 | ||||||
| 5 | 300 | 29.0 | 5.2 | 0.5 | 0.09 | ||||||
| 8.4 | 300 | 20.4 | 3.2 | 0.3 | 36.4 | 3.7 | 0.2 | 1.203 | 0.398 | 0.123 | 0.03 |
aPeak flux of the strongest of twin peaks (Ne).
| R.A. | Dec. | |||
| (mag) | (L) | |||
| \tablelineNe | 13h44m42 | 5553′13 | 17.1 | |
| Nw | 13h44m42 | 5553′13 | 19.1 | |
| N | 13h44m42 | 5553′13 | 13.4 | |
| SW | 13h44m42 | 5553′12 | 14.2 | |
| SE | 13h44m42 | 5553′12 | - | - |
Mrk 273 was observed at 4993 MHz (6 cm, 27 November 1992) and 1656 MHz (18 cm, 13 December 1995) with the Multi-Element Radio-Linked Interferometer Network (MERLIN). The nearby QSO 1335+552 was used to correct phase and amplitude errors, while OQ208 and 3C286 were used as flux calibrators. The maximum baseline is 217 km, giving a natural beam size of 55 mas at 5 GHz and 170 mas at 1.6 GHz. The bandwidths used were 16 MHz at 5 GHz and 8 MHz at 1.6 GHz. Noise characteristics and peak fluxes of the radio data are shown in Table 1, and radio positions in Table 2. The MERLIN positions are absolute and accurate to 2 mas at 5 GHz and 5 mas at 1.6 GHz. These radio data can therefore be used as an astrometric reference. The flux calibration is accurate to %.
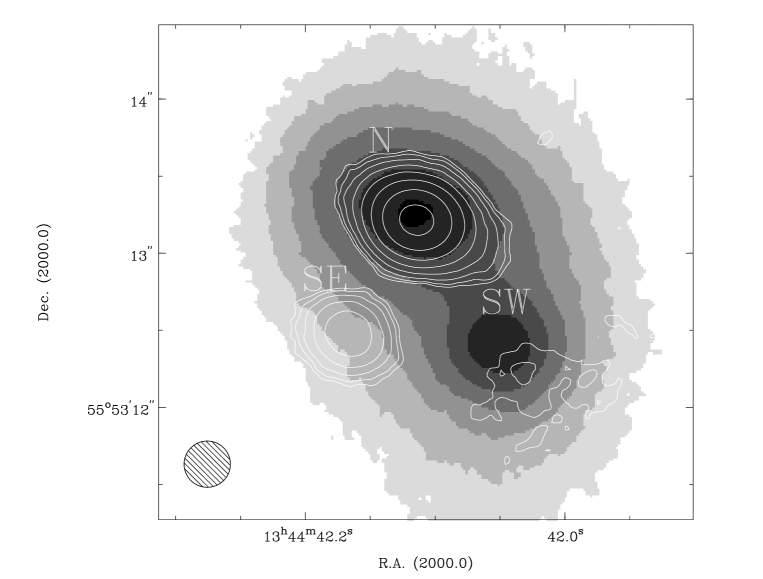
The 8.44 GHz (3.6 cm) VLA radio image has been published by Condon et al. (1991), and was obtained from the NED database. The size of the restoring beam is 300 mas. The axis defined by components N and SW (see below)in the image coincides with that in the 8.4 GHz map. We translated the NIR image so that its main peak coincides with the radio component N. We show the 5 GHz radio map overlaid on the image in Fig. 2.
3 Central morphology of Mrk 273
On scales of 5–10 arcseconds ( kpc), the optical morphology is complicated by prominent dust lanes, and several distinct regions of strong emission, the two most prominent of which (along a north-southwest line) are separated by arcsec (Fig. 1). The relatively low astrometric precision of HST ( arcsec) precludes accurate registration with our other data sets. Nor is it possible to accurately match strong features in the optical and NIR, probably because the optical data are much more severely confused by patchy dust extinction.
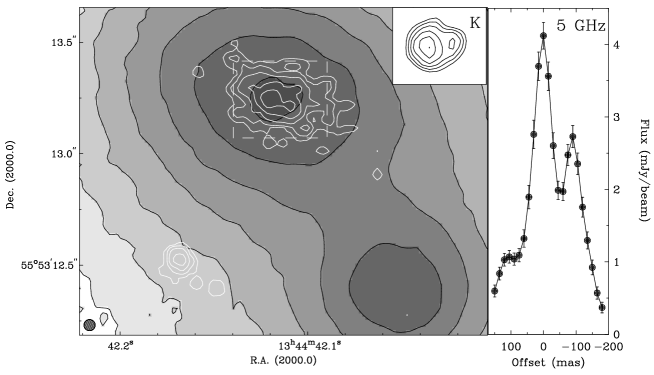
The morphology of the central kpc region of Mrk 273 is shown in Fig. 2. The three dominant sources of emission have been labeled N (north), SE (southeast), and SW. Component N is the brightest radio and NIR peak. It is surrounded by an elongated structure whose extent, position angle, and ellipticity are very similar in NIR and radio (Fig. 2). At 50 mas resolution (5 GHz, Fig. 3), the outer fringes of component N are resolved into several localized sources of emission.
At 50 mas resolution at 5 GHz, the center of component N is resolved into two peaks, which we call Ne (east) and Nw (west) (Fig. 3). These “twin peaks” are separated by mas (70 pc) spatially (Fig. 3, right). The signal to noise ratio of the twin peaks gives a positional accuracy of a few mas, so they are a robust detection. The image also shows a double-peaked feature (inset in Fig. 3), at the same position but with a slightly different () position angle. This double -peak has been confirmed in a Keck image (E.Ye. Khachikian, private communication).
Component SE is a strong radio continuum source (Condon et al. 1991). We detect it clearly in our two independent MERLIN data sets, but it has no counterpart in NIR or optical images (Figs. 1, 2, 3). We do not confirm the tentative detection at 2.2 m by Majewski et al. (1993). Fig. 3 shows that at 50 mas resolution component SE is resolved into a strong, peaked, component with two separate regions of emission at 4 level. Component SW is the second strong NIR source, almost 1 arcsec (700 pc) southwest of the main emission region, N. It may have a counterpart in the optical image, possibly distorted or displaced due to the effects of dust extinction, but the astrometry of the optical image is not accurate enough to confirm this. Component SW is extended and relatively weak in both the 5 GHz (Fig. 2) and 8.4 GHz maps (Fig. 1 of Condon et al. 1991).
4 Fluxes and spectral indices
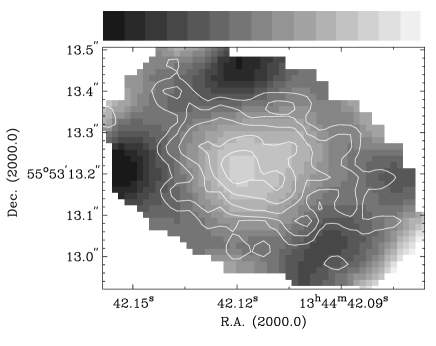
Peak and integrated radio fluxes for the different components are shown in Table 1, and radio positions and -band magnitudes and luminosities in Table 2. We have determined spectral indices from our combined radio continuum images, and confirmed these with direct derivations from the peak fluxes. Comparing the 1.6 and 5 GHz images, both at 150 mas resolution, gives a spectral index (; ) for the twin peaks area in component N of (Ne and Nw are not resolved at 150 mas). The surrounding emission has a significantly different spectral index of 0.7 0.1 (Fig. 4). The radio spectral index of component SE is 1.0 0.2. The diffuse radio emission detected at 1.6, 5 and 8.4 GHz for component SW has a spectral index of . The flat spectrum in the twin peaks region in component N suggests that it may be the compact synchrotron core of a Seyfert radio source. This is consistent with N being the strongest radio and NIR component.
A flat spectrum would also be expected if the radio emission is dominated by nebular free-free emission, the strongest source of which is likely to be the Seyfert narrow line region. Taking the H flux measured by Koski (1978) and correcting it for the extinction ( mag) inferred from the Balmer decrement, we estimate that for a typical nebular temperature of K, the free-free continuum emitted by the narrow line region can contribute at most 1% of the measured 5 GHz flux density of component N. If a dusty molecular torus is present (as we suggest in Section 5), another possibility is that some fraction of the observed radio flux is due to free-free continuum emission from a hidden emission line region. However, it is unlikely that all of the radio emission from component N can be explained in this way, since the corresponding H luminosity ( erg s-1) would suggest a quasar broad-line region and such a source would be unresolved at the spatial resolution of our radio maps.
The spectral index of the emission surrounding the twin peaks is significantly steeper (Fig. 4). Given the morphology of this region, the radio emission may trace supernova remnants in regions of star formation around the AGN, at a radius of a few hundred pc.
The origin of both components SE and SW is unclear. SE was interpreted by Condon et al. (1991) as the nucleus of a merging galaxy. However, given the absence of an NIR or optical counterpart and its negative spectral index, which suggests optically thin synchrotron emission, component SE may well be a background source, presumably a distant radio galaxy.
The flat spectrum and diffuse morphology of the relatively weak radio source corresponding to component SW suggests optically thin free-free emission. The integrated 8.44 GHz flux density would then imply an H flux comparable with that measured by Koski (1978). It is plausible, therefore, that component SW is the site of a starburst triggered by the merger, with the observed radio flux arising as free-free emission from the associated H ii regions. One might then expect the emission line spectrum to exhibit a mixture of Seyfert and starburst characteristics, but the HST image (Fig. 1) suggests that component SW is at least partially obscured and hence line emission from the starburst may suffer heavy extinction. Indeed, while there is little evidence for spectral features related to star formation in the optical spectrum, such features do become apparent in the NIR (Goldader et al. 1995).
5 Discussion and summary
We have combined state-of-the-art radio, NIR and optical imaging observations, all at resolutions of around 150 mas, to study the nuclear region of the ULIRG Mrk 273. Our images have revealed three main radio components, two of which, N and SW, have bright NIR counterparts. Small-scale ( mas) structure is also present in component N and, possibly, SE. Mrk 273 has a double nucleus which is detected at both NIR and radio wavelengths and whose components (N and SW) are separated by arcsec, supporting the hypothesis that this system formed in a recent merger. Condon et al. (1991) reached a similar conclusion on the basis of their radio data, but identified radio components N and SE as the double nucleus. The lack of a NIR counterpart to component SE, however, suggests that it is in fact a background source unrelated to Mrk 273.
Component N is probably the site of the active galactic nucleus which produces the Seyfert 2 emission line spectrum: it is the brightest source at both radio and IR wavelengths, and the radio continuum, which has a flat spectral index consistent with a compact synchrotron source, is too strong to be attributed to nebular free-free emission. At a resolution of 50 mas, the radio source within component N resolves into a twin-peaked structure whose “lobes” are separated by mas ( pc). A similar double structure is detected in our -band image. The two peaks Ne and Nw could represent distinct merger remnants each harbouring a compact synchroton radio source. magnitudes for components N and SW, and even Ne and Nw (Table 2), are consistent with those of bright galactic nuclei (e.g., Forbes et al. 1992). However, we suggest the alternative interpretation that the double NIR structure is actually an artifact of obscuration by an edge-on dusty molecular torus. The corresponding radio structure can then be explained as a compact double-lobed radio source similar to those present in other Seyfert galaxies, which is fed by synchrotron-emitting plasma ejected from the (hidden) active nucleus. The presence and orientation of the torus should be confirmed by forthcoming MERLIN observations of the OH megamaser emission associated with Mrk 273.
The radio flux from component SW is relatively weak and can plausibly be attributed to nebular free-free emission. This leads us to propose that component SW harbors a heavily obscured starburst which may have been triggered by the merger.
Acknowledgements.
We thank Drs P. Thomasson, T.W.B. Muxlow and S.T. Garrington for assistance with the MERLIN observations, Dr. E.Ye. Khachikian for helpful discussions, and Drs. K. Weiler and P.D. Barthel for comments on an earlier version of the manuscript. MERLIN is operated by the University of Manchester on behalf of PPARC. JHK and AR thank the British Council, NWO and the Royal Society for financial support. The CFHT is operated by the NRC of Canada, the CNRS de France, and the University of Hawaii. The NASA/IPAC Extragalactic Database (NED) is operated by JPL, CalTech, under contract with NASA. Partly based on observations made with the NASA/ESA HST, obtained from the data archive at STScI. STScI is operated by AURA, Inc. under NASA contract NAS 5-26555.References
- [1]
- [2] Condon, J.J., Huang, Z.-P., Yin, Q.F., Thuan, T.X. 1991, ApJ 378, 65
- [3]
- [4] Forbes, D. A., Ward, M. J., DePoy, D. L., Boisson, C., Smith, M. S. 1992, MNRAS 254, 509
- [5]
- [6] Goldader, J.D., Joseph, R.D., Doyon, R., Sanders, D. B. 1995, ApJ 444, 97
- [7]
- [8] Joseph, R.D., Wright, G.S., 1985, MNRAS 214, 87
- [9]
- [10] Koroviakovskii, Y.P., Petrosian, A.R., Saakian, K.A, Khachikian, E.Ye. 1981, Astrofizika 17, 231
- [11]
- [12] Koski, A.T. 1978, ApJ 223, 56
- [13]
- [14] Majewski, S.R., Hereld, M., Koo, D.C., Illingworth, G.D., Heckman, T.M. 1993, ApJ 402, 125
- [15]
- [16] Mazzarella, J.M., Boroson, T.A. 1993, ApJS 85, 27
- [17]
- [18] Melnick, J., Mirabel, I.F. 1990, A&A 231, L19
- [19]
- [20] Nadeau, D., Murphy, D.C., Doyon, R. & Rowlands, N. 1994, PASP, 106, 909
- [21]
- [22] Rigaut, F., et al. 1997a, PASP, submitted
- [23]
- [24] Rigaut, F., Doyon, R., Davidge, T., Crampton, D., Rouan, D., & Nadeau, D. 1997b, Submitted to ApJ Letters
- [25]
- [26] Sanders, D.B., Soifer, B.T., Elias, J.H., Madore, B.F., Matthews, K., Neugebauer, G., Scoville, N.Z. 1988, ApJ 325, 74
- [27]
- [28] Sanders, D.B., Scoville, N.Z., Soifer, B.T. 1991, ApJ 370, 158
- [29]
- [30] Solomon, P.M., Downes, D., Radford, S.J.E., Barrett, J.W. 1997, ApJ 478, 144
- [31]
- [32] Toomre, A. & Toomre, J. 1972, ApJ 178, 623
- [33]