Magnetic field strengths in the hot spots of 3C 33 and 3C 111
Abstract
We report on ROSAT HRI observations of the nearby powerful radio galaxies 3C 33 and 3C 111, which both have detected optical hot spots. We find nuclear X-ray sources in both objects, but no X-ray emission from the hot spots. This confirms the presence of a high-energy cutoff in the spectrum of synchrotron-emitting electrons. Since these electrons necessarily scatter the synchrotron photons by the inverse-Compton process, our upper limits on the X-ray fluxes of the hot spots allow us to set lower limits of a few nanotesla on their magnetic flux density, close to or greater than the fields implied by equipartition of energy between radiating particles and magnetic field.
keywords:
galaxies: individual: 3C 33, 3C 111 – X-rays: galaxies1 Introduction
Few good methods exist of measuring the magnetic fields in the extended components of extragalactic radio sources. Discussion of the energetics and dynamics of radio sources is often based on the assumption that there is equipartition of energy between magnetic fields and energetic particles (or, effectively equivalently, that the total energy has the minimum value consistent with the production of the observed synchrotron radiation) but it has seldom been possible to test this, and there is no strong a priori reason why it should be true (e.g. Leahy 1990). X-ray observations of radio hot spots provide one good way of making a relatively model-independent measurement of the magnetic field, but such a measurement has only been performed in one source, Cygnus A (Harris, Carilli & Perley 1994) so far. In this paper we discuss deep observations with the ROSAT HRI of two further radio galaxies. These objects have optically detected hot spots, and so are ideal targets for investigation of the magnetic field.
Radio sources with optical hot spots are of particular interest in the X-ray, because the hot spot electron energy spectrum is well constrained if it is assumed that the optical emission is synchrotron radiation from the population of electrons responsible for the radio emission. Meisenheimer et al. (1989) have analysed the radio-to-optical spectra of a number of these sources. With the exception of Pictor A, all the sources they study show a spectral turnoff in or around the optical regime, corresponding in a simple synchrotron model to an upper energy cutoff of eV. The subjects of this paper, 3C 33 and 3C 111, are both sources with optical hot spots discussed in Meisenheimer et al. (1989). The radio-optical synchrotron spectrum in these objects is therefore well known.
A variety of possible mechanisms exists for X-ray emission from radio hot spots. Synchrotron emission in the X-ray is possible, and has been suggested as an explanation for the X-ray emission from the jet of M87 (Biretta, Stern & Harris 1991) and from the hot spot of 3C 390.3 (Prieto 1997). However, objects with high-frequency cutoffs in the optical, as inferred by Meisenheimer et al. for 3C 33 and 3C 111, are unlikely based on spectral extrapolation to emit significant synchrotron radiation at X-ray frequencies. Recently ROSAT data (Harris et al. 1994) have been used to show that the hot spots of Cygnus A, undetected at optical wavelengths, radiate significantly in the X-ray. The X-ray flux is well above that predicted by a purely synchrotron model, given the inferred high-energy cutoff in the electron spectrum, and Harris et al. interpret this as evidence that hot spots emit X-rays by a synchrotron self-Compton process (SSC: inverse Compton up-scattering of the synchrotron photons by the energetic electrons), although more exotic emission mechanisms such as a proton-induced cascade (PIC; Mannheim, Biermann & Kruells 1991) are not ruled out by the observations. In addition, inverse-Compton scattering of photons from the cosmic background radiation (CBR) and from the radiation generated by the host galaxy and the central engine is an obligatory process.
Because the emissivity from any inverse-Compton process depends upon the number density of electrons, it is possible to use observations of this process to constrain the magnetic field in the scattering regions, provided the synchrotron spectrum and geometry are well known. This allows us to test the equipartition assumption. The observations of Harris et al. (1994) were consistent with equipartition, but it is important to test whether this applies to radio sources in general. The high resolution and sensitivity of ROSAT makes it the first X-ray observatory likely to detect and distinguish inverse-Compton emission from hot spots.
3C 33 and 3C 111 are both FRII (Fanaroff & Riley 1974) radio galaxies. Their redshifts and radio properties are summarized in Table 1. Both are well studied in the radio (for 3C 33 see Dreher 1981, Rudnick 1988, 1989, Rudnick & Anderson 1990, Leahy & Perley 1991: for 3C 111 see Leahy & Williams 1984, Linfield & Perley 1984, Leahy et al. 1997). The southern hot spot of 3C 33 (Meisenheimer & Röser 1986; Meisenheimer et al. 1989; Crane & Stiavelli 1992) and the northern hot spot of 3C 111 (Meisenheimer et al. 1989) are optical synchrotron sources. 3C 33 is a narrow-line radio galaxy, while 3C 111 is a broad-line object often classed as a Seyfert 1. Both appear isolated on optical sky-survey plates.
km s-1 Mpc-1 and are assumed throughout the paper.
2 The data
2.1 3C33
3C 33 was observed with the ROSAT HRI for a total of 51.9 ks between 1996 January 16 and 22. We analysed the data using the Post Reduction Off-line Software (PROS), filtering out time intervals with a ‘maximum high background’ level of counts pixel-1 s-1 so as to maximise our chances of detecting faint components. This process left us with 47.7 ks of good data.
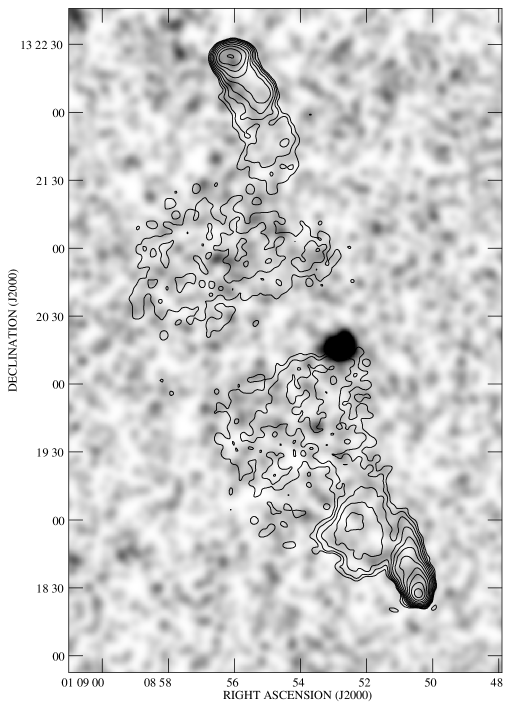
Fig. 1 shows an overlay of the radio contours of Leahy & Perley (1991) on a smoothed X-ray image. An X-ray source is detected at a J2000.0 position of 01 08 52.7 +13 20 15.8, roughly 3 arcsec from the radio core position on the radio map. We identify this with emission from the nuclear regions or the host galaxy of 3C 33, since misalignments of up to 10 arcsec are expected with the absolute position errors of ROSAT. Measuring the counts in a circle of radius 1 arcmin about the centroid and taking background measurements from a concentric annulus between 1 and 2 arcmin, we find a count rate for this source of counts s-1, corresponding to a total of counts. The equivalent Einstein IPC count rate would be counts s-1, assuming a power-law spectrum with photon index 1.8 and galactic absorption. This is consistent with the upper limit of counts s-1 found by Fabbiano et al. (1984) using the IPC.
Radial profile fitting in the region described above, using 7 logarithmically spaced bins, suggests that it is reasonably well modelled as a point source with little or no extended structure. Following Birkinshaw & Worrall (1993), we obtain a model-independent upper limit on the source size by fitting the radial profile with a broadened PSF; the best-fit FWHM for the source is then 6 arcsec and we find an upper limit on the FWHM of 9 arcsec at the 99 per cent confidence level. As errors in the ROSAT aspect solution can introduce spurious extension of up to about 10 arcsec (e.g. Morse 1994), these results are consistent with the source being unresolved. The upper limit then implies with a high degree of confidence that the X-ray emission comes from a region less than 14 kpc in size.
The lack of spectral information on this component introduces an uncertainty in the determination of luminosity; further, if it is emission from regions near to the AGN it may be obscured (cf. Allen & Fabian 1992), since 3C33 is a narrow-line object, leading us to underestimate its true luminosity. With only galactic absorption ( cm-2, Stark et al. 1992) the 0.1–2.4 keV luminosity of the component is ergs s-1, if a power-law spectrum with photon index 1.8 is assumed. If the intrinsic absorbing column were comparable to that inferred for the power-law component of Cygnus A ( cm-2; Arnaud et al. 1987, Ueno et al. 1994) then the true luminosity would be ergs s-1, which would be extraordinarily high for an object of this moderate radio power.
No emission is detected in the region corresponding to the radio hot spot. The background per ( arcsec2) detection cell, estimated from an annulus between radii of 125 and 175 arcsec around the central source, is counts sec-1; if Poisson statistics apply, a detection (i.e. one with a probability per cent of occurring by chance) would be counts, or counts s-1. We may take this rate as an upper limit on the X-ray emission from the undetected hot spot. The detection cell size is chosen so that 50 per cent of the source photons fall within a cell given the instrument PSF; we therefore multiply this rate by 2 to get the total limiting count rate from the undetected component. Assuming a power law spectrum for the emission with energy spectral index 0.5, similar to that seen in the radio, and galactic absorption, we calculate (using pimms) that this corresponds to a 1-keV flux density upper limit of approximately 1.6 nJy. This limit is relatively insensitive to spectral assumptions, since 1 keV is close to the central energy of the HRI bandpass. In Fig. 3 we plot this limit together with the measured optical and radio flux densities of the hot spot, taken from Meisenheimer et al. (1989). (We use their decomposition of the hot spot radio flux into contributions from an extended and a compact component.) It will be seen that the X-ray upper limit lies well below any straight-line extrapolation of the radio or radio-to-optical spectrum.
2.2 3C111
3C 111 was observed with the HRI for a total of 12.9 ks between 1996 September 15 and 17. The data were reduced in a similar way to those from 3C 33, and after high-background time filtering there were 10.5 ks of good data.
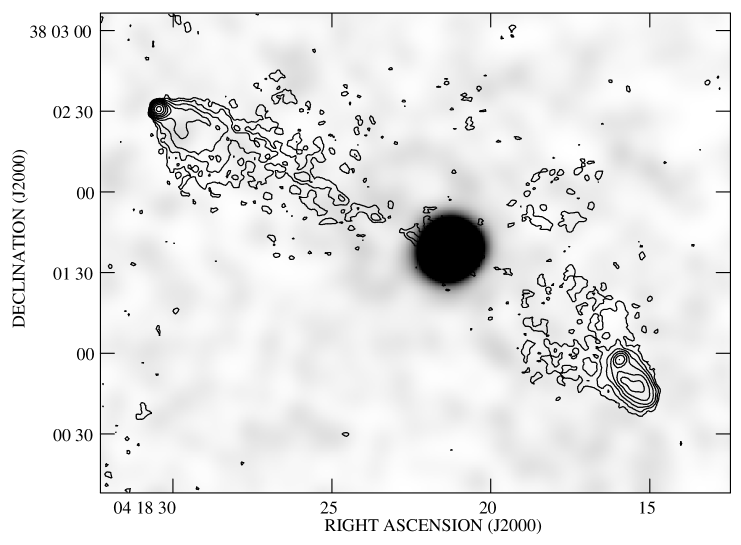
Fig. 2 shows an overlay of the radio contours of Leahy et al. (1997) on the X-ray image. A strong source was detected at a J2000 position of 04 18 21.3 +38 01 38.5, approximately 2.5 arcsec away from the radio core position of Linfield & Perley (1984). Using source and background regions identical in size to those used for 3C 33, the count rate for the source is s-1, or counts in total. When a broadened PSF is fitted to the radial profile from 13 logarithmically spaced bins, as described above, the best-fit FWHM is 4 arcsec and the 99 per cent upper limit on the FWHM is 6 arcsec. The fit in this case is poorer than for 3C 33, suggesting either that some real extension is present or that the aspect-error extension is poorly modelled by a simple broadened PSF. Nevertheless we can be confident that most of the emission comes from a region less than 8 kpc in size.
3C 111 has been observed in the X-ray with a number of other instruments. It was detected with EXOSAT (Turner & Pounds 1991), with the Einstein IPC (Wilkes et al. 1994), with Ginga (Nandra & Pounds 1994) and with the Einstein SSS and HEAO-1 (Turner et al. 1991). Spectral fits from the literature are tabulated by Malaguti, Bassani & Caroli (1994). There are two ROSAT PSPC observations in the public archive, one of 0.89 ks taken on 1991 Mar 08 and one of 2.32 ks taken on 1993 Feb 13.
The X-ray spectrum of the source appears to be strongly variable, with both absorbing columns and photon indices being inconsistent at different epoch and with different instruments (e.g. Turner et al. 1991). In an attempt to provide a recent soft X-ray measurement, we used PROS to fit power-law models to the later of the archival PSPC datasets. Allowing energy index and intrinsic to vary independently, we find a best-fit cm-2, where the errors are for two interesting parameters; the power-law photon index is poorly constrained by the data, with a best-fit . These fits are consistent with galactic absorption (galactic cm-2, Elvis et al. 1989). The photon index is lower than, though not inconsistent with, soft X-ray indices from the Einstein IPC observations taken in 1980 ().
The broad-band (0.1-2.4 keV) count rates derived from the earlier and later PSPC observations are and counts s-1, which are significantly inconsistent with one another. Using the best-fit spectral models, the later PSPC observation would imply a count rate with the HRI of 0.15 counts s-1, approximately twice the count rate we derive from the present HRI data. Because of the very similar spectral responses of the HRI and PSPC, this result is only weakly affected by spectral assumptions; the ROSAT observations thus show that luminosity in the soft X-ray band varies by about a factor of two on timescales of two years. The radio core is also variable, with changes of per cent in a few months (Leahy et al. 1997).
The later PSPC observation implies an 0.1–2.4 keV luminosity of ergs s-1 for 3C 111, roughly 50 times larger than the luminosity of 3C 33 if the X-rays from that object are not seen through a large intrinsic column density. The sources are very similar in their large-scale radio properties, but 3C 111 is a broad-line and 3C 33 a narrow-line radio galaxy. In unified models for radio sources, broad-line objects are expected both to suffer less from obscuration and to have any relativistically moving component enhanced by beaming. 3C 111 is 50 times more luminous in the soft X-ray, and the ratio of radio core luminosities in the two sources is also approximately 50. Given that the radio core emission is expected to originate outside the region of strong absorption, and that the PSPC spectrum of 3C 111 is consistent with galactic absorption, this might be taken as an indication that the soft X-ray emission in these sources is dominated by a component directly related to the radio emission, for example by the SSC process. However, the high and apparently variable absorption measured in the hard X-ray band for 3C 111 indicates that this is not the whole story. A combination of a soft unabsorbed component and a hard absorbed component, both variable, may be needed to explain the broad-band X-ray spectral properties of the source.
Again, no emission is detected from the region corresponding to the radio hot spot; the background per detection cell, using the same annulus, is counts s-1, giving an upper limit of 2 counts in the cell over the time interval. This corresponds to a flux upper limit of 3.2 nJy. In Fig. 3 we plot this limit together with the radio and optical flux densities from Meisenheimer et al. (1989).
3 Discussion
The fact that the upper limits on hot spot X-ray flux density fall below any plausible straight-line extrapolation of the radio (or radio-to-optical) spectrum gives us an independent reason for confidence in the energy cutoffs in the electron spectrum inferred by Meisenheimer et al. (1989). If synchrotron emission is insignificant at X-ray frequencies, we may use the upper limits obtained as a constraint on the flux from inverse-Compton scattering. The hot spots may be modelled as isotropic spheres (errors arising from the assumption of this simple geometry are of order unity) with a volume equal to that quoted by Meisenheimer et al.. The radio-to-optical synchrotron spectra are best fitted by a power-law electron energy spectrum with a high-energy spectral break ( proportional to below and to afterwards); we consider this energy spectrum as being bounded by low and high energy rather than frequency cutoffs (e.g. Myers & Spangler 1985). Input and fitted parameters are listed in Table 2; with a broken spectrum, the dependence of the results on the high energy cutoff () is negligible. With a minimum electron energy given by , with , we find best-fit equipartition magnetic fields (with no protons) of = 30 nT for 3C 33 and 21 nT for 3C 111.
Once the -field is known we may use the simple analysis of Rybicki & Lightman (1979), chapter 7, to calculate the expected flux in X-rays from the SSC process and from inverse-Compton scattering of other photon sources, using the relationship of Band & Grindlay (1985) between the emissivity and the average photon number density in an isotropic sphere. The effects of multiple scatterings and of the high-energy (Klein-Nishina) corrections to the Thomson cross-section can both be neglected in the energy and density regime of interest. The synchrotron-self-Compton emissivity at a given frequency (, in W Hz-1 m-3) is then given by
where is the electron mass, is the speed of light, is the Thomson cross-section, is the radius of the sphere, is the number density of electrons as a function of electron energy, is the synchrotron emissivity as a function of frequency, and is a function of , and defined by Rybicki & Lightman. The integration can then be performed numerically for an arbitrary electron energy spectrum.
The results of these calculation are plotted in Fig. 3. It will be seen that the X-ray upper limits lie more than an order of magnitude above the predicted SSC flux at equipartition, with the contribution from inverse-Compton scattering of the CBR being much smaller. At distances of hundreds of kpc from the nucleus, the energy density in photons originating at an AGN with bolometric power W is expected to be smaller than that in the CBR, and so we ignore the contribution to inverse-Compton flux from this source.111Brunetti, Setti & Comastri (1997) discuss the possibility that inverse-Compton scattering from the lobes contributes significantly to the X-ray fluxes of distant powerful radio galaxies. In the objects considered here, we see no evidence for the extended X-ray emission that would be produced by this process. However, the electron densities, and possibly also the hidden quasar luminosities, are lower in our objects.
The flux expected from the SSC process depends on the number density of electrons, so variations in the volume of the hot spot or in the magnetic field (given that a fixed emissivity must be produced to fit the observed radio spectrum) cause it to change; we can use this to investigate the physical conditions in the hot spot. The results are insensitive to the precise position of the electron energy break or to the upper energy cutoff. The dependence on the volume of the hot spot is also weak, but it allows us to rule out radii for the hot spots of less than a few parsecs if equipartition holds; these are of course much less than the sizes implied by radio imaging. More interesting are the constraints on magnetic field strength; with the hot spot volume as given by Meisenheimer et al. (1989), the magnetic field in the hot spot of 3C 33 cannot be less than about 4 nT, or about 7 times weaker than equipartition, with . The relationships between the limiting -field value, and for the two sources are shown graphically in Fig. 4. It will be seen that a high weakens the constraints on . is only weakly constrained () by the observations in the cases considered here, but the spectral shape of the hot spots in Cygnus A led Carilli et al. (1991) to suggest in that object.
If there is a significant contribution from relativistic protons (expressed as a ratio of energy density in non-radiating particles to energy density in radiating particles) or a plasma filling factor less than unity, the predicted SSC flux falls, since the -field increases to maintain equipartition with the increased energy density in relativistic particles and the number density of electrons must fall to maintain the synchrotron emissivity at the correct level. Thus with () our fitted equipartition field in the hot spot () is 59 nT, and the SSC flux is nearly two orders of magnitude below the X-ray limit. In principle, therefore, observations which measure SSC emission would allow us to distinguish between models with different values of the parameter , if some independent estimator of the magnetic field were available. Large or small allow the sources to be further out of equipartition without violating the constraints from X-ray observations.
4 Conclusions
The ROSAT HRI has detected a weak X-ray source coincident with the radio core of 3C 33, and has made a good soft-X-ray measurement of the nuclear X-ray source of 3C 111. The relative powers of the two sources are in agreement with the trend seen in other work (e.g. Siebert et al. 1996) for narrow-line radio galaxies to be much fainter in soft X-ray than their broad-line counterparts. Comparison with earlier data provides further evidence for X-ray variability in the core of 3C 111. The soft X-ray emission in both sources can plausibly be associated with unabsorbed emission from the radio cores.
The hot spots of both sources are undetected in the X-ray. This allows us to rule out any plausible extension of the synchrotron spectrum to this high frequency, which differs from the synchrotron explanation proposed for 3C 390.3 and for the jets in M87 and 3C 273. Because SSC emission from the hot spots is inevitable, the magnetic fields in the hot spots cannot be more than an order of magnitude less than equipartition for , .
X-ray detections of SSC emission from hot spots would allow a relatively model-independent measurement of the magnetic field. The ROSAT HRI is not an ideal instrument for this purpose, as its PSF smears out the flux from compact objects such as hot spots. AXAF should allow the detection of SSC emission from the hot spots of radio sources such as those described here.
ACKNOWLEDGEMENTS
We are grateful to Paddy Leahy for providing the radio image of 3C 33 and to Dan Harris for discussions. We thank an anonymous referee for a number of comments that enabled us to improve the clarity of the paper. This research has made use of the NASA/IPAC Extragalactic Database (NED) which is operated by the Jet Propulsion Laboratory, California Institute of Technology, under contract with the National Aeronautics and Space Administration. Support from PPARC grant GR/K98582 and NASA grant NAG 5-2312 is gratefully acknowledged.
References
- [] Allen S.W., Fabian A.C., 1992, MNRAS, 258, 29P
- [] Arnaud K.A., Johnstone R.M., Fabian A.C., Crawford C.S., Nulsen P.E.J., Shafer R.A., Mushotzky R.F., 1987, MNRAS, 227, 241
- [] Band D.L., Grindlay J.E., 1985, ApJ, 298, 128
- [] Biretta J.A., Stern C.P., Harris D.E., 1991, AJ, 101, 1632
- [] Birkinshaw M., Worrall D.M., 1993, ApJ, 412, 568
- [] Brunetti G., Setti G., Comastri A., 1997, A&A, preprint, astro-ph/9704162
- [] Crane P., Stiavelli M., 1992, MNRAS, 257, 17P
- [] Dreher J.W., 1981, AJ, 86, 833
- [] Elvis M., Lockman F.J., Wilkes B.J., 1989, AJ, 97, 777
- [] Fabbiano G., Miller L., Trinchieri G., Longair M., Elvis M., 1984, ApJ, 277, 115
- [] Fanaroff B.L., Riley J.M., 1974, MNRAS, 167, 31P
- [] Harris D.E., Carilli C.L., Perley R.A., 1994, Nat, 367, 713
- [] Leahy J.P., 1990, in Zensus J.A., Pearson T.J., eds, Parsec-scale Radio Jets. Cambridge University Press, Cambridge, p. 174
- [] Leahy J.P., Black A.R.S., Dennett-Thorpe J., Hardcastle M.J., Komissarov S., Perley R.A., Riley J.M., Scheuer P.A.G., 1997, MNRAS, in press,
- [] Leahy J.P., Perley R.A., 1991, AJ, 102, 527
- [] Leahy J.P., Williams A.G., 1984, MNRAS, 210, 929
- [] Linfield R., Perley R., 1984, ApJ, 279, 60
- [] Malaguti G., Bassani L., Caroli E., 1994, ApJS, 94, 517
- [] Mannheim K., Biermann P.L., Kruells P.L., 1991, A&A, 251, 723
- [] Meisenheimer K., Röser H.-.J., 1986, Nat, 319, 459
- [] Meisenheimer K., Röser H.-.J., Hiltner P.R., Yates M.G., Longair M.S., Chini R., Perley R.A., 1989, A&A, 219, 63
- [] Morse J.A., 1994, PASP, 106, 675
- [] Myers S.T., Spangler S.R., 1985, ApJ, 291, 52
- [] Nandra K., Pounds K.A., 1994, MNRAS, 268, 405
- [] Prieto M.A., 1997, MNRAS, 284, 627
- [] Rudnick L., 1988, ApJ, 325, 189
- [] Rudnick L., 1989, in Meisenheimer K., Röser H.-J., eds, Hotspots in Extragalactic Radio Sources. Springer-Verlag, Heidelberg
- [] Rudnick L., Anderson M., 1990, ApJ, 355, 427
- [] Rybicki G.B., Lightman A.P., 1979, Radiative Processes in Astrophysics, Wiley, New York
- [] Siebert J., Brinkmann W., Morganti R., Tadhunter C.N., Danziger I.J., Fosbury R.A.E., Alighieri S.D., 1996, MNRAS, 279, 1331
- [] Spinrad H., Djorgovski S., Marr J., Aguilar L., 1985, PASP, 97, 932
- [] Stark A.A., Gammie C.F., Wilson R.W., Bally J., Linke R.A., Heiles C., Hurwitz M., 1992, ApJS, 79, 77
- [] Turner T.J., Pounds K.A., 1989, MNRAS, 240, 833
- [] Turner T.J., Weaver K.A., Mushotzky R.F., Holt S.S., Madejski G.M., 1991, ApJ, 381, 85
- [] Ueno S., Koyama K., Nishida M., Yamauchi S., Ward M.J., 1994, ApJ, 431, L1
- [] Wilkes B.J., Tananbaum H., Worrall D.M., Avni Y., Oey M.S., Flanagan J., 1994, ApJS, 92, 53
| Source | 178-MHz luminosity | Total radio extent | |
|---|---|---|---|
| (W Hz-1 sr-1) | (kpc) | ||
| 3C 33 | 0.0595 | 400 | |
| 3C 111 | 0.0485 | 280 |
Redshifts and radio fluxes are taken from Spinrad et al. (1985).
| Hot spot | Adopted radius | Low-energy electron | Fitted | Predicted SSC flux | Observed 1-keV flux | ||
|---|---|---|---|---|---|---|---|
| (kpc) | power law index () | (nT) | (GeV) | (GeV) | density (nJy) | density (nJy) | |
| 3C 33 S | 0.27 | 2.18 | 30 | 220 | 28 | 0.059 | |
| 3C 111 N | 0.37 | 2.10 | 21 | 210 | 44 | 0.041 |