Figure 1:
Initial entropy and electron fraction profiles of the
25 , 25 “low–test”,
and 15 simulations.Figure 2a:
Plot of density and entropy versus radius,
comparing a simulation with one-dimensional
PPM hydrodynamics and MGFLD neutrino transport
(simulation B) to a
simulation with one-dimensional Lagrangian hydrodynamics and
MGFLD neutrino transport. The comparison is made 62
ms into the run.Figure 2b:
Plot of electron fraction and radial velocity vs. radius
for the same comparison shown in Figure 2a.Figure 2c:
Plots of the density and entropy profiles at ms,
for three different radial grid resolutions in our one-dimensional
PPM simulations.Figure 2d:
Plots of the electron fraction and radial velocity profiles at
ms, for three different radial grid resolutions in
our one-dimensional PPM simulations.Figure 3b:
Plots of the angle-averaged radial and angular convection velocities
corresponding to the three entropy snapshots in Figure 3a.Figure 3c:
Plots showing the angle-averaged entropy and
electron fraction corresponding to the three
entropy snapshots in Figure 3a.Figure 4b:
Plots of the angle-averaged radial and angular convection velocities
corresponding to the three entropy snapshots in Figure 4a.Figure 4c:
Plots showing the angle-averaged entropy and electron
fraction corresponding to the three entropy snapshots
in Figure 4a.Figure 4d:
Plot of the angle-averaged radial velocities in the innermost
region of the two-dimensional grid for our “fiducial” 25
and 15 simulations (D
and L).Figure 5b:
Plots of the angle-averaged radial and angular convection
velocities corresponding to the three entropy snapshots in
Figure 5a.Figure 5c:
Plots showing the angle-averaged entropy and
electron fraction corresponding to the three
entropy snapshots in Figure 5a.Figure 6b:
Plots of the angle-averaged radial and angular convection
velocities corresponding to the three entropy snapshots in
Figure 6a.Figure 6c:
Plots showing the angle-averaged entropy and electron
fraction corresponding to the three entropy snapshots in
Figure 6a.Figure 7b:
Plots of the angle-averaged radial and angular convection
velocities corresponding to the three entropy snapshots in
Figure 7a.Figure 7c:
Plots showing the angle-averaged entropy and
electron fraction corresponding to the three
entropy snapshots in Figure 7a.Figure 8b:
Plots of the angle-averaged radial and angular convection
velocities corresponding to the three entropy snapshots in
Figure 8a.Figure 8c:
Plots showing the angle-averaged entropy and
electron fraction corresponding to the three
entropy snapshots in Figure 8a.Figure 10b:
Plots of the angle-averaged radial and angular convection
velocities corresponding to the three entropy snapshots in
Figure 10a.Figure 10c:
Plots showing the angle-averaged entropy and
electron fraction corresponding to the three
entropy snapshots in Figure 10a.Figure 11b:
Plots of the angle-averaged radial and angular convection
velocities corresponding to the three entropy snapshots in
Figure 11a.Figure 11c:
Plots showing the angle-averaged entropy and
electron fraction corresponding to the three
entropy snapshots in Figure 11a.Figure 12:
Plots showing the entropy and lepton-fraction equilibration time
scales, and the convection (Brunt–Väisälä) time scales,
as a function of density.
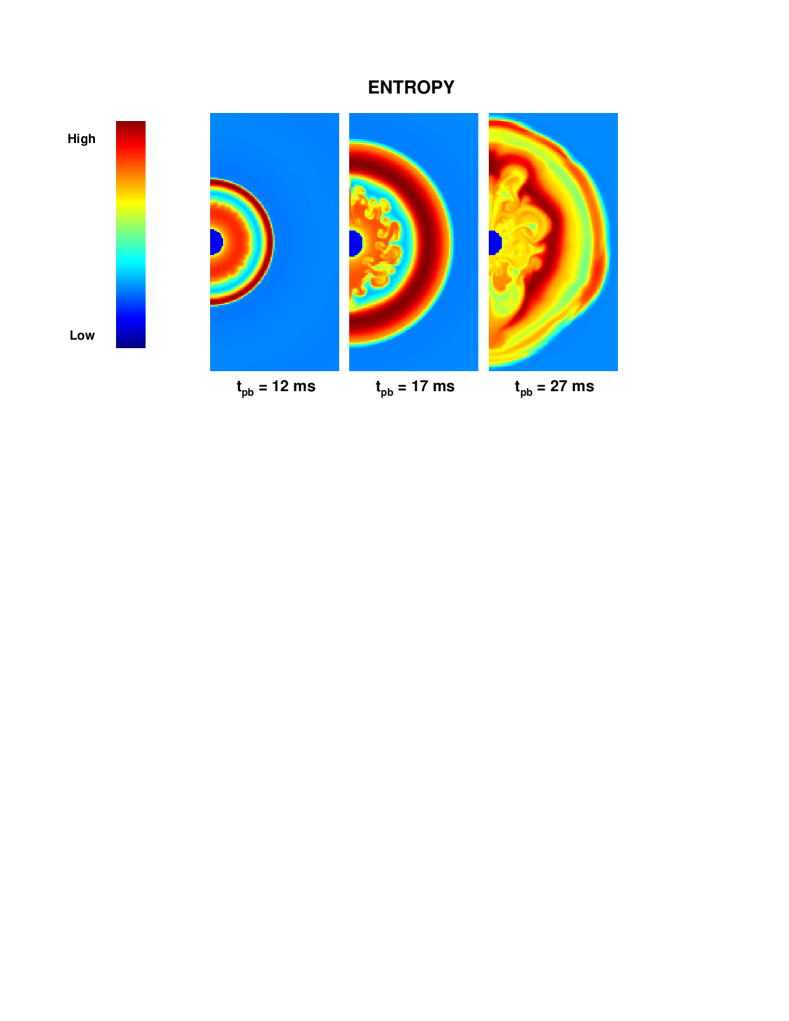
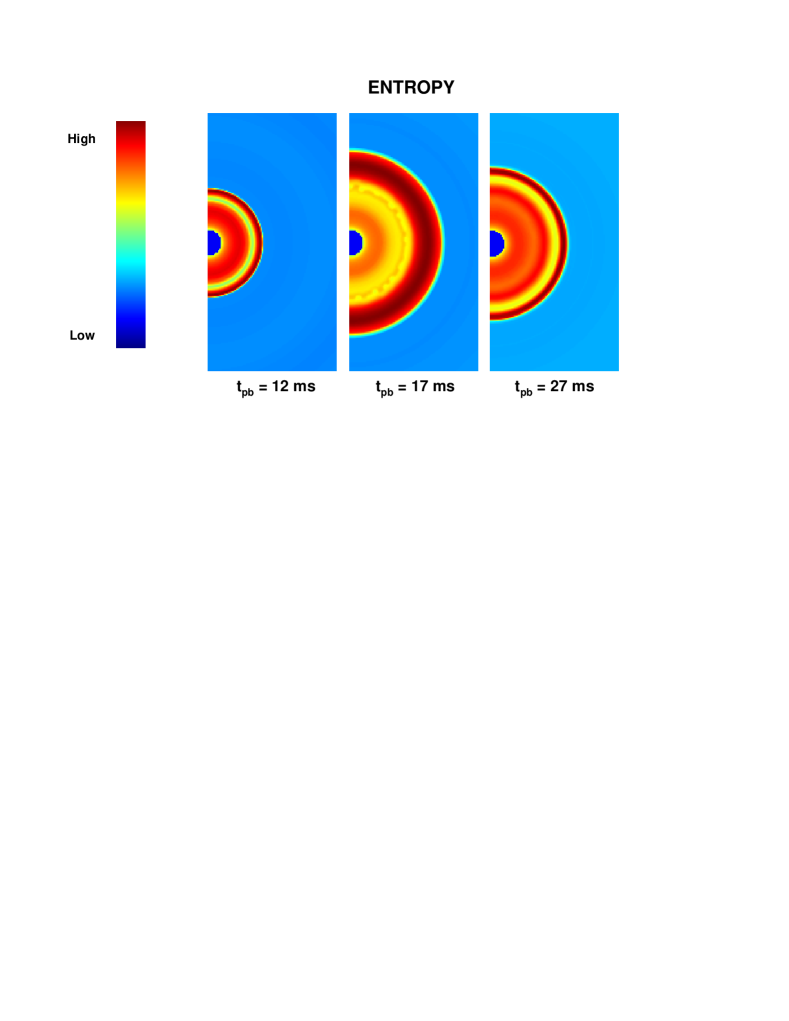
Figure 3a:
(simulation C).
The two-dimensional plots showing the entropy evolution of the
25 model in a simulation without neutrino
transport (simulation C).
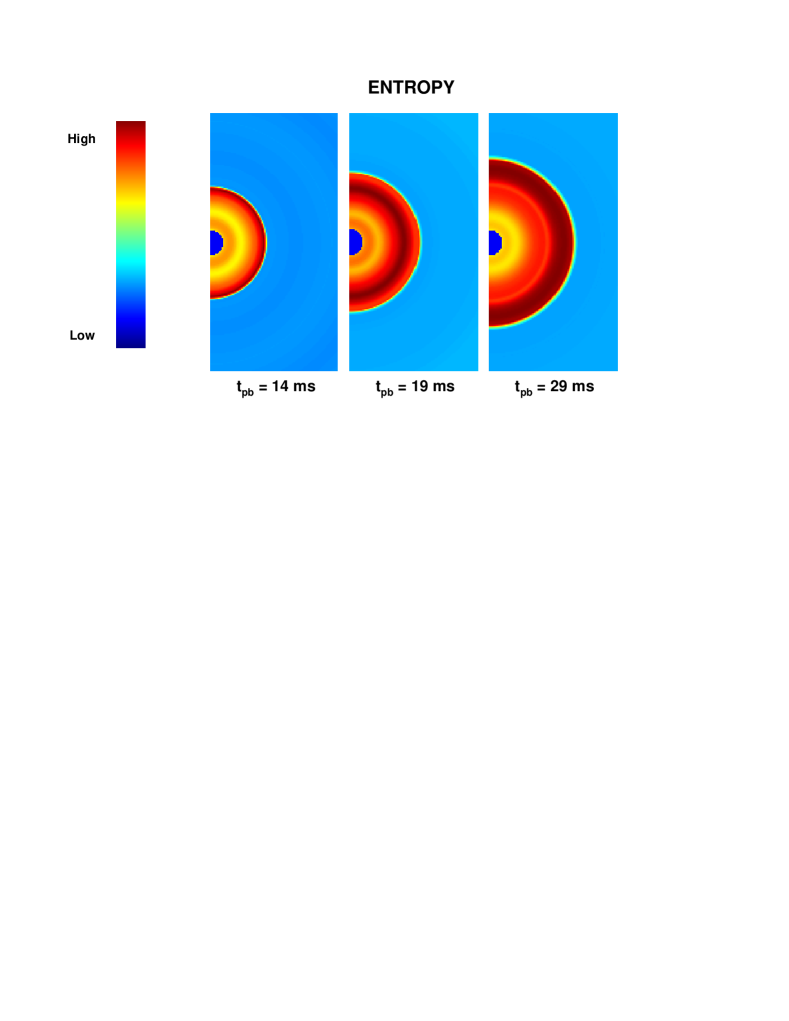
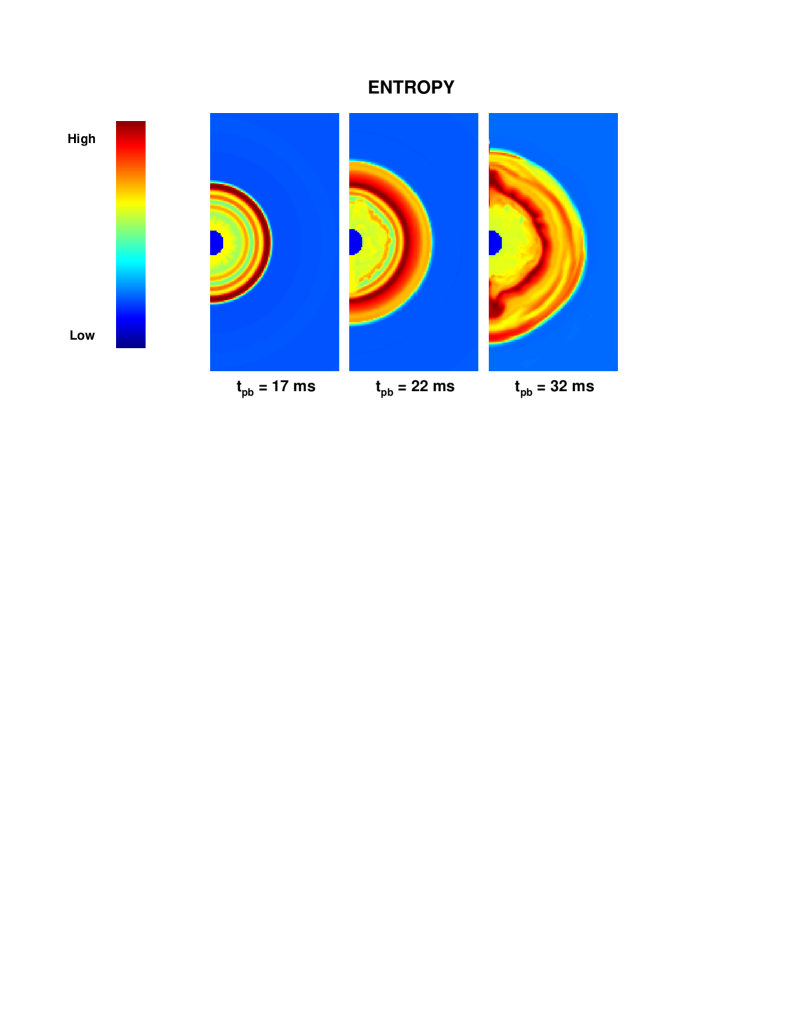
Figure 4a:
Two-dimensional plots showing the entropy evolution of the
25 model in a simulation with neutrino
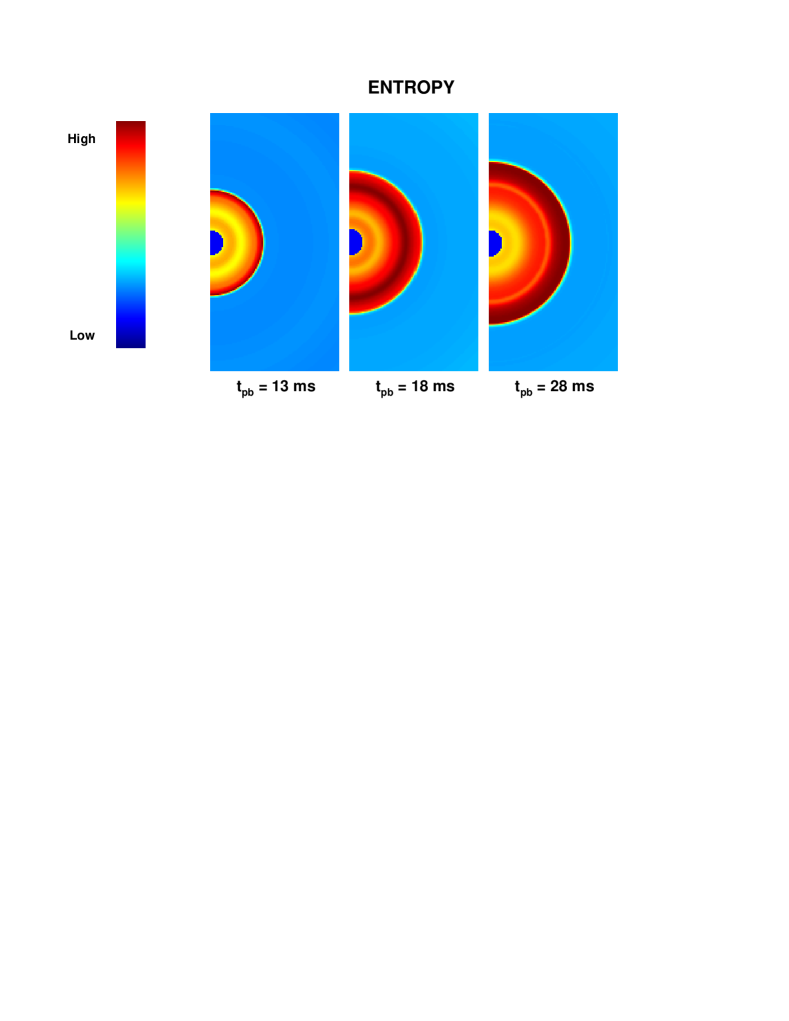
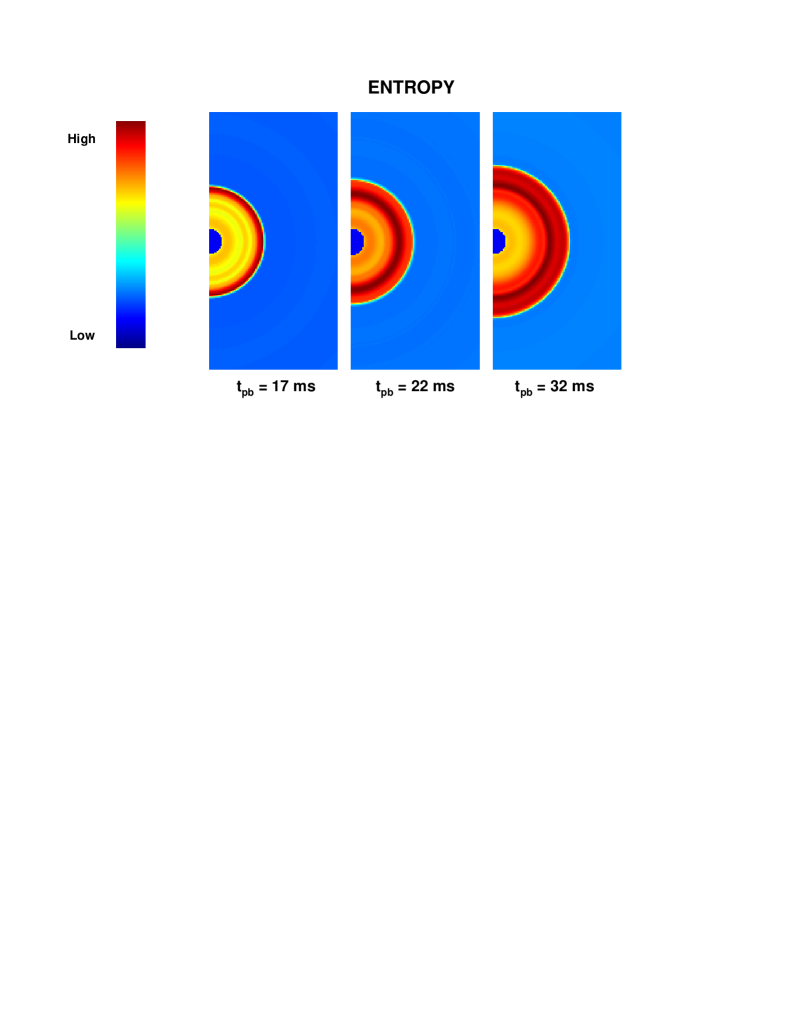
transport (simulation D).Figure 5a:
Two-dimensional plots showing the entropy evolution of the
25 model in a simulation with neutrino
transport that includes “finite-time” effects (simulation E).Figure 6a:
Two-dimensional plots showing the entropy evolution of the
25 model in a “low–test” simulation without
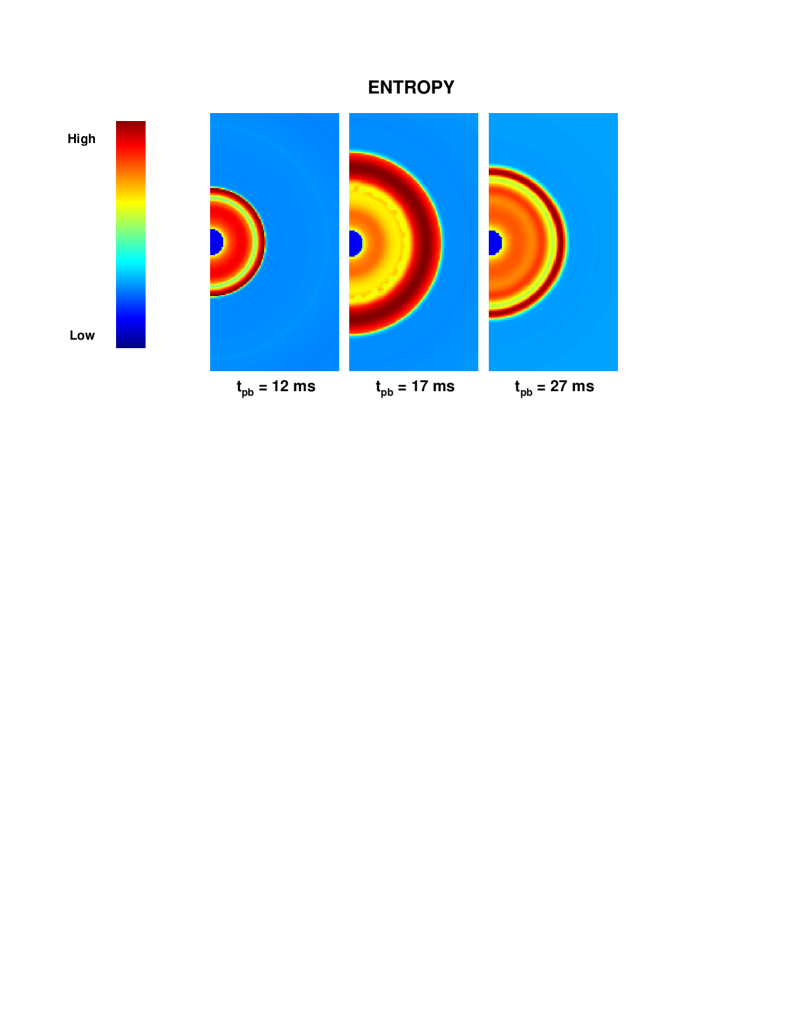
neutrino transport (simulation F).Figure 7a:
Two-dimensional plots showing the entropy evolution of the
25 model in a “low–test” simulation with
neutrino transport (simulation G).Figure 8a:
Two-dimensional plots showing the entropy evolution of the
25 model in a “low–test” simulation with
neutrino transport that includes “finite-time” effects
(simulation H).Figure 9:
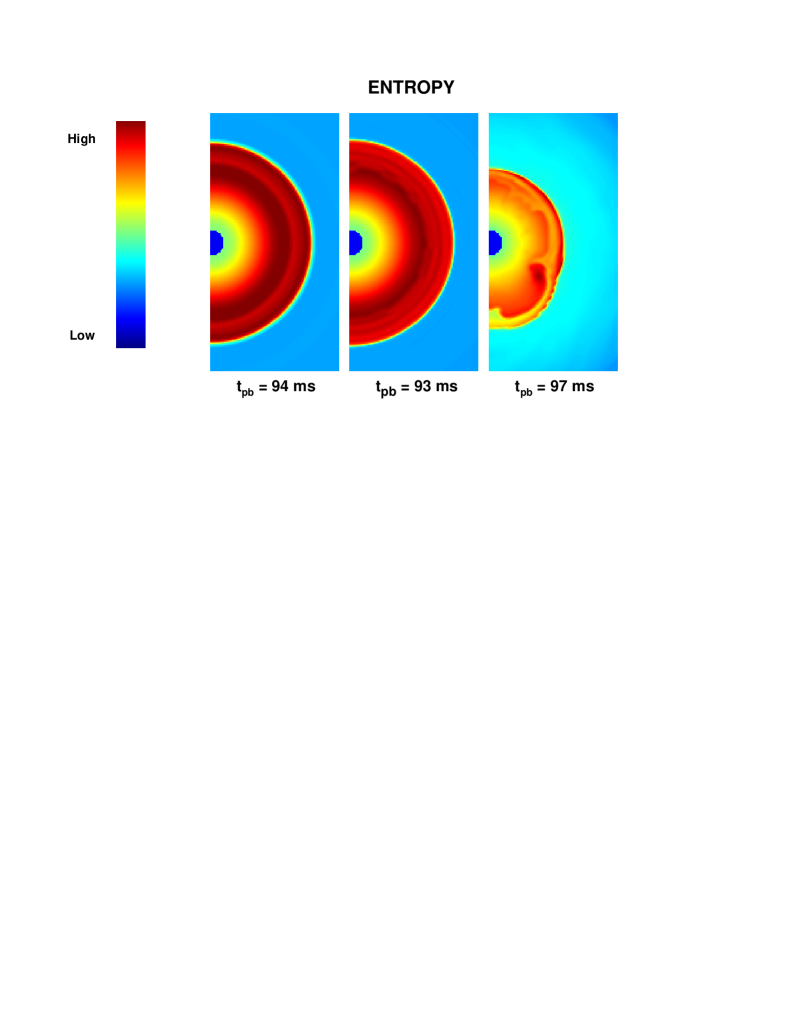
Two-dimensional entropy plots from simulations D, E, and
G, at “late” times.Figure 10a:
Two-dimensional plots showing the entropy evolution of the
15 model in a simulation without neutrino
transport (simulation K).Figure 11a:
Two-dimensional plots showing the entropy evolution of the
15 model in a simulation with neutrino
transport (simulation L).