Inferring dark halo structure from observed scaling laws of late type galaxies and LSB’s
Abstract
We re-examine the Fall & Efstathiou (1980) scenario for galaxy formation, including the dark halo gravitational reaction to the formation of the baryon disk, as well as continuous variations in the intrinsic halo density profile. The recently published rotation curves of LSB and dwarf galaxies together with previously known scaling relations provide sufficient information on the present day structure of late type disk galaxies to invert the problem. By requiring that the models reproduce all the observational restrictions we can fully constrain the initial conditions of galaxy formation, with a minimum of assumptions, in particular without the need to specify a CDM halo profile. This allows one to solve for all the initial conditions, in terms of the halo density profile, the baryon fraction and the total angular momentum. We find that a unique initial halo shape is sufficient to accurately reproduce the rotation curves of both LSB and normal late type spiral galaxies. This unique halo profile differs substantially from that found in standard CDM models (Navarro, Frenk & White 1996). A galactic baryon fraction of 0.065 is found. The initial value of the dimensionless angular momentum is seen to be the principal discriminator between the galaxy classes we examine. The present day scalings between structural parameters are seen to originate in the initial conditions.
keywords:
galaxies: formation – galaxies: structure – dark matter1 Introduction
A common approach to the study of galaxy formation is to start from a set of initial conditions, defined as a self consistent cosmological model including the phase distribution and amplitude of an initial density fluctuation spectrum, and from this to construct a full realization of the growth of structure. The gravitational evolution of the early fluctuations are typically followed numerically, so that gravitationally bound structures can be identified, and depending on the spatial resolution of the numerical code, traced over different scales. The success of this method in reproducing the large scale structure of the universe is well known (e.g. Davis et al. 1985, White et al. 1987). The problem of going to galactic scales is complicated by the need to include gas dynamics, star formation rates, energy feedback between forming and exploding stars and the other baryonic components, stellar initial mass functions, and other physical processes pertaining to the baryonic component, which are only marginally understood. This can be seen most clearly in the inability of this approach to reproduce the constant density core structure seen in the dark halos of both dwarf and LSB galaxies (see for example the rotation curves of de Blok et al. (1996) for LSB’s, Burkert (1995) for dwarf galaxies, or Carignan & Beaulieu (1989) for DD0 154, Pryor & Kormendy (1990) for dSph density profiles, and Ibata et al. (1997) for dynamical evidence for core structure in dSph galaxies, and Burkert & Silk (1997) for a discussion of this point).
The spirit of this work is to derive as much information on the initial conditions of galactic formation as can be obtained from the available observations of the galaxies themselves, with the smallest number of assumptions. Uncertainties in the interplay between star formation, gas dynamics and other non linear processes of galactic formation will necessarily limit any simple analysis, such as the one made here. There is the advantage of being able to derive information about the present state of galaxies and the scaling laws they follow with minimal dependence on an adopted primordial structure of the universe. Taking an approach that starts from the present day structure of galaxies rather than from the initial conditions will severely limit the scope of the predictions of our work. It is only through restricting the free parameters to the minimum number (one) and understanding directly how uncertainties propagate through the model, that we retain predictive power, rather than simply reproduce the observations which we introduce as constraints.
Present day late type galaxies come in a variety of sizes and shapes, but appear to obey well established scaling laws. To a first approximation, disk galaxies can be described by four observational parameters: the total luminosity of the exponential light surface density profile and the radial scale length of this profile, the central density and the asymptotic rotation velocity of the dark matter halo. The first two of these parameters relate directly to the baryonic component, and the last two refer mostly to the dark matter. The total luminosity (mass?) is tightly correlated with the asymptotic rotation velocity through the Tully-Fisher relation (Tully & Fisher 1977), the total luminosity also scales with the exponential disk scale length (Flores et al. 1993). The question addressed in this work is whether the observationally available information on present day galactic structural parameters and their scaling laws is sufficient to introduce some constraints on the initial conditions of these galaxies, without having to impose some specific dark matter density profile. To this end we apply a simple method of mapping a set of initial conditions in terms of virialized halo structure, baryon fraction and angular momentum into a set of present day galactic structural parameters. This method is essentially the one introduced by Blumenthal et al. (1986) and Flores et al. (1993), which we extend here to the case of a halo density profile which is treated as a model parameter. We restrict analysis to late-type and LSB galaxies, as only in these cases is the influence of dark matter substantial at all radii. Analysis of earlier type galaxies is necessarily more sensitive to the evolution of the baryonic components. We constrain all the initial conditions through the condition that the resulting galactic structure follows the observational constraints, taking special note of the central density of the dark halos, which can be derived from the recently published rotation curves of LSB galaxies of de Blok et al. (1996). Once this is done, we wish to investigate what relations between the initial conditions result from having imposed certain observational restrictions. It is possible that when seen in terms of initial conditions, observational laws such as the Tully-Fisher relation or the approximate scaling of the disk mass with the square of the scale radius, appear natural. Additionally, one is interested to see to what extent different galaxy classes populate different regions in the initial condition space. As no specific dark halo shape is imposed, we use present day galactic structure to solve for the halo profile, which we find to differ from that which results from the fully self-consistent structure formation CDM simulations of Navarro, Frenk & White (1996), henceforth NFW. A comparison of this two dark halo profiles will be made, in connection to the well studied dark halo of a particular gas rich dwarf galaxy, DDO 154.
Section (2) presents a dimensional analysis to the problem, which is expanded in section(3) to a more complete galactic formation scenario, calibrated using the data on LSB galaxies. In Section (4) we apply the previous framework to normal late type galaxies, and in section (5) we present the conclusions of this work.
2 Analytical approximation
Although most of the material in this section can be found elsewhere, it is included here to give the reader an intuitive framework for the problem, and to present a zero order solution to it. The three galactic structural parameters which are most readily accessible to observations in late type galaxies are , the total disk mass, , the disk exponential scale radius and , the maximum rotation velocity. is derivable from total luminosities once a ratio has been assumed. Uncertainties in the value of this ratio are generally of less than a factor of 2 for a given system. These three quantities are seen to be correlated through the Tully-Fisher (T-F) law , and an approximate scaling of , with close to 4 and close to 2. In the following section we present data from the literature yielding . It is perhaps easier to understand these correlations if one translates the observable quantities into initial conditions for the galaxy, for example, a total mass , total potential energy , baryon fraction , and a total angular momentum, . Once and are fixed, the total baryon content is given by . It is customary to refer not to , but to the dimensionless quantity
where is Newton’s constant, so it shall be treated thus in this work. On purely dimensional grounds, we can establish the following relations between the initial conditions and the observed parameters:
| (1) |
at fixed and the T-F law translates into a relation between and . Substituting for from the above relations one obtains:
| (2) |
i.e. for a galaxy population having constant and , which could represent a fixed galaxy-type sample, one expects a connection between the T-F index, and the exponent in the relation. For equation (2) gives , quite in agreement with observations.
Using the above relations between the initial conditions and the final result to translate the observational relations one obtains:
| (3) |
Eliminating and from the above two relations for , we get:
| (4) |
Equation (4) implies that for a population of galaxies following the two observational relations and constant, the baryon fraction must scale with the dimensionless spin parameter. This result is compatible with what was found by Flores et al. (1993), and essentially states the “conspiracy” between angular momentum and matter content, responsible for the observed flat rotation curves. Additionally, one expects and . It is interesting that the condition actually holds for any system where a mass orbits in centrifugal equilibrium in the potential generated by , which might be a clue as to the origin of this relationship.
Taking the first of relations (3) at constant and , we obtain
| (5) |
which is equivalent to the initial conditions translation of the T-F, given equation (2). If we now translate into a typical formation redshift (collapse z) of the system through
| (6) |
valid for a spherical “top hat” fluctuation with no initial internal kinetic energy prior to virialization, in an universe, equation(5) gives:
| (7) |
For equation(7) gives , which is what results from a simple Press-Shechter analysis for a spectral index in the galactic region of , from:
| (8) |
Even though this previous analysis has been simplified to the extreme, it suffices to show that the observational relations and constant are not independent, and are the result of the initial conditions of galactic formation, related to the structure formation scenario. Much of what has been presented here can be found in several sources, amongst them Peebles (1993), White (1997), Padmanabhan (1993). Equation (8) was taken from Padmanabhan (1993). The following section introduces a more detailed way of relating the observed structural parameters to the initial conditions of galaxy formation.
3 Theoretical approach
In this section we describe the procedure which we use to associate a set of initial formation conditions to a present day galaxy. We are assuming that the galaxies we are modeling passed through a phase in which they were characterized by an initial halo configuration, in which the baryon fraction was mixed homogeneously with the dark matter in a virialized configuration, having a certain total mass, total potential energy, and total angular momentum. At this stage baryonic cooling sets in and leads to the formation of the galactic disk. The initial halo is taken to have spherical symmetry, and not to suffer any further accretion or merging processes. The formation of this initial halo is not treated here. Whether it formed through gradual radial accretion, through a complicated merging history or was characterized by a monolithic structure throughout its history is not relevant to our study. Any one of the above scenarios is compatible with our assumptions. The real requirement is that the dark halo was fully formed at the time the bulk of the baryons begin to cool and fall into the center of the dark halo, which seems a reasonable assumption if we restrict our attention to gas-rich disk galaxies. The dynamical frailty of the disks and the non dissipative nature of stars suggest that no major mergers have taken place since the disks formed, and that they were assembled from gas.
To fully characterize this initial configuration, for every galaxy one requires five pieces of information, viz. the choice of a halo density profile, a total mass, , a total potential energy, , a baryonic mass fraction, , and a value of . Whereas there is mounting evidence, both theoretical and observational which suggests the existence of a universal shape for the density profile of dark halos, it is not clear what this shape should be. This curious situation arises from the fact that the theoretically predicted shapes for dark halos do not correspond to the observed ones (Burkert 1995, Burkert & Silk 1997). It is not clear at this point if the original shapes of the dark halos were the ones predicted by CDM theory, which were later modified by secular processes (Navarro et al. 1996), or whether they always had the observed shapes, there being some extra physics yet to be considered by CDM theory. Not wanting to impose upon the model a specific halo shape a priori, we assume only that the initial dark halos can be characterized by a King profile. King profiles form an infinity of families of density profiles, determined by a shape parameter, , the value of the gravitational potential at the center of the distribution, in units of the velocity dispersion. For every value of there exists a family of King density profiles, having two independent parameters, a central density and a core radius, or alternatively, a total mass and a total potential energy. Varying these three parameters, one can obtain virtually any density distribution with a radially increasing negative logarithmic slope, and a central behavior shallower than . Thus, King distributions have a finite total mass and can naturally accommodate a constant density inner region, such as characterizes observed dark matter halos. We show below they describe galaxies at least as well as does the limiting case King profile, a (standard) lowered isothermal profile. Even though King distributions also include a self-consistent distribution function, and have been found to represent well the end product of some N-body relaxation processes, we are not requiring here that the initial dark halos were strictly King profiles, only that their density profiles could be approximated reasonably well by King profiles. (Recall that the mathematical process of obtaining a distribution function from a given density profile does not yield a unique answer in general.) Requiring that our initial halos were King profiles is hence a much weaker imposition than choosing some two-parameter halo model such as a Hernquist, lowered isothermal, Hubble, or other, as is often done in similar work (Dalcanton et al. 1996, Flores et al. 1993). We keep the assumption of self similarity for dark matter halos, but treat the actual profile shape, as a parameter to be fixed by the observational data, in keeping with the aims of this work.
Once a set of and are chosen to represent the initial conditions, we turn a fraction of the original halo into a disk at the center of the halo, having a radial surface density profile given by
| (9) |
The two parameters in equation (9) are fixed by the two conditions of conservation of mass and angular momentum. The baryonic disk was assumed to be in centrifugal equilibrium, and no angular momentum transfer between the baryons and the dark halo was considered. The dark halo now has mass , and a structure determined by the condition
where is the orbital radius of a dark matter particle orbiting within the original virialized distribution , the final radius of this particle after the disk has formed, the final disk mass distribution, and the final halo structure. In this way, assuming the disk formation process is not violent, we use an adiabatic invariant for the halo particles to calculate the final halo structure (see Flores et al. 1993, Firmani et al. 1996, Dalcanton et al. 1996).
It has been known since the first time baryonic infall models were calculated (Barnes & Efstathiou 1987) that the adiabatic invariant approximation breaks down in the innermost regions. In that work it is shown that this approximation is not valid in the inner 1-2 disk scale lengths where more complicated dynamics take over, for the normal late type galaxies they treated. However, at this point we are modeling LSB galaxies, which clearly have undergone much milder dissipative processes, the baryons have contracted much less, and the halo reaction has been more limited. This improves the validity of the adiabatic invariant approach into the central regions significantly, as can be seen from Figure (1), even the central regions of LSB galaxies have suffered little dissipation. When we come to normal late type spirals, we are aware that the adiabatic approximation is not valid in the central regions, where baryon dissipation has been sufficiently strong to actually make that component dynamically dominant in the inner regions. This last point also introduces other uncertainties, as the high density of baryons implies that gas hydrodynamics and the dynamical coupling between the stellar and gaseous components through star formation, stellar winds and supernovae, might prove the dominant processes. In this way, the inner 1-2 disk scale lengths of the rotation curves we calculate for normal late type galaxies are probably not relevant. In spite of this, out conclusions are not affected, as it is only in the LSB cases that we use the inner regions of the rotation curves to compare with observation.
At this point, we have the complete baryon disk and dark matter halo matter distributions, and therefore the complete rotation curve as well. For simplicity only the monopole term for the disk potential was calculated, such as is done in other similar work (Dalcanton et al. 1996). See Figure (2-17) in Binney & Tremaine (1987) where this approximation is compared to the full rotation curve of a totally flat exponential disk. The agreement would improve for an exponential disk with some vertical structure, such as one expects in reality.
In this work we are only using the fact that the final baryonic matter disk has an exponential profile, as deduced from observations of late type disks. The physics which leads to this profile is of no consequence to us here so long as the adiabatic invariant assumption applies. More detailed galactic disk evolutionary studies have addressed this point: e.g. Struck-Marcell (1991) finds that the exponential profile is a hydrostatic equilibrium configuration in an isothermal halo; Sayo & Yoshi (1990) obtain this profile as a consequence of the viscous dissipation mass and angular momentum transfer processes under the assumption of a viscous timescale similar to the star formation timescale; or the more complete Firmani et al. (1996), who consider a self consistent galactic disk evolutionary scenario including independent estimates of star formation rates and viscous timescales, and find the exponential profile as a natural result of the problem, independent of the initial disk profile. Whatever the details, the slower the disk forms, the better suited the adiabatic invariant treatment for the halo becomes. The exponential disk profile and accompanying halo profile are intended to represent the present situation to be compared with observations, and not the initial disk structure.
With the method outlined above, we translate a set of initial conditions and into a set of present day observable conditions, and , the maximum rotation velocity, the final total central matter density, a measure of the total extent of the dark halo, the total disk mass, and the disk scale length, respectively. was defined as the radius at which the rotation velocity has decreased to 85% of its maximum value, , a value yet to be observed in most cases (notice however the case of DDO 154, which will be discussed more fully later). The total disk mass was compared to the observed total luminosities adopting ratio of 2 in the B band for gas rich LSB systems, and disk galaxies with types . All observations were scaled to where necessary. This value of is used throughout, which makes the value of the constant in eq.(6) . Units throughout are and kpc, , rotation velocities are given in .

Having the initial conditions specified as a 5 dimensional vector, we require 5 restrictions on any galaxy we want to model to determine what its initial conditions were. The first case we model is that of the newly observed LSB galaxies, which are the systems for which the most information can be obtained. In most disk galaxies the baryonic component is gravitationally dominant in the central regions, which makes estimating the total central matter density a difficult problem, necessarily sensitive to the assumed ratios and orbital anisotropy. In the case of the LSB galaxies, the large disk scale radius yields a very extended baryonic component (presumably arising from a high initial angular momentum) such that these systems are dark matter dominated into their innermost regions. Given this, from measurements of the rotation curves a good estimate of the total central density is available, see Figure (1). Despite this situation, the only available sample of LSB rotation curves (de Blok et al. 1996) contains only a small sample of galaxies (16), such that it is hard to distinguish any trend in the LSB galaxy-type (after all, this is a highly empirical definition, resting merely on the observational detectability limits, which do not necessarily correlate with galactic types. It has been pointed out that these are very new measurements, and that many more are expected as the observational situation improves). We further emphasize that the central rotation curves remain not well sampled, and may be further degraded by beam smearing and other finite resolution effects. Nonetheless, fitting straight lines to the inner regions of the rotation curves published by de Blok et al. (1996), we can estimate the total central matter densities of these systems, a plot of which is presented in Figure (2). As considerable spread is evident (at least some of it observational), and only galaxies within a narrow range of disk masses are present, rather than attempting to extract a trend from these galaxies, we only took the median of the distribution to characterize a “typical” LSB, in terms of a total baryon mass and total central matter density of , . These will be our first two observational restrictions, used to construct a model of a typical LSB galaxy.

From observations of total luminosity and rotation velocity amplitude it appears that LSB galaxies follow the same Tully-Fisher relation as normal late type spirals e.g. Zwaan et al. (1995). We take the recent Tully-Fisher law determination of Rhee & Van Albada (1995), where a population corrected total disk mass is calculated from colour information to derive a disk mass vs. maximum rotation velocity Tully-Fisher relation. That study shows that by taking into account the different ratios associated with different galaxies, the dispersion in the Tully-Fisher relation can be reduced to a minimum. The resulting slope in is quite similar to that of the I band Tully-Fisher relation, but the dispersion goes down by a factor of 2. Given the greater ease with which this can be compared to our study, we use this Mass Tully-Fisher throughout this work, valid for all galaxies,
| (10) |
This T-F relation provides a third constraint for our typical LSB.

Combining the samples of McGaugh & Bothun (1994) and Sprayberry & Impey (1995), who have studied the light distribution in LSB galaxies, we compiled a list of LSB galaxies for which a measured total luminosity and luminosity exponential scale radius exist. These data are displayed in Figure (3). A very clear trend is apparent with a linear regression fit giving
| (11) |
The variance in the slope is of 0.17, and of 0.05 in the intercept. This relation is assumed to hold for all the LSB galaxies and provides the fourth observational constraint on the typical LSB we want to model. Notice that the slopes of the T-F relation and the relation almost exactly satisfy equation (2), which was derived merely on dimensional grounds, and under the hypothesis of self similar halos having a constant baryon fraction and constant . This result shows that as we are assuming self similar halos, requiring that our final galaxies should satisfy the two observational relations presented above will probably yield galaxies with a constant , and a constant , which is what one might imagine would hold for a given class of galaxies.
At this point we have used all available observational constraints, and have to introduce a fifth condition in order to fully fix our typical LSB galaxy. The low surface brightness of these systems and the consequent large scale radii imply a large angular momentum. Analytical (e.g. Peebles 1969, Catelan & Theuns 1996) and numerical (e.g. Barnes & Efstathiou 1987, Warren et al. 1992) studies of the way tidal interactions between forming protogalactic fluctuations transfer orbital angular momentum to rotational angular momentum in these systems coincide in predicting values of for galaxies in the range 0.01 - 0.2, with a mean value around 0.05. As discussed above, it is plausible to expect that LSB galaxies are drawn from the high region of the distribution, so for our last restriction, we shall impose that this typical LSB galaxy has a . In choosing a value for this parameter we are estimating the typical of a high system, there can be little uncertainty in this number, perhaps of around a factor of less than 1.5. This value will be our only free parameter, as from this typical LSB we shall calibrate relations to use for other galaxies.
Now that we have as many restrictions on our typical LSB as initial conditions required for a model, we can search the initial conditions space for the values of the five parameters that result in the specified LSB. Given the shape of the restrictions introduced, it is easy to see that this point will be unique. The full rotation curve of this typical LSB is shown in Figure (4) by the solid line. It can be seen that it resembles those of de Blok et al. (1996) rather well, which is natural, as this is what was required of it. Figure (4) also shows the final halo rotation curve (dotted line) which is seen to form the dominant component in all but the extreme innermost regions. The thin line in Figure (4) shows the rotation curve of the initial King halo, which clearly did suffer some inward pull from the formation of the disk. Figure (5) is analogous to Figure (4), but shows the galaxy out to a much larger radial distance, where the drop in the rotation curve is apparent, and an almost Keplerian region appears outward of 30 kpc. It can also be seen that the adiabatic response of the halo was confined to the inner regions. Outside of , only the subtraction of the baryon fraction from the original halo is seen. We now look at the initial conditions which this model required.


The shape parameter of the typical LSB is , the baryon fraction is , which gives and is compatible with other estimates of this number. The core radius of the initial King halo was 12.1 kpc, which gives a total potential energy of . In order to translate this last number into something more recognizable, we shall use equation (6) to associate a redshift with the formation of this system. This is done only to have a more manageable quantity, and for comparisons between models. Given that the formation history of the halos was not treated, the values of redshift given are merely indicative. For our typical LSB we obtain . The value of was 44 kpc, not in conflict with the rotation curves of these systems. Even though King profiles have only a small region which approximates an isothermal profile, after which an increasingly abrupt drop in the rotation curve follows, this region is of sufficient extent to reproduce the rotation curve of these LSB galaxies. For normal spirals, where the flat rotation curve region is much more extended, we shall find that the greater relevance of the baryonic component in the inner regions (which induces a much stronger contraction in the central regions of the dark halo through the gravitational response associated with the formation of the disk) is sufficient to give quite flat rotation curves, which drop only beyond the observed regions.
Taking as our independent parameter we now require 4 restrictions to fully specify another galaxy. We shall use , and the two observational constraint equations (10) and (11), to construct LSB galaxies of different masses. Figures (6) and (7) are analogous to Figures (4), (5), but for a galaxy total mass of . It is interesting to see that for all these LSB galaxies of different masses we obtain the same value for the baryon fraction of , which is certainly encouraging, as strong variations in this parameter would be unexpected. The values of z obtained for this mass sequence are shown in Figure (8), and are seen to lie along a line with slope -0.097. This compares well with the prediction of eq(7) for of -0.096. The agreement of these two independent approaches is encouraging. For comparison, this yields , which agrees with independent estimates of this number, despite the crudeness of the method used here. Having taken self similar halos, and a constant value of , all our LSB galaxies are self similar in that they are scaled versions of each other. When compared on a linear scale, this last result yields rotation curves which raise more gradually for larger galaxies, as seen in the sequence of Figures (4)-(7).
3.1 The case of DDO 154
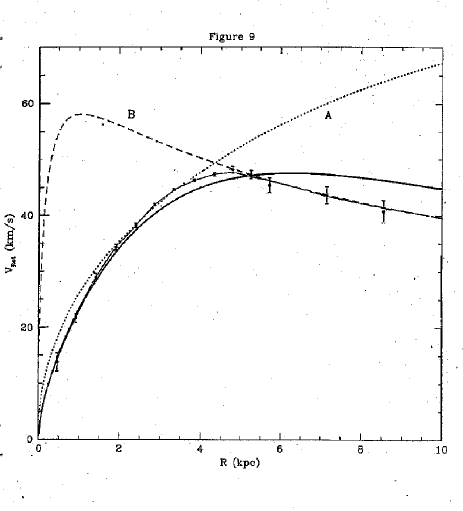
For the dwarf galaxy DDO 154 both the rotation curve and the light and gas distributions have been accurately measured. This presents an ideal opportunity to test the model, as the rotation velocity measurements extend for over 20 disk scale radii, into the Keplerian region. This is a clear case where the NFW profiles do not match the observation. Burkert & Silk (1997) show that if standard CDM (NFW) profiles are fitted to the inner regions of this galaxy, they seriously over predict the outer regions. The inner regions are similarly over predicted if a NFW profile is fitted to the outer regions of this rotation curve. Further, if the declining part of the rotation curve is fitted, the inner regions are so strongly over predicted that it appears unlikely that any secular processes in the minority baryonic component could redistribute sufficiently large amounts of the dark halo profile to match the observation. We fix from the observed rotation curve, from eq.(11) and from the observed light and gas profiles, and use and , as calibrated from the LSB cases, to fully constrain this model. The baryonic component in this galaxy is dominated by an extended gas disk which is not exponential, but given this system is totally dark matter dominated, this does not influence the modeled rotation curve significantly, although it does make estimating the initial value of for this system rather model-dependent. The resulting final rotation curve is shown in Figure (9), and is seen to reproduce the data reasonably well at all radii, although the outer decreasing region appears further out in the model. (Given that the observational relations used to obtain and contain some spread, we could fine-tune the numbers to improve the agreement. Further, there are observational uncertainties in the total gas and star content and on the distance to this galaxy, all of which could be adjusted to present an optimized fit. We do not do this as the spirit of our approach is its universality.) The modeled curve is thus not a fit, it is merely our standard LSB galaxy with the same as DDO 154. We note that although only representative and central observational constraints have been used in this analysis, the agreement with the whole rotation curve is quite good. This, together with the morphological similarity of LSB and dwarf galaxies (de Blok et al 1996) suggests that a halo profile of the form described here is universally applicable.
3.2 Direct profile comparisons
We present a more explicit comparison between the King profile at =4 with other commonly used dark halo profiles in Figure (10). The thick solid curve in Figure (10) is the final total rotation curve of our “typical” LSB galaxy, discussed in the previous section and presented in Figures (4) and (5). This galaxy has an exponential disk of mass with a scale length as given by the data through eq.(11). The parameters of the initial King halo were chosen to give the value of required by eq.(10), and a final central matter density consistent with observations of LSB rotation curves, as explained previously. This procedure yielded a baryon fraction . The dashed curve is the final total rotation curve calculated using the same procedure as was used for the LSB galaxies, but starting off from a singular isothermal halo profile. The final disk in this case is identical to that in the model corresponding to the thick solid curve, and the isothermal halo was calibrated to give the same . As can be seen, this halo is unable to reproduce the core region of the rotation curve seen in LSB galaxies, and produces a rotation curve which remains essentially flat. The dotted curves represent galaxies starting off as Hernquist spheres (Hernquist 1990),
where , the radius in units of a scale radius for this profile and is the total halo mass. The final disk was identical to that in the previous two cases. As this profile has two independent parameters, the condition of eq.(10) can be satisfied in any number of ways, using Hernquist halos of different scale lengths and different total masses, but constant maximum velocities (in combination with the fixed baryon disk). Taking , as was found for the King spheres with , we obtain the high central density Hernquist model (fastest rising dotted curve). This model is again seen to fail in reproducing the low density core structure seen in the rotation curves of LSB and dwarf galaxies. The central density of the Hernquist model can be reduced taking a halo with a larger , and hence a higher mass, as is kept fixed. Taking a halo 3 times as massive (keeping the final disk fixed) i.e. we obtain the low central density Hernquist model, which still has an excessively high central density, compared with the King halo curve, which was modeled to reproduce the LSB curves. Additionally, such a low baryon fraction seems unreasonable, and the high mass results in a rotation curve which remains flat out to much larger radial distances, which would be an additional problem in cases like DDO 154.
Finally, the thin continuous line represents a system having an initial profile given by
where , the radius in units of a scale radius, which is the fitting formula which suitably approximates the dark halo profiles which arise in the self-consistent cosmological simulations of Navarro et al. (1996b). is and is a parameter given by the cosmology and . In this case the two parameters of the distribution are not independent, and once a cosmology is chosen (we took standard CDM and : standard CDM is the model which yields the lowest central density cores, Navarro et al. 1996b-their Figure 12), a relationship between them is fixed. Setting the total mass so that agrees with eq.(10), we took the value of from their Figure 5 and from their Figure 6 the value of the constant used to calculate . The final total rotation curve of this model is essentially equivalent to the one of the high central density Hernquist model, and similarly inconsistent with the core region inferred from the rotation curves discussed above, as pointed out in the previous subsection.
These comparisons have been made including the final baryon disk and the adiabatic response of the initial halo to the disk formation not only to establish a common standard for the comparison (a fixed final disk) but also to illustrate to what extent the observed rotation curves of LSB and dwarf galaxies serve to discriminate between different halo profiles. As we took the highly extended disks of LSB galaxies, the distortion to the original halo is minimized, and the systems remain dark matter dominated. It can be seen that the low density core region seen in the observed rotation curves can not be reproduced using a halo profile which is centrally divergent, as with the 3 we have examined here.
4 Normal late type galaxies and comparisons
In this section we shall use the method described above to estimate the initial formation conditions of a mass sequence of typical late type galaxies. To do this we use the halo shape which results from fitting the LSB galaxies. As a second restriction, we use , also obtained from the LSB galaxies, as we speculate that the main difference between LSB and other late type galaxies is the value of . No variations in with mass were found for the LSB sequence, so we expect any mass loss in these systems has been marginal, consistent with their large potential depths. Equation (10) is used for the T-F relation, assumed to hold for normal late type spirals. As a final restriction, we take the list of total luminosities and disk scale radii given at the end of Persic et al. (1996) (taking only galaxies with T) to produce Figure (11). A linear regression to these data gives:
| (12) |


Equation (12) has essentially the same slope as the analogous relation for the LSB galaxies, but for a given , predicts a scale radius 2.7 times smaller. Thus, this observed scaling relation is also consistent with the observed T-F in the way the dimensional analysis would imply. At this point we can generate a mass sequence of late type spirals, which satisfy the 4 conditions above at every mass, obtain the full rotation curves and solve for , and , which can then be compared to the values obtained for the LSB galaxies. Note however that these galaxies are very baryon-dominated in their inner regions, where our model is unlikely to work well. Our aim here is to show that our halo model is not inconsistent with observations in these cases, not to obtain exact agreement with data.


Figure (12) shows the total final rotation curve, solid line, final halo rotation curve, dotted line, and initial halo rotation curve for a normal late type spiral, out to 80 kpc, Figure (13) is analogous, but out to 160 kpc. It can be seen that this rotation curves closely match observed ones in general shape. The decreasing region is not apparent until after 100 kpc. Considering an extra bulge component would improve the agreement with observations, as a central overshooting would be produced, but this has not been done to avoid new parameters. Given the value of taken, this model should approximate our galaxy and has a , rather than 220 as the observed one. This may be a result of our galaxy lying slightly above of the mean T-F relation. A slight change in the for our galaxy would also furnish agreement. Either way this discrepancy is not surprising given the approximations of the method, which is being applied in a case where the assumptions become less plausible. Notice that in this case the flat region of the rotation curve is much more extended than in the LSB cases, and that the halo has been distorted to a larger degree, the baryons having contracted much more. For this model we get a value of , which is quite close to the mean in the predicted distributions, and gives some confidence on the value of 0.1 used for the LSB’s. As was expected, we obtain smaller values of than for the LSB’s.


For the rest of the mass sequence we obtain identical values of , which is what the analytic results of section (2) led us to expect. Here again having taken self similar halos, and obtaining constant for the normal late type sequence, we obtain self similar final rotation curves, which are all scaled versions of each other. Figures (14) and (15) are analogous to (12) and (13), but for a total mass of . The description of the previous model applies here.
The values of for this mass sequence are the same as were found for the LSB galaxies and are also shown in Figure (8), i.e. we do not find a significant differences in the formation epochs of these two galaxy types. The blue colors and large gas fractions of LSB galaxies are better explained in terms of slow evolution timescales, in this case naturally arising from the low surface density (Firmani & Tutukov 1994, Firmani et al 1996), and not as reflecting recent formation epochs.
Figure (16) shows for the normal spirals and for the LSB sequence. The modeled galaxies lie on a line of slope 0.46. The arguments of section (2) would suggest i.e., a slope of 0.43. Again, the agreement of the two independent approaches is encouraging. It can be seen that the decrease in the rotation curve appears at the same relative radial distances for both types of galaxies. Thus a relation of this nature is a robust prediction of this approach, awaiting more cases like DDO 154, which lies at the cross in Figure (16) (an error in the adopted distance of a factor of 1.4 would make it coincide with the models).
Figure (17) is analogous to Figure (12), but shows the rotation curves in a log-log plot, where the characteristic shapes can be better appreciated. It is clear that the baryonic component dominates interior to around 10kpc, and the dark component outwards of this. It can be seen that both the baryonic component and the dark halo reaction to the disk formation produce an enhancement in the total rotation curve slightly interior to the original maximum, and of similar magnitude. This produces a large “flat” region, which has been identified as the signature of an isothermal halo structure. In our model, this coincidence is tied to , as the baryonic fraction contracts by a factor of , hence matching the DM contribution in the inner regions. In this scaling, all other late type spiral rotation curves we obtain appear as translations of the one shown.
Figure (18) is equivalent to (17), but shows the results for an LSB galaxy, again, all other LSB galaxies would appear as translations. Here the dominance of the baryonic component starts much further in than in the previous case, and never reaches the same extent. In this second case, it can be seen that the much smaller contraction of the baryons induces a correspondingly milder reaction in the dark halo. These last two effects are not sufficient to produce the large flat region seen in the normal spirals. Formation of the disk does however modify the inner regions of the rotation curve to some extent, as can be seen in the differences between the 3 curves, particularly in the inner 3 kpc.
In both the normal spirals and LSB’s the halo reaction is confined to the interior 12 kpc, where the concentration of the small fraction of baryons is sufficient to become important. Exterior to this region in both cases, the rotation curves are totally dark matter dominated, and not significantly affected by the disk formation. In particular the total extent of the halo is not affected by disk formation. This last result indicates that measuring the outer, decaying portion of galactic rotation curves will furnish much more strict restrictions on halo shapes and galactic formation theories than observations of inner regions.
From the comparison of the log-log plots of Figures (17) and (18) it can be seen that disk formation and acompaning halo reaction produce an enhancement in the rotation curve interior to the original maximum, and only up to the same amplitude. The “asymptotic” value is not affected. This last point is very important as it shows that at a fixed point in the T-F diagram, taking a galaxy with a different disk scale length alters only the model , as we saw that both galaxy types lie on the same relation.
In terms of the initial conditions, controls but does not affect , while determines and also has an effect on , as can be seen from the dimensional analysis in section 2. The dispersion in the T-F used here is 0.2 in at fixed . This introduces a dispersion of 0.1 in and of 0.2 in , which is sufficient to explain the dispersion in seen in the observed relations for both LSB and normal late type galaxies. However, it is rather contrived to think of a bimodal . Rather it would appear that selecting only a fixed galaxy class yields results compatible with a constant . If we take the dispersion in at fixed as going from one limit of the normal late type galaxies to the other limit of LSB galaxies, a total dispersion of almost one order of magnitude appears.
As a dispersion of only 0.2 in is compatible with , the dispersions in the observed galactic parameters imply we are seeing two independent distributions, and , both of which have an intrinsic dispersion, about 0.1 in and at least 0.7 in . The dispersion in could be larger, as earlier type galaxies perhaps have even lower values, while more extended LSB galaxies of lower surface brightness (even “failed galaxies”) could still linger undetected. Systematic variations in could exist, and complicate the above picture, but without any compelling observational or theoretical reason to include them, this shall not be discussed here. Any dispersions in , ratios or the introduction of efficiency factors would reduce the scatter in and we deduce above as resulting from the observed dispersion in and , so that the values given are probably upper limits in this sense.
Although the choice of (the value of for LSB galaxies) yielded a calibration of the model which proved quite successful in giving a reasonable , , (the value of for normal late type spirals), general shape of the rotation curves of LSB and late type galaxies, and fair agreement with the rotation curve of DDO 154, we can not be certain of this value. Taking different values for our parameter within the range leaves all our qualitative results unchanged, we have still found initial conditions such that the final results match the observations adequately. Within this range and scale linearly with , i.e. , as could be expected from the previous discussion. Accordingly, and are not affected, neither is . The plot of is thus a robust prediction of this approach, albeit one which will be difficult to verify.


5 Conclusions
From the observational data shown, the theoretical approach presented and the results obtained, we conclude the following:
1) The self similar initial halos of late type galaxies can be accurately modeled as King halos with a shape parameter , the gravitational potential at the centre in units of the halo velocity dispersion.
2) The baryon content of late type galaxies is of .
3) The value of (the characteristic angular momentum) for normal type spirals is . A scaling between the galactic disc scale radius, , and the disk mass, , of the form represents curves of
4) The Tully-Fisher law reflects , the relation between the total halo mass, , and the halo potential energy, expressed through a nominal formation redshift, . LSB and normal late type spirals have the same , there is no indication of a different formation epoch. The total extent of late type galaxies halos scales as , where is a measure of the total extent of the halo, here the radius at which the rotation curve has fallen to 85
5) and are two independent relations, having dispersions of around 0.1 and 0.7 in the log, respectively.
Acknowledgments
The work of X. Hernandez was partly supported by a DGAPA-UNAM grant.
References
- [1] Barnes J., Efstathiou G.,1987, ApJ, 319, 575
- [2] Binney J., Tremaine S., 1987, Galactic Dynamics. Princeton Universtiy Press
- [3] de Blok W.J.G., McGaugh S.S., van der Hulst J.M., 1996, MNRAS, 283, 18
- [4] Blumenthal G.R., Faber S.M., Flores R., Primack J.R., 1986, ApJ, 301, 27
- [5] Burkert A., 1995, ApJ, 447, 25
- [6] Burkert A., Silk J., 1997, Preprint, astro-ph 9707343
- [7] Catelan P., Theuns T., 1996, MNRAS, 282, 436
- [8] Carignan C., Beaulieu S., 1989, ApJ, 347, 760
- [9] Carignan C., Beaulieu S., 1997, Preprint
- [10] Dalcanton J., Spergel D.N., Summers F.J., 1996, Preprint, astro-ph 9611226
- [11] Davis M., Efstathiou G., Frenk C., White S., 1985, ApJ, 292, 371
- [12] Fall S.M., Efstathiou G., 1980, MNRAS, 193, 189
- [13] Firmani C., Hernandez X., Gallager J., 1996, A&A, 308, 403
- [14] Firmani C., Tutukov A.V., 1994, A&A, 288, 713
- [15] Flores R., Primack J.R., Blumenthal G.R., Faber S.M., 1993, ApJ, 412, 443
- [16] Hernquist, L. 1990, ApJ, 356, 559
- [17] Ibata R.A., Wyse F.G., Gilmore G., Irwin M.J., Suntzeff N.B., 1997, AJ, 113, 634
- [18] McGaugh S.S., Bothun G.D., 1994, AJ, 107, 530
- [19] Navarro J.F., Eke V.R., Frenk C., 1996, MNRAS, 283, 72
- [20] Navarro J.F., Frenk C., White S., 1996, ApJ, 462, 563
- [21] Navarro J.F., Frenk C., White S., 1996b, Preprint, astro-ph 9611107
- [22] Padmanabhan T., 1993, Structure Formation in the Universe. Cambridge University Press
- [23] Peebles P.J.E., 1969, Apj, 155, 393
- [24] Peebles P.J.E., 1993, Principles of Physical Cosmology. Princeton University Press
- [25] Persic M., Salicci P., Stel F., 1996, MNRAS, 281, 27
- [26] Pryor C., Kormendy J., 1990, AJ, 100,127
- [27] Rhee M.H., van Albada T.S., 1995, Preprint
- [28] Sayo H., Yoshii Y., 1990, ApJ, 363, 40
- [29] Sprayberry D.M., Impey C.D., 1995, AJ, 109, 558
- [30] Struck-Marcell C.,1991, ApJ, 368, 348
- [31] Tully R.B., Fisher J.R., 1977, A&A, 54, 661
- [32] Warren M.S., Quinn P.J., Salmon J.K., Zurek W.H., 1992, ApJ, 399, 405
- [33] White S., 1997, Preprint
- [34] White S., Frenk C., Davis M., Efstathiou G., 1987, ApJ, 313, 505
- [35] Zwaan M.A., van der Hulst J.M., de Blok W.J.G., McGaugh S.S., 1995, MNRAS, 273, L35