An Unusual X-ray Burst from the Globular Cluster M28
Abstract
We report the discovery of an unusual X-ray burst from the direction of the Globular Cluster M28 using data acquired with the ASCA Observatory. The burst was recorded by all four ASCA telescopes and displays a fast ( ms) rise followed by an exponential decay ( s) and a steady afterglow which lasts between 800 – 3250 s. The image of the burst is consistent with an ASCA point source and is centered on quiescent X-ray emission from the core of M28. The burst temporal profile is similar to Type I bursts emitted by accreting neutron stars of low mass X-ray binaries (LMXB). We argue that the burst arises from an LMXB that is located in the core of M28. The burst is unique in two ways: it is intrinsically sub-luminous, and more importantly, originates from a source whose quiescent luminosity is fainter than that of the known cluster bursters by three orders of magnitude. We suggest that this burst is from a highly magnetized neutron star accreting at a low rate. These accreting systems may account for the mysterious low luminosity X-ray sources in globular clusters.
1 INTRODUCTION
The low mass X-ray binaries (LMXB) are the brightest X-ray sources in the sky. About 124 are known of which 40 show Type I bursts (Lewin, van Paradijs, & Taam 1993). These bursts are characterized by a sharp rise time and a spectrum which becomes softer as the burst evolves. The bursts have been interpreted as cooling of a thin layer of material on the surface of neutron stars that is heated by unstable nuclear fusion within this layer (Woosley & Taam 1976; Maraschi & Cavaliere 1977). The peak luminosity appears to have a small dispersion, less than a factor of 10 with a maximum value equal to the Eddington luminosity, erg s-1. A disproportionate number of LMXBs are found in the Galactic globular clusters and all these have exhibited a Type I burst (Dotani et al. 1990).
A day long observation of the globular cluster M28 was conducted with the ASCA X-ray Observatory (Tanaka et al. 1994) on March 29, 1995 UT. The original motivation was to search for X-ray pulsations from the known 3-ms radio pulsar PSR B182124 (Lyne et al. 1987). These pulsations were subsequently detected (Saito et al. 1997). Recently, during the course of verification of a timing package, we analyzed this data. In the process we discovered an unusual X-ray flash, the analysis of which is reported in this Letter.
2 OBSERVATIONS
The ASCA satellite consists of four co-aligned telescopes, each of which is a conical foil mirror coupled to one of two types of focal plane sensors, the two Solid State Imaging Spectrometers (SIS–0 & SIS–1) or the two Gas Imaging Spectrometers (GIS–2 & GIS–3). The SIS detectors are sensitive to photons in the keV energy band with a nominal spectral resolution of 2% at 6 keV, scaling as . The angular resolution of the SIS is , limited by the mirror optics. The SIS data were acquired in the “4-CCD” mode, using 16 s integrations, with the SIS field-of-view centered on the core of the M28 cluster.
The GIS detectors have a relatively modest spectral resolution of 8% at 6 keV, in comparison to the SIS, with a larger effective area at higher energies. The temporal resolution is also higher, 61 s or 0.5 ms, depending on the mode that was selected. The images formed by the GIS sufferes from an energy dependent blur which results in an effective angular resolution of 3′. The GIS data were edited using the standard “REV1” processing criteria to exclude periods of high background contamination. The SIS data were time filtered using the GIS good time intervals to directly compare the light curves from both instruments. The final effective exposure time is ks per detector.
3 RESULTS
The ASCA image of the M28 region obtained using the entire data set contains a single unresolved source, AX J182452451. This source is located at the light centroid of the globular cluster M28 and has been studied in detail by Saito et al. (1997). We constructed light curves using photons from a diameter aperture centered on AX J182452451 and found a flash, lasting tens of seconds, followed by an afterglow. The profile of the burst is essentially identical in all instruments (Figure 1). The background light curves from each detector show no appreciable rise in the overall count-rate during the flash or the afterglow. The summed background light-curve is shown in Fig. 1 and contains photons from a concentric annulus of radius (GIS) and (SIS).
The background particle flux rate during the burst interval, as measured by the GIS radiation belt monitor, shows no unusual activity during this period. A careful study of the GIS scaler (discriminator) rates, which record the number of detections in each GIS before any detailed processing is done, also show no abnormal behavior. The scaler rates during the burst are at no time high enough to warrant dead-time correction. As expected, the burst count-rates measured by each detector are not the same. This is because the four mirrors are not quite co-aligned, and a source will fall at different off-axis angles for each mirror and thus suffer a varying amount of mirror vignetting (geometric shadowing). A second reason is that the relative detector efficiency is a strong function of position. The combined effect of the two is typically . Indeed, we find that the relative burst fluence measured from each detector is consistent with that expected for a cosmic (i.e. a distant) source imaged through the telescopes; the relative count-rates for the burst are identical to those measured for the quiecent emission, within counting statistics and spectral differences.
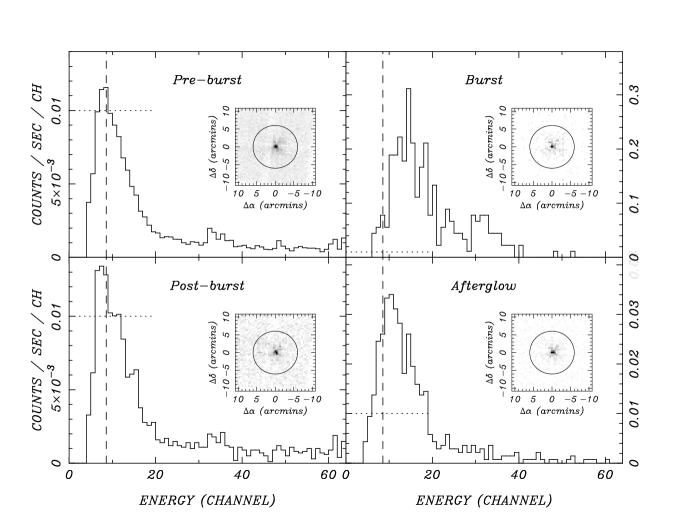
Figure 2 shows the combined SIS (SIS–0 + SIS–1) images and spectra of AX J182452451 obtained during the time intervals defined in Table I: pre-burst, flash, afterglow, and post-burst. The images are centered on AX J182452451 and display the field-of-view of the SIS. The burst and afterglow photons form an image which, within the photon counting errors, is a point source with the same pixel centroid as AX J182452451; the 95% confidence radius of the burst localization is (see Gotthelf 1996 for details on measurement accuracy with the SIS).
The facts presented so far – (1) the detection of the burst in all four detectors, (2) the absence of any abnormal behavior in the background rate, (3) the consistency of the image of the burst in each detector, including the variation in fluence expected from telescope vignetting – lead us to conclude that the burst is cosmic in origin. This conclusion motivated us to carry out a detailed analysis of the burst.
For each of the four sub-time intervals specified in Table 1 we created a spectrum from photons extracted from a diameter circular region centered on the image peak. These spectra are displayed in Fig. 2. To compare spectra from different time intervals we have normalized them by duration and plotted them auto-scaled to the peak value. The burst rate is almost 2 orders of magnitude higher than the quiescent rate. Even without any sophisticated analysis we note that the spectrum of the burst is distinctly different from that of the quiescent emission. The results discussed here are identically reproduced by the GIS data.
As with the SIS data, GIS photons within a 12′ diameter circular region centered on AX J182452451 were extracted. The burst profile derived from the combined GIS data is shown in Fig. 3. The rise of the burst is unresolved. A photon-by-photon arrival time analysis of the high time resolution GIS data yields a turn-on time of 70 ms. The burst decay signal is well represented by an exponential model, , where is the step function, and and the subscripts refer to the peak, afterglow and quiescent (pre-burst) counting rates. Fitting the data to this functional form we obtain cps, cps, cps and s; this model is displayed in Fig. 3 (solid line). The start time of the first significant burst emission measured by the two instruments is consistent with counting statistics ( inverse of the count rate). The estimated uncertainty in the onset of the burst is about 40 ms. The afterglow increases the quiescent (pre-burst) count rate times and lasts between 800 s to 3250 s; the gap in the data is due to Earth block.
Comparison of the burst profile in the hard ( keV) and soft-band ( keV; see Figure 3) shows some indication of spectral evolution from the initial soft impulse. Specifically, the spectrum is seen to soften (i.e. more photons at lower energies relative to higher energies) as the burst evolves.
Spectral fits to the mean burst spectrum obtained from the two GISs are presented in Table 2. The background is a negligible contribution during this interval. We fit several standard models to the data, all of which produced reasonable fits. This is not surprising given the small number of counts. It is noteworthy that all three models require a best-fit value larger than that obtained by Saito et al. (1997) from analysis of the 3-ms pulsar data. Saito et al.’s value of cm-2 is consistent with other measures of the interstellar absorption expected to the cluster M28. Thus we conclude that there is an additional absorption internal to the bursting source.
4 DISCUSSION
The duration of the flash is so short that we can safely exclude stellar flares (Greiner, Duerbeck & Gershberg 1994) from an active star such as UV Ceti or a T Tauri (young) stars. Our flash was not coincident in time with any known gamma ray burst, making it unlikely to be an X-ray precursor. This flash bears some similarity to the flashes reported from analysis of the database of the X-ray satellite EINSTEIN (Gotthelf, Hamilton & Helfand 1996). But the sky distribution of the EINSTEIN flashes does not suggest a globular cluster origin. We note that both the temporal and spectral properties of our flash are similar to those of Type I bursts. Furthermore, the flash is coincident with the core of a globular cluster and clusters are known to be relatively abundant in LMXBs. To our knowledge all LMXB’s in clusters have exhibited a Type I burst (Dotani et al. 1990). Thus we adopt the simplest hypothesis, viz., that this is a Type I burst originating in the globular cluster M28.
Using the mean spectrum for the flash (Table 2) we obtain a peak flux of erg cm-2 s-1 which translates to an (assumed) isotropic luminosity of erg s-1; the distance to M28 is assumed to be 5.1 kpc (Rees & Cudworth 1991). The total energy in the burst is ergs. Almost all Type I bursts reported in the literature have peak luminosities with ranging from more than 0.1 to 1 where erg s-1 is the Eddington luminosity for a neutron star. Our burst appears to have . This may appear to be in conflict with our conclusion that the burst under discussion is a Type I burst. However, below, we argue that this is not a fatal objection.
Type I bursts are understood to be thermo-nuclear instabilities of the accreted matter on neutron stars. Once a critical column density, , is reached nuclear fusion produces far more heat than can be radiated away. This results in the layer getting heated till expansion sets in. The resulting cooling accounts for the softening of the spectrum as the burst progresses. At any given point on the surface of the neutron star, the critical column density is a function of the composition (including metallicity) of the accreted gas, the core temperature of the neutron star and the local accretion rate (Taam & Picklum 1978; Joss & Li 1980; Fujimoto, Hanawa & Miyaji 1981). (Fujimoto, Hanawa & Miyaji 1981; Bildsten & Brown 1997) varies from gm cm-2 to gm cm-2 as the core temperature varies from K to K.
Strong magnetic fields force the accretion to polar cap regions, thereby changing the local accretion rate. This fact explains why accreting X-ray pulsars (which are highly magnetized neutron stars) are not seen to burst and likewise why bursters do not pulse. For a given source, is not expected to be highly time dependent. For values of applicable to most bursters, the observed range in translates to an inference that the bursts are from a substantial portion, 10% to 100%, of the surface of the neutron star. This inference fits in well with our ideas that LMXBs are magnetically weak neutron stars and thus there is little impediment to prevent the spread of accreted material.
There is an alternative explanation for sub-luminous Type I bursts. Garcia & Grindlay (1987) noted that a Type I burst from 4U2129+47 had an even lower value, . They persuasively argue that 4U2129+47 is a LMXB whose thick accretion disk obscures the neutron star from our sight. From our vantage point we only see a fraction of the quiescent and the burst emission that is scattered by the electrons in the corona. This accounts for the small value of . This model also explains two other peculiarities of the 4U2129+47 burst, a longer rise time (6 s instead of the usual 1 s) and the higher effective temperature, keV instead of keV. Scattering allows multi-path propagation which then accounts for the longer rise time. Inverse Compton scattering of photons by the hot electrons in the corona also boosts the energy of the incident photon.
However, the flash reported here has a soft spectrum and a short rise time and appears to be no different from a typical Type I burst. Thus we conclude that our flash is a Type I burst but intrinsically sub-luminous. If so, we are forced to the conclusion that material from only a small area of the neutron star, between 0.1% to 1%, was involved in this burst, depending on the value of we adopt. For a low luminosity source, is higher and thus we prefer the smaller value for the area. The accreted material is probably confined by a strong magnetic field. With such a small area for the burst we should expect to see very deep modulation due to rotation. The lack of a significant modulation in the burst profile indicates that we are either looking down at the magnetic pole or that the neutron star’s rotation period is much greater than 10 s.
In the Type I burster model, the burster must have a certain quiescent X-ray luminosity. The quiescent emission is generated from accretion of matter into the deep potential well of the neutron star. This gas subsequently undergoes nuclear fusion. Therefore, one expects the ratio of the quiescent luminosity to the mean burst luminosity to be the ratio of the potential energy of one gram of matter to the nuclear energy liberated from the same gram or about 25 (H-burning) or 100 (He-burning). Thus the mean time between bursts, , is expected to satisfy the following relation: . Here is the integrated energy of the burst and is the luminosity due to accretion i.e. the luminosity of the source in quiescence.
From observation of the M28 region with the ROSAT High Resolution Imager (HRI) only two X-ray sources are found in the entire HRI field-of-view, the 3-ms radio pulsar RX J182452452P and RX J182452452E (Danner et al. 1997). These are separated by in the HRI images. However, at the resolution of the ASCA mirrors these two sources blend together and thus our ASCA source AX J182452451 is the sum of the two ROSAT sources. Danner et al. (1997) speculate that RX J182452452E is either a collection of low luminosity point sources or a synchrotron nebula. An upper limit to the quiescent flux of the burster is thus a fraction of the luminosity of RX J182452452E, say erg s-1. Given that the energy of our burst is erg we find yr. This estimate of is consistent with our lack of detections of any other burst from M28 in archival X-ray data from the ROSAT or EINSTEIN missions.
5 SUMMARY
We have discovered a Type I burst which is unique in two ways: (1) it is sub-Eddington by a factor of 100 and more importantly (2) the quiescent luminosity of the source is three orders of magnitude smaller than that of all previously known bursters. We propose that these two observations can be explained by a model of a highly magnetized neutron star accreting at a low rate. The low accretion rate results in an Alvèn radius that is large and thus an equilibrium spin period that is concomitantly long (Bidlsten & Brown 1997). This provides a natural explanation for the observed lack of any modulation in the burst profile despite the fact that the burst supposedly arises from a very small region.
Radio pulsars in globular clusters have a range of magnetic field strengths; see review by Kulkarni & Anderson (1996). These authors have argued that this observation can be explained by assuming that all cluster neutron stars are born with a distribution of magnetic field strengths similar to those in the disk (i.e. a typical dipole field strength of G). Depending on the accretion history a range of field strengths are then obtained. However, do note that Lyne, Manchester and D’Amico (1996) disagree with this conclusion. Leaving aside this dissenting view we note that in the picture of Kulkarni & Anderson highly magnetized neutron star accreting matter at a low rate are expected to be quite common. Thus a natural explanation can be found in this framework for the type of LMXB we have hypothesized as the the source of the burst discussed in this paper.
A natural consequence of this suggestion is that similar flashes should also be seen towards other clusters. Why have not such anomalous bursts been noticed before? We argue that previous non-imaging missions missed these bursts because of their limited dynamic range in sensitivity. Imaging telescopes have the sensitivity to detect such bursts. Unfortunately, the frequency of such flashes is low, a dozen per year per rich cluster. Discovery of another such burst from M28 would require two months of dedicated observations by the ASCA satellite! Thus it will not be easy to verify this prediction. We eagerly look forward to the deployment of large field-of-view imaging monitors such as that proposed by Priedhorsky et al. (1996).
Finally, we note that this class of bursts offers new insights into the physics of thermonuclear instabilities. For example, the fact that the quiescent luminosity is low enabled us to clearly recognize the afterglow. This phenomenon in itself is of interest to models of Type I bursts. The afterglow could arise from extended burning (Fushiki et al. 1992) or slow propagation of the burning front (Bildsten 1995) or simply the emission from a transiently heated surface. The first two reasons have been advocated for conventional Type I bursts but the latter is a new twist. It is important to note that the surface of the neutron stars in these systems is expected to be cooler than those of the brighter bursters, both because of a very small burst rate as well as a small quiescent luminosity. As remarked earlier, the value of the surface temperature (core temperature) is an important parameter in the theory of Type I bursts. This opens the possibility that such bursts offer tests of the model over a range of previously unexplored parameter space.
References
- (1) Bildsten, L. 1995, ApJ, 438, 852
- (2) Bildsten, L. & Brown, E. F. 1997, ApJ, 477, 897
- (3) Danner, R. M., Kulkarni, S. R., Saito, Y. & Kawai, N. 1997, Nature, in press.
- (4) Dotani, T., Inoue, H., Murakami, T., Nagase, F., Tanaka, Y., Tsuru, T., Makishima, K., Ohashi, T. & Corbet, R. H. D. 1990, Nature, 347, 534
- (5) Fujimoto, M. Y., Hanawa, T. & Miyaji, S. 1981, ApJ 247, 267
- (6) Fushiki, I., Taam, R. E., Woosley, S. E. & Lamb, D. Q. 1992, ApJ, 390, 634
- (7) Garcia, M. R. & Grindlay, J. E. 1987, ApJ, 313, L59
- (8) Gotthelf, E. V., Hamilton, T. T. & Helfand, D. J. 1996, ApJ 466, 779
- (9) Gotthelf, E. V., in ASCANEWS, #4, HEASARC (Greenbelt: NASA/GSFC) (1996)
- (10) Greiner, J., Duerbeck, H. W. & Gershberg, R. E. (eds) 1994, Flares and Flashes, Springer-Verlag, 1-456
- (11) Hameury, J. M., Bonazzola, S., Heyvaerts, J. & Lasota, J. P. 1983, AA 128, 369
- (12) Joss, P. C. & Li, F. K. 1980, ApJ 238, 287
- (13) Kulkarni, S. R. & Anderson, S. B. 1996, IAU Symposium, 174, 181
- (14) Lewin, W. G., van Paradijs, J. & Taam, R. E. 1993, Space Sci. Reviews, 62, 223-389
- (15) Lyne, A. G., Brinklow, A., Middleditch, J. M., Kulkarni, S. R., Backer, D. C. & Clifton, T. R. 1987, Nature 328, 399
- (16) Lyne, A. G., Manchester, R. N. & D’Amico, N. 1996, ApJ, 460, L41
- (17) Maraschi, L. & Cavaliere, A. 1977, in Highlights in Astronomy, E. A. Müller (Ed.), (Reidel, Dordrecht), Vol. 4, 127
- (18) Priedhorsky, W. C., Peele, A. G. & Nugent, K. A. 1996, MNRAS, 279, 733
- (19) Rees, R. F. & Cudworth, K. M. 1991, AJ, 102, 152
- (20) Saito, Y., Kawai, N., Kamae, T., Shibata, S., Dotani, T. & Kulkarni, S. R. 1997, ApJ 477, L37
- (21) Taam, R. E. & Picklum, R. E. 1978, ApJ 224, 210
- (22) Tanaka, Y., Inoue, H. & Holt, S. S. 1994, PASJ, 46, L37
- (23) Woosley, S. E. & Taam, R. E. 1976, Nature, 263, 101
Acknowledgments: EVG’s research is supported by NASA. SRK’s research is supported by NASA and NSF. SRK thanks L. Bildsten and W. Lewin for education on the topic of bursters. We thank G. Hasinger, D. Helfand, E. S. Phinney, J. Swank, and F. Verbunt for helpful discussions and K. Ebisawa for useful discussion concerning the GIS scaler data. This research has made use of data obtained through the HEASARC Online Service, provided by the NASA/GSFC.
| Table 1 | ||||
| M28 Observation Log and Burst Time Intervals | ||||
| Interval | Start Time | Exposurea | Countsb | Rates |
| (UT) | net(total) (sec) | (cps) | ||
| Observation | 28/03/95 17:23:36 | 74,220(207,328) | 6,654 | 0.09 |
| Pre-burst | 28/03/95 17:23:36 | 62,581(181,664) | 5137 | 0.08 |
| Burst | 29/03/95 18:37:33 | 90(90) | 212 | 2.21c |
| Afterglow | 29/03/95 18:38:18 | 1,440(1,528) | 400 | 0.28 |
| Post-burst | 29/03/95 18:51:02 | 10,109(24,036) | 905 | 0.09 |
| a Screened (i.e. Good Time Interval, GTI) and total exposure time | ||||
| from both GIS sensors. | ||||
| b Total photons falling within a 6 arcmin radius aperture centered | ||||
| on the X-ray source (both GIS sensors). | ||||
| c Peak rate is 28 counts per sec. | ||||
| Table 2 | ||||
| M28 Burst GIS Spectral Fitsa | ||||
| Model | Continuum | N b | Fluencec | () |
| or kT | ( cm2) | (erg cm-2) | ||
| Power Law | 0.9 (12) | |||
| Blackbody | 1.3 (12) | |||
| R–S | 1.1 (12) | |||
| a GIS-2 & GIS-3 photons collected using a 6 arcmin aperture | ||||
| centered on the source with no background | ||||
| subtraction (assumed negligible). Spectral fits are in the | ||||
| keV range. Errors are 90% confidence region for | ||||
| a single interesting parameter. | ||||
| b Intrinsic absorption, after allowing for an interstellar | ||||
| absorption of cm2 (from Saito et al. 1997) | ||||
| c The unabsorbed fluence at the front of the telescope, integrated | ||||
| during the 45 sec burst interval. | ||||