The ROSAT Deep Survey
Abstract
The ROSAT Deep Survey includes a complete sample of 50 X-ray sources with fluxes in the keV band larger than 5.5 erg cm-2 s-1 in the Lockman field (Hasinger et al., Paper I). We have obtained deep broad-band CCD images of the field and spectra of many optical objects near the positions of the X-ray sources. We define systematically the process leading to the optical identifications of the X-ray sources. For this purpose, we introduce five identification (ID) classes that characterize the process in each case. Among the 50 X-ray sources, we identify 39 AGNs, 3 groups of galaxies, 1 galaxy and 3 galactic stars. Four X-ray sources remain unidentified so far; two of these objects may have an unusually large ratio of X-ray to optical flux.
Key words: surveys – galaxies: active – quasars: emission lines – galaxies: Seyfert – X-rays: galaxies
1 Introduction
The goal of the ROSAT Deep Survey (RDS) is to obtain information about the luminosity functions of various types of X-ray sources as well as their evolution with redshift, and to understand the origin of the X-ray background (XRB) discovered more than thirty years ago (Giacconi et al. 1962). The survey was conducted in the Lockman field (Hasinger et al. 1993), which has a minimum of galactic hydrogen column density (Lockman et al. 1986). The survey consists of exposures totaling 207 ksec with the ROSAT PSPC and a raster scan of HRI exposures totaling 205 ksec. In addition, we have a series of HRI exposures of a fixed area within the PSPC field with a total exposure of 1112 ksec, which allows us to derive improved positions for PSPC sources detected in the area.
The extraction of the X-ray sources and the derivation of the limiting X-ray flux of detection and other X-ray properties are presented in Paper I (Hasinger et al. 1997). Radio observations of the Lockman field have been published by De Ruiter et al. (1997).
This paper presents the optical observations made in the Lockman field. These consist of CCD imaging of the field and spectroscopic observations of optical objects close to the position of the X-ray sources. Section 2 covers the CCD imaging, the extraction of the optical objects, their positions and magnitudes. In Sect. 3, we discuss the spectroscopic observations of optical candidates for identification with the X-ray sources. On the basis of these observations and the X-ray properties, we obtain optical identifications and classifications for almost all of the X-ray sources, cf. Sect. 4. In Sect. 5, we compare our results to those of other surveys made with ROSAT and in Sect. 6 we summarize the results. Throughout the paper, we use 50 km s-1 Mpc-1 and 0.5.
2 Optical imaging and photometry of the Lockman field
As described below, we carried out imaging observations of the field at Mauna Kea and at Palomar. Efforts to observe the field at Kitt Peak National Observatory were unsuccessful due to weather.
2.1 CCD imaging at the University of Hawaii 2.2-m telescope
Images of the Lockman field were obtained on 16-19 January, 1988 with the University of Hawaii 2.2-m telescope. The detector was an 800x800 thinned Texas Instruments CCD obtained from the NSF distribution. A focal reducer in the cassegrain camera produced an image scale of per pixel; the field of view was on a side. A mosaic of 50 frames was taken through B and R filters on the Kron-Cousins system to cover most of the area in the inner of the PSPC field. Exposure times were 10 min. for the filter, and 4 min. for . Photometric calibration was provided each night by several observations of the M67 asterism (Chevalier & Ilovaisky 1991). Typical seeing for the nights ranged between and . The FOCAS image processing system (Valdes 1982) was used for processing the images and to produce total magnitudes and morphological classes. The magnitude limits were around 24.5 in and 23.5 in .
2.2 CCD drift scans at the Palomar 5-m telescope
Drift scans of the Lockman field through two filters were obtained on March 29, 1989 with the 4-Shooter camera (Gunn et al. 1987) at the cassegrain focus of the 5-m Hale telescope. The detectors are four 800 x 800 Texas Instrument CCDs covering a net field of on a side with an image scale of per pixel. The four CCDs image a contiguous 2 x 2 matrix of sky and the chips are oriented such that the readout directions of each detector are parallel. During the observations, the instrument was rotated such that the CCD columns were oriented north-south. Each drift scan was started by pointing the telescope at a position just south of the Lockman field, and then driving the telescope north accross the field at a rate of per min. The leading CCDs recorded the sky through the ’wide ’ filters employed in the HST Wide Field/Planetary Camera (cf. MacKenty et al. 1992), while near-infrared filters (; MacKenty et al. 1992) were placed in front of the trailing chips. The system response curves for these filters as well as the photometric properties are given in Postman et al. (1996).
The CCDs were operated in Time-Delay-and-Integrate (TDI) mode at a rate corresponding to the drift scan, resulting in an effective exposure of 293 s through each of the two filters. Except for the gaps in the center of each scan caused by the 4-Shooter beam-splitter, the entire field was covered with five drift scans whose centers were separated by 1.0 min in right ascension. The seeing FWHM was approximately . The initial processing of the drift scans followed the procedure described in Schneider et al. (1994). The scans were divided into a series of 816x800 images, with an 80 pixel overlap in the scan direction so every object of interest would be entirely contained in one frame. A bias level, calculated from the extended registers stored in the data, was subtracted from each frame, and a one-dimensional flat field was calculated for each detector by median filtering the data. Temporal variations in sky brightness, which appear as a change in background level in the scan direction, were removed from each frame by fitting third-order polynomials to the data.
Optical images were detected using the MIDAS package “inventory”. The magnitude limit was around 23.5 in and 22.5 in . The object positions were corrected for overall systematic position errors along and accross the scan path using the SKICAT scans of the POSS-II Schmidt plates (Weir et al. 1996). We estimate the astrometric accuracy to be better than 0.5′′.
3 Optical spectroscopy
Given the accuracy of the PSPC positions, which were the basis for the early phase of the identifications, and guided by the simulations described in Paper I, we considered any optical object within from the position of the X-ray source as a potential identification. We named optical objects near the X-ray position A, B, …, usually in order of increasing distance from the X-ray position. In a few cases, the X-ray position moved in subsequent analyses based on additional X-ray exposures, and optical objects farther in the alphabet became involved. For each X-ray source, spectra were obtained of optical candidates, more or less in order of brightness, until a probable identification was made (cf. Sect. 4). Finding charts and a full description of the spectra will be published elsewhere (Lehmann et al., in prep.).
3.1 Palomar spectra
Optical spectra for some of the brighter objects were obtained in February and December, 1992 with the 4-Shooter spectrograph (Gunn et al. 1987) at the 5-m Hale telescope. The spectrograph’s entrance aperture is a 1.5 x 100 ′′ slit and the detector an 800 x 800 Texas Instruments CCD. A 200 line mm-1 transmission grating produces spectra from 4500-9500Å at a spectral resolution of 25Å. The data were processed using the procedure given in Schneider et al. (1994). Several of the approx. 20 spectra taken showed that the objects were active galactic nuclei (AGNs), which at the time provided assurance that the celestial positions of the X-ray objects were approximately correct. Spectra for most of these objects were subsequently obtained with the Keck telescope (see below). For 10 objects (8B, 28B, 16A, 62A, 20A, 27A, 9A, 25A, 41C and 52A), the Palomar spectra are the basis for their entry in Table 1 (cf. Sect. 4). These include the three galactic stars among the X-ray sources.
| name | pos | class | ID class | ||||||||||
|---|---|---|---|---|---|---|---|---|---|---|---|---|---|
| 28 | 19.90 | 28B | 18.2 | 10 54 21.3 | 57 25 44.3 | 1 H | 0.29 | g | 0.205 | -22.0 | 43.59 | AGN | c |
| 8 | 11.84 | 8B | 14.1 | 10 51 31.1 | 57 34 39.4 | 1 H | -1.58 | s | star | dMe | |||
| 6 | 8.82 | 6A | 18.4 | 10 53 16.9 | 57 35 52.3 | 1 H | 0.01 | s | 1.204 | -25.6 | 44.89 | AGN | a |
| 32 | 6.50 | 32A | 18.1 | 10 52 39.6 | 57 24 31.7 | 1 H | -0.24 | s | 1.113 | -25.8 | 44.69 | AGN | a |
| 29 | 5.13 | 29A | 19.5 | 10 53 35.1 | 57 25 41.6 | 1 H | 0.22 | s | 0.784 | -23.6 | 44.25 | AGN | b |
| 31 | 3.57 | 31A | 20.0 | 10 53 31.8 | 57 24 53.8 | 0 H | 0.26 | s | 1.956 | -25.0 | 44.97 | AGN | a |
| 16 | 3.56 | 16A | 19.8 | 10 53 39.8 | 57 31 03.9 | 1 H | 0.18 | s | 0.586 | -22.7 | 43.81 | AGN | c |
| 56 | 3.52 | 56D | 18.9 | 10 50 20.2 | 57 14 21.7 | 1 R | -0.19 | s | 0.366 | -22.6 | 43.37 | AGN | b |
| 62 | 3.20 | 62A | 11.0 | 10 52 01.3 | 57 10 45.9 | 2 R | -3.39 | s | star | FG | |||
| 37 | 2.54 | 37A | 19.6 | 10 52 48.2 | 57 21 17.4 | 2 H | -0.05 | s | 0.467 | -22.4 | 43.46 | AGN | b |
| 20 | 2.43 | 20C | 15.5 | 10 54 10.4 | 57 30 37.9 | 2 H | -1.71 | s | star | dMe | |||
| 9 | 1.88 | 9A | 20.0 | 10 51 54.5 | 57 34 37.7 | 0 H | -0.02 | g | 0.877 | -23.4 | 43.92 | AGN | b |
| 41 | 1.87 | 41C | 17.9 | 10 53 18.7 | 57 20 43.9 | 5 H | -0.86 | g | 0.340 | -23.4 | 43.03 | Grp | e |
| 25 | 1.84 | 25A | 20.6 | 10 53 45.0 | 57 28 40.2 | 0 H | 0.21 | s | 1.816 | -24.3 | 44.61 | AGN | a |
| 42 | 1.69 | 42Y | 20.7 | 10 50 16.1 | 57 19 53.8 | 7 P | 0.22 | s | 1.144 | -23.2 | 44.13 | AGN | a |
| 48 | 1.64 | 48B | 19.9 | 10 50 46.2 | 57 17 33.1 | 1 R | -0.12 | g | 0.498 | -22.3 | 43.33 | AGN: | e |
| 12 | 1.57 | 12A | 22.9 | 10 51 48.8 | 57 32 48.4 | 1 H | 1.06 | s | 0.990 | -20.7 | 43.96 | AGN | d |
| 59 | 1.50 | 59A | 16.9 | 10 53 24.8 | 57 12 30.7 | 5 P | -1.36 | g | 0.080 | -21.3 | 41.63 | AGN | c |
| 35 | 1.48 | 35A | 18.9 | 10 50 39.6 | 57 23 36.3 | 1 R | -0.56 | s | 1.439 | -25.5 | 44.29 | AGN | a |
| 117 | 1.46 | 117Q | 22.8 | 10 53 48.8 | 57 30 33.9 | 0 H | 0.99 | s | 0.780 | -20.3 | 43.70 | AGN | d |
| 27 | 1.39 | 27A | 20.3 | 10 53 50.3 | 57 27 09.2 | 0 H | -0.03 | g | 1.720 | -24.5 | 44.44 | AGN | e |
| 73 | 1.39 | 73C | 20.6 | 10 50 09.6 | 57 31 43.5 | 14 P | 0.09 | s: | 1.561 | -24.0 | 44.34 | AGN | a |
| 52 | 1.32 | 52A | 20.4 | 10 52 43.3 | 57 15 44.6 | 2 H | -0.01 | s | 2.144 | -24.8 | 44.63 | AGN | a |
| 11 | 1.27 | 11A | 23.0: | 10 51 08.4 | 57 33 45.4 | 0 H | 1.01 | g | 1.540 | -21.5 | 44.29 | AGN | a |
| 67 | 1.24 | 67B | 20.5: | 10 50 56.2 | 57 06 47.9 | 8 P | -0.48 | s | 0.550 | -21.9 | 43.29 | Grp | e |
| 26 | 1.20 | 26A | 18.7 | 10 50 19.8 | 57 28 12.2 | 6 P | -0.73 | g | 0.616 | -23.9 | 43.39 | AGN | d |
| 55 | 1.17 | 55C | 21.4: | 10 50 09.4 | 57 14 43.3 | 1 P | 0.34 | s: | 1.643 | -23.3 | 44.32 | AGN | a |
| 2 | 1.16 | 2A | 20.1 | 10 52 30.1 | 57 39 13.4 | 2 H | -0.19 | s | 1.437 | -24.3 | 44.18 | AGN | a |
| 54 | 1.12 | 54A | 20.3 | 10 53 07.4 | 57 15 04.6 | 2 H | -0.12 | s | 2.416 | -25.2 | 44.67 | AGN | a |
| 45 | 1.04 | 45Z | 21.1 | 10 53 18.9 | 57 18 50.0 | 2 H | 0.17 | s | 0.711 | -21.8 | 43.46 | AGN | d |
| 19 | 0.99 | 19B | 21.8 | 10 51 37.5 | 57 30 43.2 | 1 H | 0.42 | s | 0.894 | -21.6 | 43.66 | AGN | b |
| 504 | 0.96 | 51D | 20.2 | 10 51 14.5 | 57 16 15.5 | 1 R | -0.23 | s | 0.528 | -22.1 | 43.15 | AGN | d |
| 43 | 0.94 | 43A | 23.0 | 10 51 05.1 | 57 19 23.2 | 2 R | 0.88 | s | 1.750 | -21.8 | 44.28 | AGN | a |
| 36 | 0.92 | see text | – | e | |||||||||
| 46 | 0.89 | 46A | 22.6 | 10 51 20.1 | 57 18 47.9 | 2 R | 0.70 | s | 1.640 | -22.1 | 44.20 | AGN | a |
| 61 | 0.79 | 61B | 20.8 | 10 51 26.3 | 57 11 31.1 | 7 P | -0.07 | g | 0.592 | -21.7 | 43.17 | AGN | b |
| 38 | 0.78 | 38A | 21.3 | 10 53 29.5 | 57 21 03.9 | 2 H | 0.12 | s | 1.145 | -22.6 | 43.79 | AGN | a |
| 60 | 0.78 | 60B | 21.6 | 10 52 48.5 | 57 12 06.0 | 3 P | 0.24 | g | 1.875 | -23.4 | 44.27 | AGN | a |
| 14 | 0.72 | see text | – | e | |||||||||
| 47 | 0.71 | 47A | 21.9 | 10 52 45.0 | 57 17 33.4 | 5 H | 0.32 | g | 1.058 | -21.9 | 43.68 | AGN | a |
| 30 | 0.70 | 30A | 21.5 | 10 52 57.3 | 57 25 07.1 | 1 H | 0.15 | s | 1.527 | -23.0 | 44.02 | AGN | a |
| 51 | 0.66 | 51L | 21.1 | 10 51 17.0 | 57 15 51.4 | 5 P | -0.03 | s | 0.620 | -21.5 | 43.14 | AGN | d |
| 17 | 0.62 | 17A | 20.3 | 10 51 04.0 | 57 30 54.0 | 2 H | -0.38 | s | 2.742 | -25.4 | 44.54 | AGN | a |
| 814 | 0.61 | 37G | 20.5 | 10 52 44.8 | 57 21 23.2 | 2 H | -0.31 | s | 2.832 | -25.3 | 44.57 | AGN | a |
| 84 | 0.60 | see text | – | e | |||||||||
| 77 | 0.59 | 77A | 21.7 | 10 52 59.3 | 57 30 30.2 | 1 H | 0.16 | s | 1.676 | -23.0 | 44.04 | AGN | a |
| 53 | 0.58 | 53A | 18.4 | 10 52 06.3 | 57 15 24.7 | 5 P | -1.17 | g | 0.245 | -22.2 | 42.22 | GAL | e |
| 116 | 0.57 | see text | – | e | |||||||||
| 23 | 0.56 | 23A | 21.9 | 10 52 24.7 | 57 30 09.6 | 1 H | 0.22 | g | 1.009 | -21.8 | 43.53 | AGN | b |
| 58 | 0.56 | 58B | 21.4 | 10 52 38.8 | 57 12 59.7 | 10 P | 0.02 | g | 0.629 | -21.3 | 43.08 | Grp | e |
-
a
For a description of the entries, cf. Sect. 3, and for a discussion of the ID classes, cf. Sect. 4.
3.2 Keck spectra
Spectra for all remaining optical objects were taken with the Low Resolution Imaging Spectrometer (LRIS) (Oke et al. 1995) at the cassegrain focus of the Keck 10-m telescope in February and December 1995, April 1996 and April 1997. The slit width is either 10 or 07 and the detector is a back-illuminated 2048 x 2048 Tektronics CCD. A 300 line mm-1 reflection grating produces spectra from 3800-8200Å at a spectral resolution of around 10Å. In order to minimize slit losses due to atmospheric selective refraction, we generally rotated the instrument so that the projection of the slit on the sky was vertical.
The raw data frames were bias-subtracted and flatfield corrected. The extraction of one-dimensional spectra from the two-dimensional sky-subtracted spectra was done using the optimal extraction algorithm for CCD spectroscopy described by Horne (1986). Third order polynomials were fitted to the lines of the He-Ar or Hg-Kr spectrum observed before or after the object spectrum to determine the wavelength scale. The flux calibration of the spectra was obtained using secondary standard stars for spectrophotometry (Oke & Gunn 1983). An atmospheric correction function for the broad molecular absorption bands (H2O, O2) was derived from the spectra of the standard stars and applied to all other spectra.
4 Optical identifications and source classifications
In this section, we define systematically the process followed in obtaining optical identifications of the X-ray sources. In order to facilitate this description, we introduce five identification classes (ID class), which categorize the process of identification and classification used in each class.
The primary goal is to obtain the optical identification of the X-ray source, i.e., the correct association of the X-ray source with an optical object. Once the identification has been made, the redshift of the X-ray source is obtained from that of the optical object. The classification of the source (star, galaxy, cluster of galaxies, AGN, etc.) is usually made on the basis of its optical properties. For some ID classes, we will also use the X-ray properties in classifying the source.
Since the surface density of optical objects that can be observed is much larger than that of the X-ray sources in our survey, the identification depends on finding an optical object within the X-ray error circle that has some unusual properties. In practice, we find for about half of the sources an optical object with broad emission lines, that we recognize as an AGN. We discuss these objects below under ID classes , and argue that AGNs are so rare that their detection near the X-ray source constitutes an almost certain identification of the X-ray source.
Among the remaining sources, we find optical objects with [Ne v] or [Ne iii] emission (ID class ). We argue that [Ne v] is indicative of soft X-ray emssion, confirming the identification of the optical object with the X-ray source. For each of the two emission lines, we argue that they are rarely observed and confirm the optical identifications. On the basis of the Ne emission and the high X-ray luminosities, we classify the objects as AGNs.
For the remaining sources, we cannot find within the X-ray error circle optical objects with unusual properties (ID class ). For these sources we use the ratio of X-ray flux to optical flux as additional tool in our classification procedure. This ratio is independent of distance and allows distinguishing different classes of X-ray sources (cf. Stocke et al. 1991). Once brighter optical objects (with smaller values of ) have been eliminated as candidate identifications, we find for most of the objects in ID class that the ratio is so large that the X-ray source cannot be a galaxy.
Clusters and groups of galaxies show approximately the same range of as AGNs (cf. Stocke et al. 1991). We do not see a rich cluster of galaxies on the CCD images at the position of most of the X-ray sources in ID class . Therefore, among the known object classes typically associated with X-ray sources, they could in principle be AGNs or groups of galaxies. The intragroup medium in poor groups of galaxies has been identified as an important class of X-ray emitters through studies with ROSAT (Mulchaey et al., 1996). In these objects a small number of galaxies is surrounded by diffuse X-ray halos with a typical linear diameter of 50-400 kpc and X-ray luminosities in the range erg s-1. Often the peak of the X-ray emission is not centered on any one galaxy, but in some cases a cooling flow is centered on a dominant galaxy (see also Stocke et al., 1991). The local volume density of these groups (Henry et al., 1995) is large enough, that some higher redshift objects of this class are expected to show up in our survey. Similar objects at a redshift of 0.5 would have X-ray angular diameters (FWHM) of , and fluxes in the range erg cm-2 s-1. The optical galaxies in these groups would often be seen at 10′′ from the centroid of the X-ray emission.
Table 1 provides a complete list of the X-ray sources of the survey and the properties of their optical identifications. The first two columns give the name of the X-ray source and its flux in units of erg cm-2 s-1 in the keV energy band (cf. Paper I). The next four columns give the name of the optical object identified with the X-ray source, its magnitude , and its right ascension and declination at epoch 2000. The next column gives the distance of the optical object to the X-ray source in arcsec and indicates whether the X-ray position is mainly based on the 207 ksec PSPC pointing (P), the 1112 ksec HRI pointing (H) or the 205 ksec HRI raster scan (R). Next we list the ratio as defined by Stocke et al. (1991), a morphological parameter that is either s = star or g = galaxy, and the redshift . The next two columns give the optical absolute magnitude (assuming , corresponding to a power law spectral index of ) and the X-ray luminosity in units of erg s-1 in the keV energy band (assuming an energy spectral index of ). In deriving these luminosities, we used 50 km s-1 Mpc-1 and 0.5. The last two columns give the classification of the object and the ID class. The ID class characterizes the identification and classification procedure discussed in the next section.
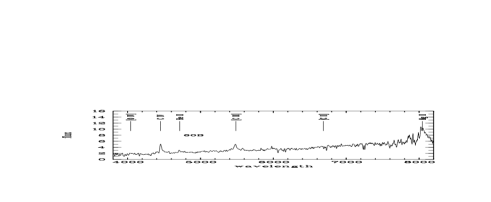
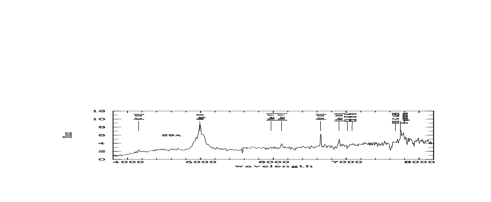
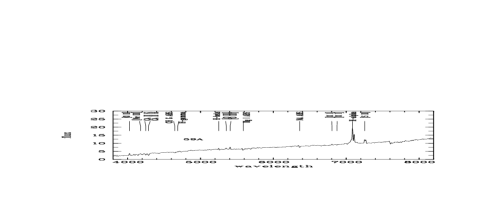
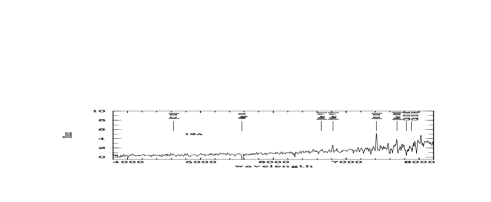
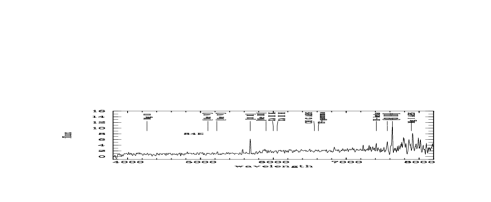
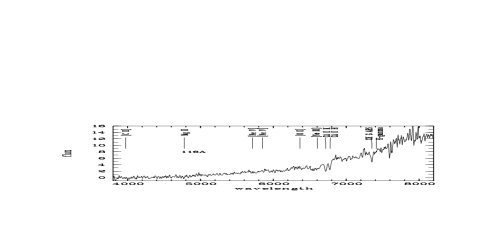
Among the 50 X-ray sources in Table 1, we identify three as galactic stars. For the remaining objects the identification and classification procedure is discussed in some detail below, according to its ID class, which for each object is given in Table 1. We show in Fig. 1 Keck LRIS spectra illustrating the various ID classes discussed below.
4.1 ID class
The ID classes are all based on the detection of broad emission lines that are characteristic of AGNs. The ID class applies to objects whose spectra show broad Mg ii and C iii] emission and, at sufficiently large redshifts, C iv and Ly emission. Most of the 21 objects in this class have high optical luminosities and are classical quasars (QSOs). All of the 21 are classified as active galactic nuclei (AGNs).
ID class is assigned to 7 objects that show broad Mg ii emission lines and ID class to 3 objects that exhibit broad emission from H (16A) or H (28B, 59A). Among the class objects, three (56D, 37A, and 9A) also show broad H emission.
In all these cases, we believe that the object is an AGN. And since AGN are both rare and generally strong X-ray sources, we consider the optical object to be the identification of the X-ray source. This procedure may of course produce field AGNs that are not responsible for the X-ray emission. We estimate the number of such misidentifications as follows. The surface density of broad-line AGNs with is around 115 deg-2 (Zitelli et al. 1992). This includes both quasars () and Seyfert galaxies (). Extrapolating the observed counts to fainter magnitudes with a slope similar to that observed in the range , a total surface density of AGNs deg-2 has been estimated at (Zamorani 1995). For a power law, corresponds to , which is approximately the faint limit of the identifications listed in Table 1. For a surface density of 365 deg-2, the number of field AGNs expected in 50 circles of radius is .
4.2 ID class
We use ID class to cover objects that do not exhibit the emission features shown in ID classes , but that show Ne emission lines. Four objects (12A, 117Q, 51D, and 51L) exhibit [Ne v] 3426 emission. Since the ionization potential of Ne+++ is 97 eV, corresponding to soft X-ray emission, the presence of [Ne v] emission essentially confirms the optical identification of the X-ray source. (Among the objects of ID class discussed above, we see [Ne v] emission in the spectra of four of them.) With the identification of the optical object confirmed and therefore the redshift of the X-ray source established, we find that the X-ray luminosity of all four sources is above erg s-1, far higher than that of galaxies, and we conclude that they are AGNs.
Two objects (26A and 45Z) show relatively strong [Ne iii] 3869 emission. This feature, although seen also in field galaxies with emission lines (cf. Hammer et al. 1997), is typically stronger in the spectra of quasars and Seyfert galaxies. Among the 10 AGNs of ID class in which the [Ne iii] emission is in the accessible spectral range, we see it in 7 cases. In all cases where we see [Ne v] emission, we also observe [Ne iii] if it is accessible. Object 26A also exhibits Fe ii 2600 absorption, which has been seen in spectra of broad absorption line quasars (Becker et al. 1997). We accept the two objects as the optical identifications, and then (as for the [Ne v] cases above) from the redshifts and the X-ray luminosities conclude that the objects are AGNs.
4.3 ID class
In ID class , we discuss the remaining objects that have galaxy counterparts without broad emission lines and without rare spectral features such as Ne emission lines. We have 10 objects with ID class in Table 1, of which four exhibit [O ii] emission. Claims have been made (Griffiths et al. 1996, McHardy et al. 1997) that a significant fraction of the weaker X-ray sources are narrow-emission line galaxies (NELG), characteristically showing strong [O ii] 3727 emission, and that these constitute a new population of X-ray sources. Recent galaxy surveys have revealed that a large fraction of faint field galaxies show [O ii] emission (cf. Hammer et al. 1997). Our own spectral work at Palomar and Keck has recorded spectra of 24 galaxies near the objects listed in Table 1 that have redshifts different from the optical identifications. Among these field galaxies, 19 exhibit [O ii] emission, i.e., 79% of field galaxies are NELGs. The detection of a NELG can therefore not be taken as evidence for the correct identification of an X-ray source.
Since the optical spectra of possible X-ray counterparts in ID class are undistinguished, we introduce two additional criteria by which to identify and classify the objects. The first criterion is the ratio of X-ray and optical flux which is independent of distance (cf. Stocke et al. 1991). In Fig. 2, we plot vs. the flux for the 37 AGNs of ID class that we have identified so far, and for all AGNs and galaxies in the Extended Medium-Sensitivity Survey (EMSS, Stocke et al. 1991). Stocke et al. noted that essentially all AGNs in the EMSS are in the range . Among the 37 Lockman AGNs plotted, 36 have . There is no evidence from Fig. 2 for evolution of the ratio of AGNs; for galaxies no or little effect of evolution would be expected given their relatively small redshifts.

The second criterion we considered is the angular extent of the X-ray emission. A rigorous determination of the X-ray extent for all sources has not been part of our analysis scheme because it breaks down in the presence of significant confusion (see Paper I). Therefore the extent has been estimated a posteriori for the objects in question by fitting a two-dimensional Gaussian to the HRI and PSPC images and comparing this to other nearby X-ray sources. Sizes are given in FWHM, approximately corrected for the size of the PSF. If a faint object is extended, it may be missed by the HRI observations, which are less sensitive for low surface brightness emission. On the other hand, the HRI may pick up some sharper structure within diffuse emission. Because of its softer response it is actually more sensitive to detect cooling flows. As noted before, optical galaxies in X-ray emitting poor groups would often be seen at positions outside the X-ray error circle. For an extended X-ray source we consider the detection of two or more galaxies at the same redshift as supporting the group identification.
In summary, while the X-ray emission from AGNs and single galaxies should be point-like and centered on the optical counterpart, clusters and groups of galaxies may have extended X-ray emission (and therefore reduced HRI fluxes relative to PSPC fluxes), that is displaced from one or more galaxies. The discussion given below for each of the sources takes into account these additional criteria in order to illuminate whether it is more likely to be an AGN, a group of galaxies or something else.
Object 41 is extended by about 22′′ in both directions on the 1112 ksec HRI exposure and by 50′′ in the PSPC exposure. Optically, a dense group of galaxies is visible, of which 41C is the brightest member. Several other galaxies are at the same redshift as 41C. We classify the object as a group of galaxies, although it could be a cluster.
Object 48 is not extended in the PSPC exposure. It is seen as a point source in the HRI raster scan, well centered on the galaxy 48B but is not covered by the deep HRI pointing. Two other galaxies, at 9′′ and 85′′ from the X-ray source, have the same redshift as 48B. The object has a high ratio. Considering the excellent coincidence of the optical and the HRI position and the absence of evidence for an extent in X-rays, we consider 48B to be the optical identification. On the basis of its X-ray luminosity and ratio, we classify this object as an AGN, although this classification has to be considered uncertain.
Object 27 is a complex case. The PSPC X-ray position is consistent with that of the optical quasar 27A. Early parts of the 1112 ksec HRI exposure show a source 10′′ SE of 27A but the more recent HRI exposures produce a source position less than 1′′ from 27A. Apparently, there are two variable sources involved. Since the survey is defined by the epoch of the PSPC observations, we identify the X-ray source with 27A.
Object 67 appears complex in the PSPC image. It is near the edge of the field, at 177 from the center. It is barely detected on the HRI raster scan, suggesting a substantial extension in X-rays. The galaxy 67B has =-0.48. Three other galaxies in the error box have the same redshift as 67B. We classify the object as a group.
Object 36 is another case where variability plays a role. The source 36 is based on the PSPC exposures. The deep HRI survey shows an X-ray source (designated as number 870) about 15′′ to the south of 36. Near this position, we found the optical object 36F, which is an AGN at redshift 0.8, and clearly the identification. However, the HRI raster scan, which only recently produced accurate positions after an astrometrical solution provided by the ultradeep HRI pointing (see Paper I), clearly confirms the PSPC position and does not show an object near 36F. It thus appears that there are two X-ray sources and that 36F is strongly variable. Since, as stated, our survey is defined by the epoch of the PSPC observations, source 870 is not part of the current survey. We have resumed work to identify source 36, but it is incomplete so far.
| Surveya | Areab | Tc | AGN | GAL | unid. | FCf | FLg | FUh | ||
|---|---|---|---|---|---|---|---|---|---|---|
| CRSS | 3.9 | 6 | 2.0 | 123 | 55% | 10% | ||||
| DRS | 1.4 | 0.3 | 194 | 55% | 10% | 18% | 8% | 38% | 13% | |
| NEP | 0.2 | 79 | 1.0 | 20 | 65% | 0% | 10% | 5% | 4% | 5% |
| UKDS | 0.2 | 110 | 0.2 | 70 | 46% | 26% | 16% | 8% | 41% | 26% |
| RDS | 0.3 | 207 | 0.5 | 50 | 78% | 2% | 8% | 6% | 8% | 5% |
-
a
cf. text for explanation of acronyms
-
b
approximate, in square degrees
-
c
PSPC exposure time, in ksec
-
d
limiting flux in units of erg cm-2 s-1
-
e
number of X-ray sources detected
-
f
fraction of output sources that are contaminated, based on simulations
-
g
fraction of input sources that are lost, based on simulations
-
h
fraction of output sources that are unidentifiable, based on simulations
Object 14 appears as a point source in both the PSPC and the 1112 ksec deep HRI exposures. The optical object nearest to the HRI position is a galaxy at a distance of 7′′. It has , , and its spectrum has no broad emission lines or Ne emission. The interpretation of this object depends critically on whether it is strictly a point source or has an X-ray extension of, say, 20′′ that might well have escaped detection. If the source is extended, the galaxy might be a member of a group of galaxies that is the X-ray source. If on the other hand, the X-ray source is strictly a point source, then the galaxy is unlikely to be the identification: simulations discussed in Paper I show that the probability that an HRI point source of this X-ray flux would appear at a distance of 7′′ in our survey is around 2%. Since a Keck CCD-image shows that there is no object brighter than in the HRI error circle, the single X-ray source would have , which would be truly outstanding. We cannot decide between a group of galaxies and an X-ray intense point source at the present time.
Object 84 appears to be a case similar to that of object 14. The PSPC and HRI images are probably not extended. Two galaxies at about 14′′ from the X-ray source have the same redshift. The spectrum of the brighter galaxy (84E, , ) is illustrated in Fig. 1. There is no object in a deep -band Keck image within the HRI error circle. The case for a group of galaxies is somewhat stronger here, since we do have two galaxies with the same redshift. On the other hand, if object 14 is a single object with large then 84 might be another such case. We cannot decide between a group of galaxies and an X-ray intense point source at the present time.
Object 53A shows H emission with FWHM = 321 km/sec consistent with instrumental broadening and it has . Accordingly, we classify the optical object as a galaxy. At the redshift of the galaxy, the X-ray luminosity () is low for an AGN and rather high for a galaxy. The galaxy is located about midway between two bright M-type stars (neither of which is an important contributor to the X-ray emission).
Object 116 is extended by about 50′′ EW on the PSPC exposure. It is marginally seen on the 1112 ksec HRI exposure and probably extended. Three galaxies at distances of 3′′, 8′′ and 10′′ from the center of the PSPC error box, however, all have different redshifts (0.708, 0.408 and 0.610, respectively). We cannot present an optical identification at present.
Object 58 appears extended in the EW direction on the PSPC exposure, by about 40′′. The object is not detected on the 1112 ksec HRI exposure, consistent with its PSPC extent. At a distance of 14′′ from the PSPC position there is the galaxy 58B which has . Another galaxy at a distance of 11′′ from the center of the error box is at the same redshift. We classify the object as a group of galaxies.
5 Comparison with other ROSAT PSPC surveys
Several medium and deep surveys conducted with the PSPC on board ROSAT have been published in the past several years. We are interested in comparing our results with those surveys in which optical identification and spectroscopy have been carried out for the majority of the detected X-ray sources. These are:
-
–
The Cambridge-Cambridge ROSAT Serendipity Survey (CRSS, Boyle et al. 1995)
-
–
A deep ROSAT survey (DRS, Georgantopoulos et al. 1996)
-
–
The ROSAT North Ecliptic Pole Deep Survey (NEP, Bower et al. 1996)
-
–
The UK ROSAT deep field survey (UKDS, McHardy et al. 1997)
We list in Table 2 the properties of the surveys (the present survey is denoted as RDS), as well as the fractions identified as AGNs and galaxies. In general, the area covered by a given survey varies with limiting flux. The limiting fluxes given in Table 2 are those mentioned in the quoted references and generally refer to the weakest X-ray sources in the sample.
The fraction of sources identified as AGNs in the RDS is larger than that in all other surveys. This is partly due to the high quality of the Keck LRIS spectra and partly due to our classification procedure. In particular, we have used evidence based on the presence of [Ne v] or [Ne iii] emission, together with the high X-ray luminosity to classify 6 objects (12%) as AGNs that otherwise might have been classified as galaxies.
We can carry out a direct comparison of the RDS with the two shallower surveys. Based on the CRSS AGN and galaxy percentages, we would expect to find among the 11 RDS sources above erg cm-2 s-1 six AGNs and one galaxy, whereas we observe eight AGNs and no galaxies. Similarly, based on the NEP AGN percentage, we would expect in the RDS above erg cm-2 s-1 20 AGNs, whereas we observe 25. We conclude that the percentages of AGN and galaxies for the CRSS, the NEP and the RDS are not significantly different.
The DRS and the UKDS have lower quoted limiting fluxes than the RDS, even though their exposure times are shorter. Given the simulations discussed in Paper I, this raises concerns about the effects of confusion. We show in Table 2 the three F-factors derived from simulations relevant to the different surveys, as described in Paper I. The contamination factor represents the fraction of output sources that have a flux in excess of 1.5 times the nearest input source (if within 15′′) augmented by 3. In practice, more than half the photons of these output sources did not originate from the nearby input source. The loss factor is the fraction of input sources that do not have an output source within ′′. These input sources are not detected at all or have lost their identity and in practice cannot be optically identified. The factor is the fraction of output sources that has no input source within 15′′. It therefore represents the unidentifiable fraction of the detected sources.
The loss factors for the DRS and the UKDS show that 38 and 41%, respectively, of the input sources (i.e., the real sources in the field) are lost. In contrast, the NEP and the RDS lose only 4 and 8% of the input sources. Actually, since in the RDS the 1112 ksec HRI survey covers about 2/3 of the PSPC field, the effective values of and are less than those given in Table 2.
Among the sources that are detected, the factor for the UKDS suggests that 26% should be unidentifiable. McHardy et al. (1997) state that 11 out of 70 sources, or 16%, are unidentified. The discrepancy between these two percentages raises the question whether some of the unidentifiable sources in the UKDS may have been identified incorrectly. We suspect that this is the case, and that the misidentifications involve the NELGs which are claimed to be a new population of X-ray sources (Griffiths et al. 1996, McHardy et al. 1997). As discussed in Sect. 4.3, NELGs make up such a large fraction of faint field galaxies that the presence of a NELG in the X-ray error circle cannot be taken to confirm its identification of the X-ray source.
6 Discussion and conclusion
Our procedure to identify and classify the weak X-ray sources in the RDS depends on the angular extent of the object. For stars and AGNs (cf. ID classes ) which are point sources both in X-rays and optically, we require positional agreement between the X-ray and the optical source. As can be seen for the objects of ID class in Table 1, the average offset between X-ray and optical positions is for PSPC positions and less than for HRI positions. Identifications are based, first on the presence of broad emission lines, second on the combination of the presence of [Ne v] emission and high X-ray luminosity, and third on the presence of relatively strong [Ne iii] emission. We argue that the presence of one or more broad emission lines in the spectrum of an optical object near the X-ray source signifies an AGN, and that these are sufficiently rare that this essentially confirms the identication. The presence of [Ne v] is taken to be indicative of soft X-ray emission, confirming the optical object as the identification of the X-ray source, and the high X-ray luminosity derived from the redshift signifies an AGN. Given the rare ocurrence of strong [Ne iii] emission, its presence is also considered to confirm the identification.
For the remaining 10 objects, of ID class , the identification procedure is quite different. Many of these objects have extended X-ray emission and some have a low HRI flux or a positional offset between HRI and PSPC. X-ray variability is seen in two cases, complicating the identification procedure. Generally, the ratio is fairly large, suggesting that the object is an AGN or a group or cluster of galaxies. We take evidence for X-ray source extension and the presence of several galaxies at the same redshift as suggestive of identification with a group of galaxies, even though we have not systematically explored galaxies near the X-ray source.
Applying these classification rules, we find 39 AGNs, 3 groups of galaxies, 1 galaxy and 3 stars. Among the AGNs, 16 have , corresponding to which according to the luminosity criterion of Schmidt & Green (1983) would qualify them as quasars, while the other 23 AGNs according to their optical luminosities are Seyfert galaxies. Among the four sources that remain unidentified, the observations for object 36 are not complete, while source 116 is most likely a group of galaxies. The most intriguing X-ray sources are objects 14 and 84, for which there is no evidence for source extension and where the ratio , larger than any shown in Fig.2. However, if these sources have modest extension that could have remained undetected so far, they could still be groups of galaxies, as discussed in Sect. 4.3.
Roche et al. (1995), Shanks et al. (1996) and Almaini et al. (1997) find evidence for a significant cross-correlation between galaxies and weak unidentified X-ray sources. Almaini et al. find that galaxies account for 23% of the X-ray background at 1 keV. This finding is qualitatively consistent with the substantial fraction of AGNs which are morphologically classified as galaxies in our survey (see Table 1). Further analysis is required to understand the relationship between these results in detail.
The fraction of X-ray sources with reliable optical identifications and redshifts in the RDS is higher than that in any previously published X-ray survey. This is a consequence of the realistic X-ray flux limits we used based on simulations, the role of deep HRI exposures for many of the sources in the central part of the PSPC field and the high quality of most of the Keck spectra obtained with LRIS. While the survey is based on sources selected above given flux limits based on PSPC exposures, the effect of the subsequent HRI imaging was considerable. In the early phase of the identification work, X-ray positions were based on PSPC images. In most cases, the identifications obtained were confirmed later by the much more accurate HRI positions. In two cases, the HRI managed to resolve confusion in the PSPC image, resulting in each case in an object pair, 37A+37G and 51D+51L, respectively. The HRI exposures also played a significant role in the realization that a number of X-ray sources are not associated with single objects but rather are possible groups of galaxies (e.g., object 58), either by directly confirming their extent or showing an offset between X-ray and optical positions.
We discuss claims in the literature for the appearance of a new population of weak X-ray sources in the form of narrow-emission line galaxies (NELG). We note that these claims are made on the basis of surveys that according to our simulations are strongly affected by confusion, leading to a substantial number of detected sources that are unidentifiable. Given that a large percentage of faint field galaxies are actually NELGs, we suggest that some of the unidentifiable sources identified as NELG are field galaxies that have no relation to the X-ray source. We do not claim that there cannot exist a new population among the weaker X-ray sources. Given the natural uncertainties that accompany the identification of objects of ID class , such a new population could only be found in surveys with conservative flux limits in which confusion plays a minor role.
We will address in a subsequent communication the luminosity functions of the extragalactic X-ray sources and the origin of the X-ray background at energies below 2 keV.
-
Acknowledgements.
The ROSAT project is supported by the Bundesministerium für Forschung und Technologie (BMFT), by the National Aeronautics and Space Administration (NASA), and the Science and Engineering Research Council (SERC). The W. M. Keck Observatory is operated as a scientific partnership between the California Institute of Technology, the University of California, and the National Aeronautics and Space Administration. It was made possible by the generous financial support of the W. M. Keck Foundation. We thank the Institute for Astronomy of the University of Hawaii, Palomar Observatory, and the National Optical Astronomy Observatories for grants of observing time. We thank Bev Oke and Judy Cohen for their efforts in the construction of LRIS, E. Wyckoff and B. McLean for assistance in the photometric and astrometric reduction of the CCD images taken with the University of Hawaii 2.2 m telescope, and R. de Carvalho and G. Djorgovski for providing us with data from the POSS-II catalogue in our field. We thank an anonymous referee for carefully reading the manuscript and suggesting important improvements. M.S. thanks the Alexander von Humboldt-Stiftung for a Humboldt Research Award for Senior U.S. Scientists in 1990-91; and the directors of the Max-Planck-Institut für extraterrestrische Physik in Garching and of the Astrophysikalisches Institut Potsdam for their hospitality. This work was supported in part by NASA grants NAG5-1531 (M.S.), NAG8-794, NAG5-1649, and NAGW-2508 (R.B. and R.G.), NAG5-1538 and NAG8-1133 (R.B.), and NSF grants AST86-18257A02 (J.G.) and AST95-09919 (D.S.). G.H. acknowledges the DARA grant FKZ 50 OR 9403 5. G.Z. acknowledges partial support by the Italian Space Agency (ASI) under contract ASI 95-RS-152.
References
- 1 Almaini O., Shanks T., Griffiths R.E., et al., 1997, MNRAS submitted (astro-ph/9704117)
- 2 Becker R., Gregg M.D., Hook I.M., et al., 1997, ApJ 479, L93
- 3 Bower R.G., Hasinger G., Castander F. J., et al., 1996, MNRAS 281, 59
- 4 Boyle B.J., McMahon R.G., Wilkes B.J., Elvis M., 1995, MNRAS 272, 462
- 5 Chevalier C., Ilovaisky S.A., 1991, A&AS, 90, 225
- 6 De Ruiter H.R., Zamorani G., Parma P., et al., 1997, A&A 319, 7
- 7 Georgantopoulos I., Stewart G.C., Shanks T., et al., 1996, MNRAS 280, 276
- 8 Giacconi R., Gursky H., Paolini F.R., et al., 1962, Phys. Rev. Lett. 9, 439
- 9 Griffiths R.E., Della Ceca R., Georgantopoulos I., et al., 1996, MNRAS 281, 71
- 10 Gunn J.E., Carr M.L., Danielson G.E., et al., 1987, Opt. Eng. 26, 779
- 11 Hasinger G., Burg R., Giacconi R., et al., 1993, A&A 275, 1
- 12 Hasinger G., Burg R., Giacconi R., et al., 1997, A&A in press (Paper I)
- 13 Hammer F., Flores H., Lilly S.J., et al., 1997, ApJ 481, 49
- 14 Henry J.P., Gioia I.M., Huchra J.P., et al., 1995, ApJ 449, 422
- 15 Horne K., 1986, PASP 98, 609
- 16 Lockman F.J., Jahoda K., McCammon D., 1986, ApJ 302, 432
- 17 MacKenty J.W., Griffiths R.E., Sparks W.B., et al., 1992, “Wide Field Planetary Camera Instrument Handbook (Version 3.0)”, Space Telescope Science Institute Pub.
- 18 McHardy I.M., Jones L.R., Merrifield M.R., et al., 1997, MNRAS submitted (astro-ph/9703163)
- 19 Mulchaey J.S., Davis D.S., Mushotzky R.F., Burstein D., 1996, ApJ 456, 80
- 20 Oke J.B., Cohen J.G., Carr M., et al., 1995, PASP 107, 375
- 21 Oke J.B., Gunn J.E. 1983, ApJ 266, 713
- 22 Postman M., Lubin L.M., Gunn J.E., et al., 1996, AJ 111, 615
- 23 Roche N., Shanks T., Georgantopoulos I., et al., 1995, MNRAS 273, L15
- 24 Schmidt M., Green R.P., 1983, ApJ 269, 352
- 25 Schneider D.P., Schmidt M., Gunn J.E., 1994, AJ 107, 1245
- 26 Shanks T., Almaini O., Boyle B.J., et al., 1996, in: Zimmermann H.U., Trümper J.E., Yorke H. (eds.) Röntgenstrahlung from the Universe, MPE Report 263, 341
- 27 Stocke J.T., Morris S.L., Gioia I.M., et al., 1991, ApJS 76, 813
- 28 Valdes F., 1982, FOCAS Users Manual (Tucson, NOAO)
- 29 Weir N., Fayyad U.M., Djorgovski S.G., et al., 1995, PASP 107, 1243
- 30 Zamorani G., 1995, in: Walsh J.R., Danziger I.J. (eds.) Science With VLT, ESO Ap. Symp., Springer, Berlin, p. 402
- 31 Zitelli V., Mignoli M., Zamorani G., Marano B., Boyle B.J., 1992, MNRAS 256, 349