The Origin of the Brightest Cluster Galaxies
Abstract
Most clusters and groups of galaxies contain a giant elliptical galaxy in their centres which far outshines and outweighs normal ellipticals. The origin of these brightest cluster galaxies is intimately related to the collapse and formation of the cluster. Using an N-body simulation of a cluster of galaxies in a hierarchical cosmological model, we show that galaxy merging naturally produces a massive, central galaxy with surface brightness and velocity dispersion profiles similar to observed BCG’s. To enhance the resolution of the simulation, 100 dark halos at are replaced with self-consistent disk+bulge+halo galaxy models following a Tully-Fisher relation using 100000 particles for the 20 largest galaxies and 10000 particles for the remaining ones. This technique allows us to analyze the stellar and dark matter components independently. The central galaxy forms through the merger of several massive galaxies along a filament early in the cluster’s history. Galactic cannibalism of smaller galaxies through dynamical friction over a Hubble time only accounts for a small fraction of the accreted mass. The galaxy is a flattened, triaxial object whose long axis aligns with the primordial filament and the long axis of the cluster galaxy distribution agreeing with observed trends for galaxy-cluster alignment.
1 Introduction
The brightest cluster galaxies (BCG’s) are the most luminous and massive galaxies in the universe. A typical BCG is located near the centre of its parent cluster and well-aligned with the cluster galaxy distribution suggesting that it lies at the bottom of the cluster’s gravitational potential well. The general impression that stars have settled to the bottom of a pit suggests that the origin of BCG’s is closely connected to the formation of the cluster. BCG’s are elliptical galaxies that are much brighter and much more massive than the average with luminosities 10 L∗ ( L⊙), (e.g., Sandage & Hardy 1973; Schombert 1986; Brown 1997) Sandage & Hardy (1973)Schombert (1986)Brown97 central velocity dispersions in the range km/s (e.g., Dressler 1979; Carter et al. 1985; Fisher, Illingworth & Franx 1995)Dressler (1979)Carter85 Fisher et al. (1995) and very little rotational support. Like other ellipticals, their light profile is well-described by a deVaucouleurs surface brightness law, over a large range in radii (deVaucouleurs 1948)deVaucouleurs (1948). The BCG’s are variously classified as giant ellipticals (gE), as D galaxies which have somewhat shallower light profiles than E’s and the final classification cD for D galaxies with an extended envelope of excess light over and above a deVaucouleurs law fit to the inner regions (Kormendy 1989)Kormendy (1989). cD galaxies are also only found in the centres of clusters and groups so their extended envelope is probably associated with the formation of the cluster.
The following theories have been proposed to explain the origin of BCG’s, i) star formation from cooling flows expected in the high density, rapidly cooling centres of cluster X-ray halos (Fabian 1994)Fabian (1994), ii) galactic cannibalism or the accretion of the existing galaxy population through dynamical friction and tidal stripping (Ostriker & Tremaine 1975; Richstone 1976; Ostriker & Hausman 1977)Ostriker & Tremaine (1975)Richstone (1976)Ostriker & Hausman (1977) and iii) galaxy merging in the early history of the formation of the cluster as expected in hierarchical cosmological models (Merritt 1985; Tremaine 1990)Merritt (1985)Tremaine (1990). The cooling flow theory implies the creation of lots of new stars but generally there is weak evidence for this population (McNamara & O’Connell 1989)McNamara & O’Connell (1989). The galactic cannibalism picture fails when worked out in detail since the dynamical friction timescales are generally too long and so the expected amount of accreted luminosity falls short by an order of magnitude for making up a BCG’s luminosity (Merritt 1985; Lauer 1985; Tremaine 1990)Merritt (1985)Tremaine (1990)Lauer (1985). The failure of this model implies that BCG’s must have an earlier origin and that galaxy merging within the cluster during collapse in a cosmological hierarchy is a possible alternative. The strong tendency for BCG’s to align with their cluster population (Sastry 1968; Carter et al. 1980; Binggeli 1982; West 1994)Sastry (1968)Carter80 Binggeli82 West (1994) also implies an origin coinciding with cluster collapse.
Most of the work on the formation of giant ellipticals has been based on studies of merging groups of several disk galaxies (Barnes 1989; Weil & Hernquist 1996) or small virialized clusters of spherical galaxies (Funato, Makino & Ebisuzaki 1993; Bode et al. 1994; Garijo, Athanassoula & Garcia-Gomez 1997). These simulations reveal the high efficiency of dynamical friction in driving galaxy merging and the general tendency to produce remnants resembling elliptical galaxies. However, they are phenomenological studies that are still considerably detached from the context of hierarchical collapse in which elliptical galaxies and BCG’s probably form. In this paper, we explore galaxy merging in a detailed cosmological simulation of cluster collapse including a realistic distribution of disk galaxies embedded in dark halos and show that it produces a consistent and quantitative picture for the origin of BCG’s.
2 Merging and the Formation of Elliptical Galaxies
The formation histories of BCG’s and ordinary elliptical galaxies are closely linked. Elliptical galaxies most likely form through the dissipationless merger of smaller spiral or elliptical galaxies (Toomre & Toomre 1972; Toomre 1977), Toomre & Toomre (1972)Toomre (1977) while the spirals themselves form dissipatively as gas cools radiatively and sinks to the centre of a dark halo (White & Rees 1978)White & Rees (1978). When galaxies collide, dynamical friction combined with strong time-dependent mutual tidal forces redistribute the ordered orbital kinetic energy into random energy allowing the galaxies to merge into an amorphous, triaxial system resembling an elliptical galaxy (Barnes 1988; Hernquist 1992,1993; Barnes & Hernquist 1992ab) Barnes92b Barnes88 Barnes92a Hernquist (1992)Hernquist (1993). In the various N-body studies of mergers of galaxy pairs, analysis of the merger remnants show that they have light profiles and kinematics similar to observed ellipticals, although the match is not perfect. The simulation of the merger of groups of galaxies (Barnes 1989; Weil & Hernquist 1996)Barnes89 Weil & Hernquist (1996) which is more closely related to the formation of BCG’s give generally similar results to the merger of galaxy pairs. Simulated merger remnants generally have deVaucouleurs profiles, although the cores can be less dense than real ellipticals when the progenitors are pure stellar disks without a bulge (Hernquist 1992)Hernquist (1992). This problem probably arises from Liouville’s theorem and the conservation of fine-grained phase space density (Carlberg 1986)Carlberg86 . The central phase space density of the remnant can be no greater than that of the progenitors so pure disks with low central phase-space density cannot make ellipticals with a high central value. Disk galaxies with bulges can lead to denser cores (Hernquist 1993)Hernquist (1993), but this only skirts the issue by including an elliptical component with a dense core in the progenitors. The solution to this problem is probably gaseous dissipation through radiative cooling which can lead to higher, central densities in merging galaxies with gas (Kormendy 1989b)Kormendy89b , although simulations with gas and star formation seem to produce cores which are too dense (Mihos & Hernquist 1994)Mihos94 . Despite the uncertainties in core properties, galaxy merging produces remnants with global structure and kinematics similar to real ellipticals and remains the most likely way that they form.
Galaxy clusters hold the key to understanding the formation of elliptical galaxies. While E galaxies only make up about 10% of all galaxies, they are much more abundant in regions of high galaxy density, especially in the centres of clusters of galaxies where they make up most of the galaxy population (Dressler 1980; Dressler 1984)Dressler (1980)Dressler (1984). The high frequency of E galaxies in rich clusters has been viewed as a paradox and evidence against the merger hypothesis, since the large relative velocities of galaxies in virialized clusters should not permit galaxy merging (Ostriker 1980)Ostriker (1980). The high number density of galaxies may permit the merger of some galaxies in the low velocity tail of a virialized distribution (Mamon 1992) that may account for the observed elliptical concentration, but this picture does not include the effects of hierarchical collapse. In a cosmological hierarchy, small groups of galaxies will form prior to the collapse and virialization of the cluster and the velocity dispersion in these groups may be low enough to permit dissipationless merging and the formation of elliptical galaxies. Small elliptical galaxies may also be created in gravitational instabilities in the tidal tails of interacting galaxies (Barnes 1992)Barnes92 or from galaxy harassment, the cumulative tidal perturbations from other galaxies or the cluster potential (Moore et al. 1996a)Moore et al. (1996). Disk galaxies need a quieter environment to form through dissipative collapse and the centre of a cluster where strong tidal forces from closely interacting protogalaxies is probably the least likely place to form a disk. One might therefore expect elliptical galaxies and in particular a BCG to form in the cluster centre where the lumpy mass flow is converging.
While phenomenological studies of galaxy mergers are useful for establishing generic properties of merger remnants, the initial trajectories are only roughly based on cosmological expectations and the galaxy dark halo models are usually truncated at a smaller mass and extent than seen in halos in cosmological simulations (Dubinski & Carlberg 1991; Navarro, Frenk & White 1996). Dubinski & Carlberg (1991)Navarro et al. (1996) An examination of galaxy merging in the cosmological setting of a cluster is therefore necessary to go beyond these studies, though, the large dynamic range in mass between galaxies and clusters (a factor of 1000 or more) make cluster simulation with resolved galaxies difficult to study using either N-body or combined N-body/gasdynamics methods. Galactic dark halos seem to merge too efficiently and form a smooth cluster dark halo with very little internal substructure corresponding to galaxies at late times (Moore et al. 1996b)Moore et al. (1996). This problem originates from inadequate dynamic range from large gravitational softening lengths (50 kpc) and too few particles. Larger cluster simulations with particles show that substructure corresponding to a galaxy scale can survive during the formation of a cluster (Carlberg 1994)Carlberg94 . In N-body gasdynamical simulations, galaxies form in the centre of dark halos through gaseous dissipation. These tightly bound objects may survive infall into the cluster, but in practice, the number of galaxies formed in this way in simulations is highly sensitive to the cooling rate assigned to the gas (Frenk et al. 1996)Frenk et al. (1996). Gasdynamical simulations are also much more computationally intensive making this method very difficult at present.
3 Simulating Galaxies in a Cluster Collapse
In this paper, we introduce a new approach to cluster simulation with a large enough dynamic range to resolve galaxies within a cluster and examine galaxy merging in a cosmological context. We simply assume that disk galaxies form instantly in the centre of galactic-mass dark halos early on in the evolution of the dark matter cluster in a cosmological N-body simulation. At an early time, we replace galactic dark halos with equilibrium, N-body galaxy models scaled to the appropriate mass and dimensions and resolved with 10-100 times as many particles. We assume that the first galaxies are disks embedded in dark halos with flat rotation curves similar to the Milky Way and other nearby galaxies (Kuijken & Dubinski 1995)Kuijken & Dubinski (1995). To guarantee that the chosen galaxies end up in the final cluster we use the following procedure:
-
1.
A dark matter simulation of the cluster is run until the current epoch, .
-
2.
The particles in the final virialized cluster are labelled and identified at the earlier epoch, .
-
3.
From this subset of particles, all galactic dark halos are identified using the friends of friends linking method (Davis et al. 1985)Davis85 and replaced by randomly-oriented disk galaxy models of the same mass scale placed on the same trajectories as the halos.
-
4.
The simulation of the cluster is then rerun with the higher resolution galaxy population until the present epoch.
A similar method has been used in the study of galaxy harassment in clusters (Moore et al. 1996a)Moore et al. (1996). The idea is to enhance the resolution of the simulation selectively by using galaxy models as in phenomenological studies while retaining the cosmological character of the mass distribution and large-scale kinematics.
The experimental cluster is chosen from a cold dark matter (CDM) simulation of periodic cubic volume with Mpc on a side, assuming km/s/Mpc and normalized to . With this normalization, the CDM model is a good description of the clustering of galaxies for the scale we are examining, although it is known to lack sufficient power on larger scales. The initial conditions were generated by applying the Zel’dovich approximation to a random realization of a CDM density field generated with a Fourier transform. The simulation is first run at resolution to identify the site of cluster formation. A spherical volume of comoving radius Mpc, associated with the virialized cluster, is identified in the initial conditions and then resampled at the full resolution. The tidal boundary of the collapsing cluster is adequately handled using two concentric shells in the radial ranges of Mpc and Mpc, sampled at and resolution respectively. The simulation therefore contains a total of 4.3 million particles of which about 1 million end up in the virialized cluster halo. All of the simulations are run with a parallel N-body treecode adapted for both periodic and vacuum boundaries (Dubinski 1996)Dubinski (1996).
The cluster has a virial radius of 1.2 Mpc, a mass of M⊙ within this radius and a spherically averaged, central line-of-sight velocity dispersion of 550 km/s. This cluster would be classified as a poor cluster or a large group by observers. At , the 100 most massive dark halos associated with the cluster with masses in the range of to M⊙ are identified and replaced with N-body galaxy models. The model used for each galaxy (with different scaling) is composed of an exponential disk, a truncated King model bulge and King model dark halo with the potential and orbital distribution derived from a self-consistent distribution function (Model B of Kuijken & Dubinski 1995)Kuijken & Dubinski (1995). By design, the model has a flat rotation curve out to 10 exponential scale-lengths and declines beyond that distance.
The 20 most massive halos are replaced with “high” resolution galaxy models including 50000 disk particles, 10000 bulge particles and 40000 dark halo particles with a softening length of 0.32 kpc for the stars and 0.64 kpc for the dark halo particles. The remaining 80 halos are sampled at “low” resolution with one tenth as many particles as above in the same ratios and a softening length twice as large. The remaining cluster dark matter is retained with a softening length of 3.2 kpc.
The models are scaled according to the value of the circular velocity and mass of the halos in the dark matter simulation at about 1/2 the virial radius. The scale-lengths, , of the disks are determined by the measured mass and velocity () and fall in the range of observed disks. The 100 galaxies roughly follow a Tully-Fisher relation (Tully & Fisher 1977)Tully & Fisher (1977) in their circular velocity vs. mass profiles with (Figure 1). The disk scale-lengths also vary according to observed laws with again cf. with (Freeman 1970)Freeman (1970) (Figure 2). The mass function also has a Schechter form with and M⊙ (stellar mass) similar to the observed local galaxy luminosity functions but perhaps somewhat steeper (Loveday et al. 1992)Loveday et al. (1992). The simulation is run for 10.5 Gyr with a single leapfrog timestep Myr for a total of 4700 steps. This timestep allows the resolution of structures down to about 0.5 kpc.
One problematic feature of the distribution is that the 3 most massive galaxies have unusually large circular velocities for normal disk galaxies, with km/s. These galaxies are probably ellipticals rather than disks at the time they are selected. Their exact morphology probably makes little difference to the final outcome since they quickly merge at the outset. The simulation should eventually be rerun with elliptical galaxies to check for possible discrepancies. However, the remaining galaxies follow a realistic mass distribution having properties similar to the observed high surface brightness disks.
4 Results
4.1 The Formation of a Giant Elliptical Galaxy
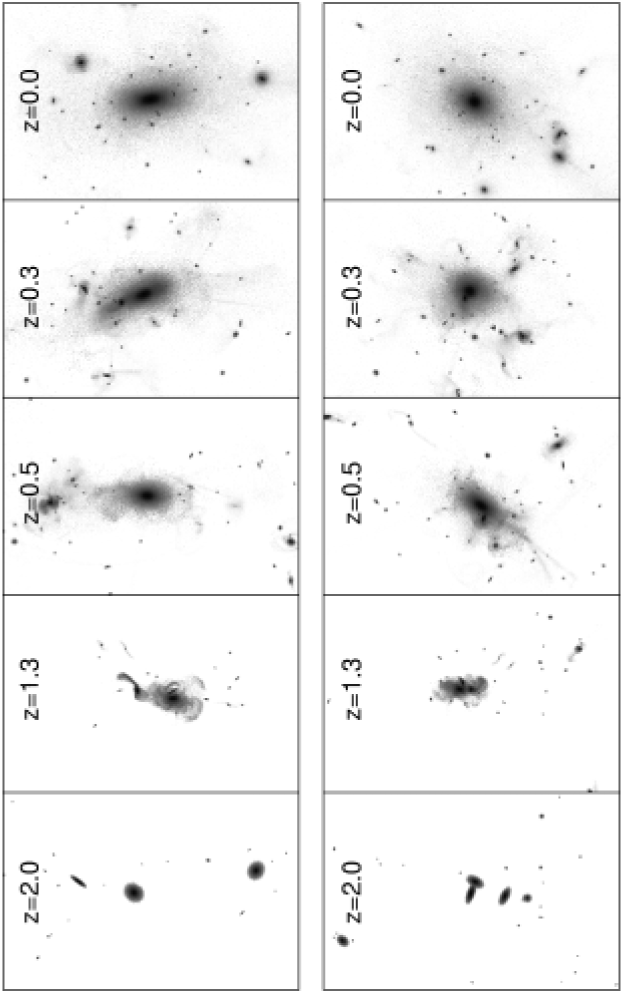
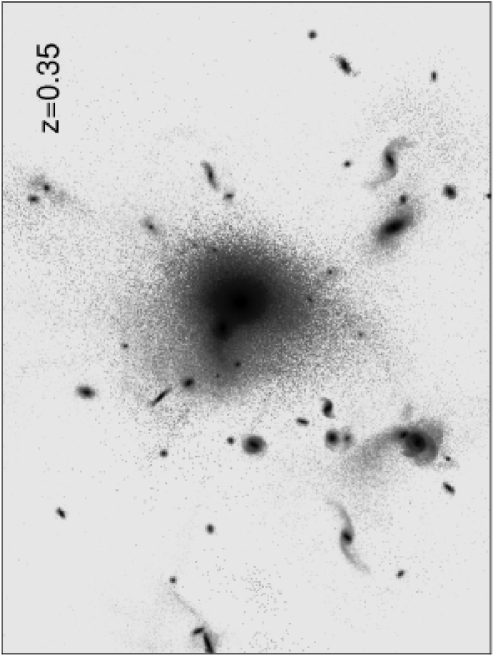
Within 3 Gyr of the start of the simulation (by ), the four most massive galaxies merge to form a central object resembling an elliptical galaxy and as we describe below its measured surface brightness and velocity dispersion profile are very similar to real giant ellipticals. Three of the galaxies fall down a line which can be identified with the primordial filament apparent in the early formation of the dark matter cluster. The fourth galaxy comes from a different direction, but the infall of material generally follows the line of the filament (Fig. 3). Over the next 5 Gyr (ending around ), 9 more galaxies are accreted (some as merged products themselves) and of the total of 13 merging to form the elliptical, 7 are galaxies with circular velocities greater than 200 km/s while the remaining 6 are smaller galaxies with circular velocities km/s. The epoch around is marked by a period of intense activity in which many of the galaxies are merging and experiencing strong tidal perturbations resulting in tidal tails from close passes with the cluster center (Fig 4) and is an illustration of the galaxy harassment process (Moore et al. 1996). From to the present, there are no more large mergers with the BCG. At the end of the simulation, only 59 galaxies can be identified orbiting in the cluster. Of the 41 “missing” galaxies, 13 have merged to form the central massive elliptical galaxy. The remaining 28 have been incorporated into other galaxies through mergers. The group simulated here is too small to detect the density-morphology effect (Dressler 1984)Dressler (1984), the cluster centre), however, the few ellipticals created are close to the cluster centre ( kpc) and on eccentric orbits that are measureably decaying by dynamical friction.
4.2 Analysis of the Merger Remnant
Is the merger remnant in the centre of the cluster a giant elliptical or cD galaxy? We measured the shape of the central galaxy, the surface density and velocity dispersion profiles along different lines of sight to answer this. We also measured the three-dimensional structure and kinematics of the stars and dark matter for comparison to interpretations of the projected data.
4.2.1 Shape
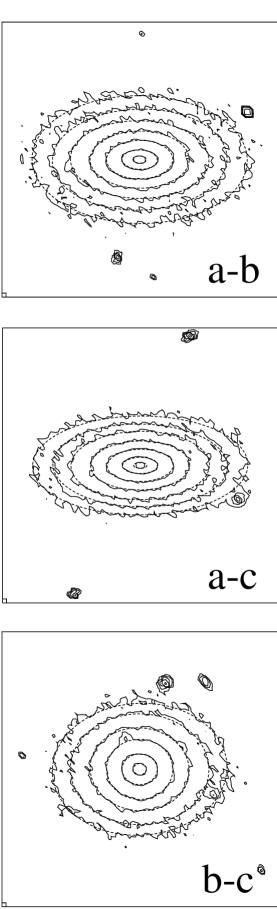
The central elliptical is a triaxial object with principal axis ratios of , and , where and are the major, middle, and minor axes (Fig. 5). The surface density contours (isophotes) are nearly perfect ellipses in the inner regions with very little signal of “boxiness” or “diskiness” seen in smaller ellipticals. The regularity of the isophotes is consistent with a relaxed galaxy which has suffered no recent mergers, which is indeed the case.
4.2.2 Density
The surface density profiles from three different lines of sight along each of the principal axes are measured by fitting elliptical contours to the observed density map. Figure 6 shows the log surface density plotted versus . Another axis is included showing the equivalent surface brightness assuming for the stars. The nearly linear dependence on from 3-100 kpc reveal that the galaxy follows a deVaucouleurs light profile. The profile is similar to measured profiles of giant ellipticals (gE) rather than cD galaxies which show an excess of light at large radii. deVaucouleurs profiles are fit for the effective radius, , and the total mass. The effective radii (calculated as ) is between 18-22 kpc depending on the projection. The fitted total mass is M⊙ corresponding to a total luminosity of 6 (assuming and L⊙). The regularity of the isophotes and the measured scales and luminosities of the merger remant are consistent with observations of giant elliptical galaxies.
The 3-dimensional density profile of the merger remnant reveals the relative distribution of stars and dark matter in an elliptical galaxy (Fig. 7). The Hernquist density profile (1990)Hernquist90 ,
| (1) |
provides convenient model fits to both the stellar and dark matter profiles. The fitted masses and scale radii are M⊙ and kpc for the stars and M⊙ and kpc for the dark matter as shown in Figure 7. Stellar mass dominates within (), although the stellar density is only about 3 times the dark matter density at the center. The stellar and dark matter density are equal in the range of 10-20 kpc () while beyond 40 kpc () the dark matter density is at least ten times the stellar density. The merging process tends to enhance the ratio of dark mass to luminous mass within in the central regions. In the initial population of disk+bulge galaxies the dark to luminous mass ratio at the half light radius is 0.4, while the giant elliptical has a ratio of about 1.0 at a nominal effective radius of 20 kpc, a factor of 2.5 enhancement. The most likely reason for this enhancement is the tendency for disk stars to be heated more effectively than the dark matter particles. The same resonant interactions which create tidal tails during mergers add energy more effectively to disk stars than to dark matter particles with the same initial binding energy. The dark matter density may then be enhanced slightly with respect to the stars in the merger remnant in comparison to the initial disks.
The overall trend for increasing dark to luminous mass ratio is shown in Figure 8. Stars dominate the central density and the dark to luminous mass ratio is only about 0.3. At , the ratio starts to grow linearly reaching 1.0 at continuing to rise to 3.3 at . These mass ratios and general behaviour are in accord with recent models of the dark matter in ellipticals derived from combining surface brightness and kinematical information (e.g. Saglia et al. 1992, 1993; Rix et al. 1997)Saglia92 Saglia93 Rix97 .
4.2.3 Kinematics
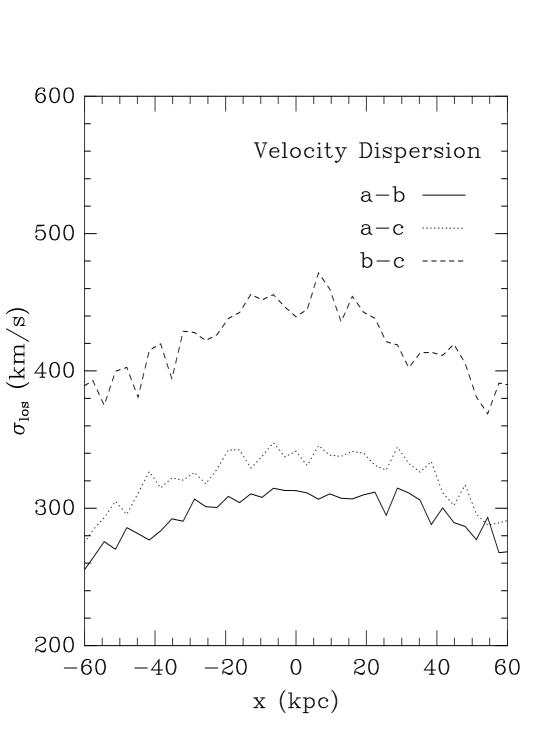
The velocity dispersion profiles of the galaxies are also measured using a method faithful to current observational techniques. A slit 3.2 kpc in width is laid along the apparent major axis in three independent directions. This corresponds observationally to a 1.5 arcsecond slit laid across a galaxy at a distance of 100 Mpc. Particles are binned in squares 3.2 kpc on a side and the mean line-of-sight velocity and velocity dispersion is measured in each bin. Like real ellipticals, the galaxy rotates slowly about its minor axis with km/s (Franx, Illingworth & Heckman 1989)Franx et al. (1989). Figure 9 shows the velocity dispersion profile along the apparent major axis for the three lines of sight down each of the principal axes. The central value peaks between 300 and 450 km/s depending on the line of sight. The large value of 450 km/s occurs when looking exactly down the long axis of the galaxy showing the anisotropy of the velocity ellipsoid in this flattened triaxial stellar system. These central values again are in accord with real giant ellipticals although the value of 450 km/s might be considered too large (Fisher et al. 1995)Fisher et al. (1995). The velocity dispersion only declines gradually out to 60 kpc (about 3 effective radii) again in similar fashion too many elliptical galaxies. There is no sign of an upturn in the velocity dispersion at large radii as seen in the exceptional case of the cD galaxy in A2029 (Dressler 1979)Dressler (1979).
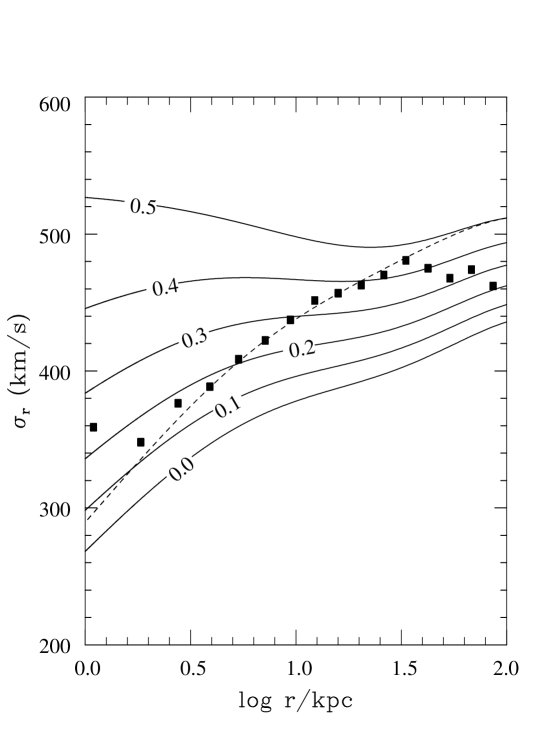
In three dimensions, the measured velocity dispersion is nearly isotropic to the centre but becomes radial anisotropic with a radial anisotropy parameter (Binney & Tremaine 1987)BT87 , at 3 . The density profiles of Figure 7 for the dark matter and stars were fit with Hernquist (1990) models and used to solve the spherical Jeans equations for the velocity dispersion profile of the stars using constant values for the anisotropy parameter, . Figure 10 shows that the velocity profile is consistent with the mass model for values of within kpc (). The best fit spherical Jeans model in Figure 10 is one where the anisotropy grows monotonically from the center with to at 3 .
4.2.4 Comparison with other merger remnants
The properties of the merger remnant in this experiment are rather different from those found in other simulations of merging groups. Weil and Hernquist’s (1996)Weil & Hernquist (1996) simulations produced remnants which are nearly oblate with a small flattening. They also have a modest amount of rotational support about their minor axes. These results contrast with the prolate nearly non-rotating object in the cluster simulation. The differences can be attributed to initial conditions. The group simulations start with galaxies on random trajectories selected from an isotropic distribution while the cosmological mergers are strongly anisotropic because of the initial filamentary structure. The initial isotropy leads to a rounder, oblate remnant while collapse down a filament appears to lead to a prolate, elongated object.
4.3 Fossil Alignments
BCGs are often well-aligned with the distribution of the cluster galaxies (Sastry 1968; Carter el al. 1980; Porter, Schneider & Hoessel 1991)Sastry (1968)Carter80 Porter et al. (1991) as well as more extended large-scale clustering features (Binggeli 1982)Binggeli82 and it has been suggested that this is due to filamentary collapse expected in hierarchical structure formed from Gaussian random noise (e.g. Rhee & Roos 1990; West 1994; Bond, Kofman, & Pogosyan 1996)Rhee90 West (1994)Bond96 . The alignment of the central galaxy is seen as the consequence of an anisotropic collapse remembered from the initial random density field. Filamentary collapse leads to nearly head-on collisions of galaxies which create prolate merger remnants aligned with the initial collision trajectory (Villumsen 1982).
The simulated BCG examined here shows the alignment effect as seen in previous work. The shape and orientation of the BCG is indeed nearly congruent with the galaxy distribution in the cluster. The angle between the long axis of the central galaxy and the cluster galaxy population as measured by its moments is only 15∘. Furthermore, the orientation of the BCG is closely aligned with the primordial filament delineated by the 3 large galaxies which make up most of the mass of the BCG. We should emphasize that this alignment effect only works for the central, giant elliptical where the kinematics and morphology are dependent on the large-scale convergence of the flow of matter into the cluster’s forming potential well. Other galaxies falling into the cluster that avoid merging with the BCG will have random alignments dependent on their merging history and tidal interactions with the cluster core and other galaxies. This simulation strongly supports the hypothesis that the shape and orientation of the central galaxy are fossils of the filamentary initial conditions of the cluster collapse, although further simulations should be done to confirm this result.
5 Conclusions
In summary, when a population of disk galaxies with an observed distribution of masses falls in a collapsing cluster in a cosmological setting, a central, giant elliptical galaxy will form in the cluster center. The galaxy forms through the merger of many smaller galaxies which converge on the cluster center along the filamentary structure originating in the initial density field. The one simulation presented here agrees quantitatively in its structure and kinematics with many BCG’s but there are still many open questions, in particular: What is the origin of the envelope in the cD galaxies in rich clusters? Perhaps the driving mechanism is tidal stripping (Richstone 1976)Richstone (1976) and harassment (Moore et al. 1996a)Moore et al. (1996) which only occurs in more massive clusters than examined here. Why does BCG central velocity dispersion poorly correlate with the cluster velocity dispersion? Are multiple nuclei in BCG’s ongoing mergers or the result of chance projections? How do the properties and the timing of formation of BCG’s depend on different cosmological models? If there is a strong dependence, the observation of their evolution may constrain cosmological models. A modest sample of simulations covering different mass scales and cosmological models can answer these questions quantitatively.
References
- (1) Barnes, J. 1988, ApJ, 331, 699
- (2) Barnes, J. 1989, Nature, 338, 123
- (3) Barnes, J. 1992, ApJ, 393, 484
- (4) Barnes, J. E., & Hernquist, L. 1992a, ARA&A, 30, 705
- (5) Barnes, J. E., & Hernquist, L. 1992b, Nature, 360, 715
- (6) Bode, P. W., Berrington, R.C.; Cohn, H.N., & Lugger, P.M. 1994, ApJ, 433, 479
- (7) Binggeli, B. 1982, A&A, 107, 338
- (8) Binney, J., & Tremaine, S. 1987, in Princeton, NJ, Princeton University Press, 1987, 747 p.
- (9) Bond, J., Kofman, L., & Pogosyan, D. 1996, Nature, 380, 603
- (10) Brown, J. P. 1997, Ph.D. thesis, Department of Astronomy, University of Toronto, Toronto, ON, Canada
- (11) Carlberg, R. 1986, ApJ, 310, 593
- (12) Carlberg, R. 1994, ApJ, 433, 468
- (13) Carter, D., Inglis, I., Ellis, R. S., Efstathiou, G., & Godwin, J. G. 1985, MNRAS, 212, 471
- (14) Carter, D., & Metcalfe, N. 1980, MNRAS, 191, 325
- (15) Davis, M., Efstathiou, G., Frenk, C. S., & White, S. D. M. 1985, ApJ, 292, 371
- deVaucouleurs (1948) deVaucouleurs, G. 1948, Ann. d’Ap., 11, 247
- Dressler (1979) Dressler, A. 1979, ApJ, 231, 659
- Dressler (1980) Dressler, A. 1980, ApJ, 236, 351
- Dressler (1984) Dressler, A. 1984, ARA&A, 22, 185
- Dubinski (1996) Dubinski, J. 1996, New Astronomy, 1, 133
- Dubinski & Carlberg (1991) Dubinski, J., & Carlberg, R. 1991, ApJ, 378, 496
- Fabian (1994) Fabian, A. 1994, ARA&A, 32, 277
- Fisher et al. (1995) Fisher, D., Illingworth, G., & Franx, M. 1995, ApJ, 438, 539
- Franx et al. (1989) Franx, M., Illingworth, G., & Heckman, T. 1989, ApJ, 344, 613
- Freeman (1970) Freeman, K. C. 1970, ApJ, 160, 811
- Frenk et al. (1996) Frenk, C., Evrard, A., White, S., & Summers, F. 1996, ApJ, 472, 460
- (27) Garijo, A. and Athanassoula, E. and Garcia-Gomez, C.” 1997, A&A, 327, 930
- (28) Hernquist, L. 1990, ApJ, 356, 359
- Hernquist (1992) Hernquist, L. 1992, ApJ, 400, 460
- Hernquist (1993) Hernquist, L. 1993, ApJ, 409, 548
- Kormendy (1989) Kormendy, J. 1989, ARA&A, 27, 235
- (32) Kormendy, J. 1989, ApJ, 342, L36
- Kuijken & Dubinski (1995) Kuijken, K., & Dubinski, J. 1995, MNRAS, 277, 1341
- Lauer (1985) Lauer, T. R. 1985, ApJ, 292, 104
- Loveday et al. (1992) Loveday, J., Peterson, B., Efstathiou, G., & Maddox, S. 1992, ApJ, 390, 338
- McNamara & O’Connell (1989) McNamara, B. R., & O’Connell, R. W. 1989, AJ, 98, 2018
- Merritt (1985) Merritt, D. 1985, ApJ, 289, 18
- (38) Mihos, J. & Hernquist, L. 1994, ApJ, 437, L47
- Moore et al. (1996) Moore, B., Katz, N., & Lake, G. 1996, ApJ, 457, 455
- Moore et al. (1996) Moore, B., Katz, N., Lake, G., Dressler, A., , & Oemler, A., Jr. 1996, Nature, 379, 613
- Navarro et al. (1996) Navarro, J., Frenk, C., & White, S. 1996, ApJ, 462, 563
- Ostriker (1980) Ostriker, J. 1980, Comments Astrophys., 8, 177
- Ostriker & Hausman (1977) Ostriker, J., & Hausman, M. 1977, ApJ, 217, L125
- Ostriker & Tremaine (1975) Ostriker, J., & Tremaine, S. 1975, ApJ, 202, L113
- Porter et al. (1991) Porter, A. C., Schneider, D. P., & Hoessel, J. G. 1991, AJ, 101, 1561
- (46) Rhee, G. & Roos, N. 1990, MNRAS, 243, 629
- (47) Rix, H.-W., de Zeeuw, P.T., Cretton, N., van der Marel, R.P., & Carollo, C. M. 1997, ApJ, 488, 702
- Richstone (1976) Richstone, D. O. 1976, ApJ, 204, 642
- (49) Saglia, R.P., Bertin, G, & Stiavelli 1992, ApJ, 384, 433
- (50) Saglia, R.P., Bertin, G., Bertola, F., Danziger, J., Dejonghe, H., Sadler, E.M., Stiavelli, M., de Zeeuw, P.T., & Zeilinger, W.W. 1993, ApJ, 403, 567
- Sandage & Hardy (1973) Sandage, A., & Hardy, E. 1973, ApJ, 183, 743
- Sastry (1968) Sastry, G. N. 1968, PASP, 80, 252
- Schombert (1986) Schombert, J. 1986, ApJS, 60, 603
- Toomre (1977) Toomre, A. 1977, in The Evolution of Galaxies and Stellar Populations, ed. B. Tinsley & R. Larson (New Haven: Yale Univ. Obs)
- Toomre & Toomre (1972) Toomre, A., & Toomre, J. 1972, ApJ, 178, 623
- Tremaine (1990) Tremaine, S. 1990, in Dynamics and interactions of galaxies: proceedings of the international conference, Heidelberg, 29 May-2 June 1989, ed. R. Wielen (Berlin; New York: Springer-Verlag), 394
- Tully & Fisher (1977) Tully, R., & Fisher, J. 1977, A&A, 54, 661
- (58) Villumsen, J.V. 1982, MNRAS, 199, 493
- Weil & Hernquist (1996) Weil, M., & Hernquist, L. 1996, ApJ, 460, 101
- West (1994) West, M. J. 1994, MNRAS, 268, 79
- White & Rees (1978) White, S. D. M., & Rees, M. J. 1978, MNRAS, 183, 341
Acknowledgements. I thank the Pittsburgh Supercomputing Center for granting me computing time on the Cray T3D and T3E. I also acknowledge useful comments and criticisms from Michael West, Lars Hernquist, Scott Tremaine, Ray Carlberg, Chigurapati Murali, Jame Brown, Howard Yee, Simon White, Gary Mamon and the referee James Schombert. Thanks to Joel Welling for help in producing animations of this simulation.
e-mail:dubinski@cita.utoronto.ca
website:www.cita.utoronto.ca/dubinski/