09.01.1; 09.07.1; 09.13.2; 11.17.1; 13.19.3 \offprintsF. Combes, bottaro@obspm.fr 11institutetext: Observatoire de Paris, DEMIRM, 61 av. de l’Observatoire, F-75014 Paris 22institutetext: Onsala Space Observatory, S–43992 Onsala, Sweden 33institutetext: Nobeyama Radio Observatory, Minamimaki-mura, Minamisaku-gun, Nagano 384-13, Japan
New upper limits on the interstellar O2 abundance
Abstract
We report new observations of molecular oxygen in absorption at in front of the radio source B0218+357. The lines at 56.3 and 118.7 GHz have been observed, redshifted to 33.4 and 70.5 GHz respectively, with the 12m at Kitt Peak, 43m at Green Bank telescopes, and the 45m Nobeyama radio telescope. Deriving the surface filling factor of the absorbing dark cloud with other lines detected at nearby frequencies, we deduce from the upper limits on the O2 lines a relative abundance of molecular oxygen with respect to carbon monoxyde of O2/CO 2 10-3 at 1, seven times lower than the previous limit. The consequences of this result are discussed.
keywords:
ISM: abundances, general, molecules – Quasars: absorption lines – Radio lines: ISM1 Introduction
The interstellar abundance of molecular oxygen has been a puzzle for a long time. Since the cosmic abundance of oxygen (O/H 8.5 10-4) is a little more than twice as large as that of carbon, at most half of oxygen could be locked up in CO, the rest should be in the form of atomic OI, or in the molecules O2, OH, H2O. The H2O/H2 ratio is predicted between 10-7 and 10-5 by chemical models, and such predictions are compatible with recent ISO results (e.g. Cernicharo et al 1997). Since the abundance of OH is only 10-6 or lower, it was long thought that O2 could be as abundant as CO, i.e. 10-5-10-4 with respect to H2 or at least 1/10th of that of CO (Langer et al 1984, Viala 1986). In dark clouds, OI and O2 are predicted to have comparable abundances, while most of the oxygen should be atomic in diffuse clouds. To circumvent the atmospheric absorption, the recent searches have used either the 16O18O (Fuente et al 1993, Maréchal et al 1997a) or the redshifted O2 (Combes et al 1991, Liszt 1992, Combes & Wiklind 1995) and have come up with an upper limit in the O2/CO ratio of 1.3 10-2 at 1.
We report about further efforts to detect an O2 line in absorption, using the redshifted molecular cloud at absorbing the continuum from the quasar B0218+357 (cf Combes & Wiklind 1995). The selected lines are at lower frequencies, where the continuum flux is larger, and should provide a better chance of detection.
2 Observations
The observations around 70 GHz have been carried out at the NRAO 12–m telescope at Kitt Peak111NRAO is a facility of the National Science Foundation, operated under cooperative agreement by Associated Universities Inc. in February 1996. The observations around 30 GHz have been obtained with the NRAO 43m telescope in Green Bank in February 1996, and then at the 45m Nobeyama telescope in Japan during several observing runs from February to May 1997.
Kitt-Peak 12–m Two SIS receivers (68-90 and 90-116 GHz) were used at 70 GHz (O2), 87 GHz (CS(3–2)) and 105 GHz (HCN(2–1)), with an average system temperature of 345, 225 and 250 K respectively. The receivers were used in dual polarization modes, and tuned in single- sideband. The corresponding beam sizes are 98, 79, and 66 ′′. The observations were done using the wobbler switching mode. We used simultaneously broad filterbanks (0.5 MHz resolution) and narrow band autocorrelators (hybrid spectrometer), providing a resolution of 97 KHz. However the spectra were smoothed to gain signal-to-noise to velocity resolutions of 1-3 km/s. Pointing was checked at least every two hours by broadband continuum observations of radio-sources; the pointing accuracy was 6 ′′ rms.
Green-Bank 43–m The receiver was a cooled HFET with a system temperature Tsys = 120K, and a bandwidth of 500 MHz. The beam size is 56 ′′ at the CS and O2 frequencies. The conversion ratio was estimated at 10 Jy/K. Unfortunately, the efficiency was strongly varying with the hour angle, up to a factor 2-3. The efficiency was monitored through observations of strong continuum sources (pointing sources) such as 3C 274, 3C 84, and the pointing corrections were also obtained on Saturn and Jupiter. The observations were made by position switching. The autocorrelator backend provided a resolution of 19.5 KHz, or 0.18 km/s at the O2 frequency.
Nobeyama 45–m The receiver was a cooled HEMT of bandwidth 2GHz and Tsys 140–170K. The half-power beam width of the telescope is 59 ′′ and 51 ′′ at 29 and 33 GHz respectively. The aperture efficiency is 60% at 30 GHz, leading to a conversion ratio of 2.9 Jy/K, for the antenna temperature T. The observing procedure was position switching. The was checked every one to two hours by observing a nearby SiO maser star, S per, and its accuracy was better than 10 ′′ (peak value). The 2048-chanels AOS backends provide a resolution of 37 kHz, i.e. 0.38km/s at the CS frequency and 0.33 GHz at the O2 one. The flux density of the continuum emission was measured with a continuum backend in beam-switching mode at 29 GHz and with AOS at 33 GHz simultaneously with the O2 line.
3 Results
The BL Lac object B0218+357 is remarkable by its radio images, that reveal two distinct flat-spectrum cores (A and B component), with similar spectrum and polarization level, strongly suggesting a gravitational lens phenomenon (Patnaik et al 1995). That A and B are gravitational images is confirmed by the presence of a small Einstein ring surrounding the B image, of 335 milli-arcsecond in diameter (Patnaik et al 1993). Since the ring has a steeper spectrum, it is probably the image of a hot spot in the jet component, and its contribution in the millimetric domain should be negligible. The lensing galaxy at a redshift absorbs the radio continuum of the remote quasar in the HI line (Carilli et al 1993), and in molecular lines (Wiklind & Combes 1995). The intensity ratio between the two images is A/B 3-4 at several radio wavelengths (O’Dea et al. 1992, Patnaik et al. 1993). As in the similar absorbing lens galaxy in front of PKS1830–211 (cf Wiklind & Combes 1996), some of the main molecular lines are optically thick as attested by the detection of isotopomers, but the radio continuum is not totally absorbed, which means that the absorbing material does not cover the whole surface of the continuum source. In the case of PKS1830–211, interferometric observations have confirmed that only one image of the source is covered by the absorbing cloud (Wiklind & Combes 1997a). In B0218+357, the situation is still unclear, although it has been claimed that only part of the A image is covered at cm wavelengths (Menten & Reid 1996) and through optical imaging (Grundahl & Hjorth 1995). At the period of our observations, the fraction of the total continuum absorbed was determined to be one third.

To derive the optical depth of a given line, or at least an upper limit on the optical depth, we must know exactly the total continuum flux of the source at the epoch of observations, since it might be variable, and the surface filling factor of the absorption, i.e. the fraction of the continuum source surface covered by molecular clouds. The best is even to bypass these two steps, by observing another line at a neighbouring frequency, which is optically thick and gives directly the absorbed continuum level. This was done in our previous work, where the neighbouring CO transition was shown to be highly optically thick through observations of 13CO and C18O (Combes & Wiklind 1995).

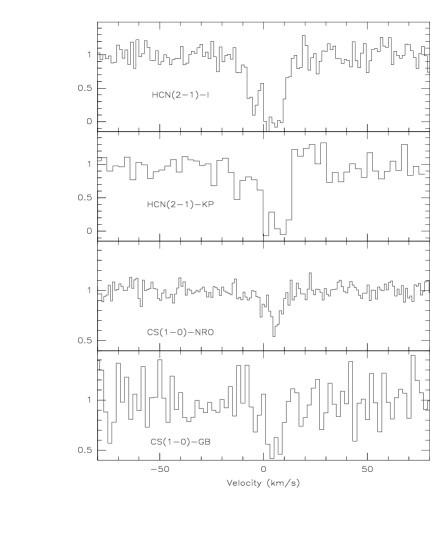
To calibrate the N,J = 1,1 – 1,0 118 GHz O2 line, redshifted at 70 GHz, we could not observe the 115 GHz CO(1–0) line unfortunately, since the 12–m receiver was not operating at 68 Ghz. Instead, the line CS(3–2) and HCN(2–1) were observed at redshifted frequencies of 87 and 105 GHz respectively. The HCN(2–1) profile is displayed in figure 1, normalized to the absorbed continuum. It can be compared with the analogous spectrum obtained with the IRAM telescope in July 1996, also normalised to the continuum. Both appear optically thick. From the millimetric observations carried out with the IRAM-30–m telescope in 1994, 1995 and 1996, the total continuum does not seem to have varied, at least within the error bars (10-20%). The CS(3–2) was not detected with the 12–m (although it is detected with the IRAM-30–m, Wiklind & Combes 1997b).
To calibrate the N,J = 1,1 – 1,2 56 GHz O2 line, redshifted at 33 GHz, we have observed the CS(1–0) line, redshifted at 29 Ghz, together with the corresponding 13CS line. The CS(1–0) line was detected both at NRO and GB (see figure 1), but are not saturated, and the 13CS line was not detected, with an rms noise level of 4mK in channels of 4km/s (see Table 1). We must therefore rely on the measurement of the total continuum, and on the assumption that the fraction of the surface covered by the molecular cloud is the same at 1cm and 3mm.
The total continuum level measured at the various frequencies and telescopes is displayed in figure 2, together with some other measurements in the literature (see Combes & Wiklind 1997 for details). Within the error bars, all measurements follow a power-law distribution as a function of frequency. In February 1996, the total continuum level measured at 30 GHz at Green-Bank was T = 70 10mK (0.7 Jy), and in February 1997 it was 0.255 .017 K at 33 GHz and 0.245 .020 K at 29 GHz at Nobeyama (i.e. 0.74 and 0.71 Jy) in very good agreement.
We have assumed thermal equilibrium; this is justified since the absorbing molecular cloud is dense with a large optical depth, and the O2 lower levels are completely thermalised in these conditions (see Maréchal et al 1997b). Then, to estimate column densities, the usual formula can be used (cf Combes & Wiklind 1995), assuming gaussian line profiles, with the intrinsic line-width of 4.6 km/s.
| Mol. | Transition | Det.b) | Tel.c) | ||
| GHz | GHz | ||||
| CS | 01 | 48.990978 | 29.080632 | Yes | NRO |
| CS | 01 | 48.990978 | 29.080632 | Yes | GB |
| CS | 23 | 146.969033 | 87.239579 | No | KP |
| 13CS | 01 | 46.247567 | 27.452167 | No | NRO |
| HCN | 12 | 177.261111 | 105.220700 | Yes | KP |
| O2 | 118.7503 | 70.489179 | No | KP | |
| O2 | 56.26476 | 33.398288 | No | GB | |
| O2 | 56.26476 | 33.398288 | No | NRO | |
a) Rest–frequencies from the JPL catalog (Pickett et al)
b) Detection: Yes/No.
c) Telescope: KPKitt Peak 12–m, GB Green-Bank 43–m, NRONobeyama 45–m.
From the observed profiles of CS(1–0) and CS(3–2), a column density of N(CS) of 1.5 1014 cm-2 is found, with an excitation temperature of Tx = 6 K, very close to the background temperature at the considered redshift Tbg0 (1+z) = 4.59K. With the previously derived H2 column density of 5 1023 cm-2 (Combes & Wiklind 1995), the CS abundance is estimated to 0.3 10-9. With this low abundance, no signal could be expected for the 13CS line.
The O2 profiles at 33 and 70GHz are shown in figure 3. At 33GHz, the NRO upper limit is more significant than the Green-Bank one, and we show only that one. They correspond to an upper limit of optical depth at 1 of 0.025 and 0.12 respectively. According to the adopted excitation temperature, upper limits on the O2 abundance are derived in Table 2. They are compared with the column densities derived from previous observations of the CO molecule (IRAM April 1995), assuming unsignificant time variation (Combes & Wiklind 1995).
The present data together with those obtained earlier (Combes & Wiklind 1995) cover a wide range of conditions in the absorbing gas, specifically low and high excitation temperatures. It is therefore not possible to have a large abundance of O2 ‘hidden’ at certain rotational levels. This is an important aspect of measuring the O2 abundance since the molecular structure inhibits collisional excitation of the N,J = 1,0 level from the N,J = 0,0 level (the 118.7 GHz line). This does not apply to radiative transitions (Bergman 1995). However, we can see in Table 2 that the O2/CO abundance ratio does not depend much on the adopted temperature. We find for any choice of that the O2/CO ratio is 2. 10-3 at 1.
4 Discussion
The new O2 limit derived above on the abundance ratio O2/CO 2 10-3 begins to constrain significantly the chemical models. Maréchal et al (1997b) have recently reconsidered the chemistry and rotational excitation of the O2 molecules in interstellar clouds, either dark, transluscent or diffuse. They have used the most recent determinations of reaction rates and collisional cross-sections, and explored the effect of UV radiation, density and temperature. They consider only steady-state equilibrium. Their conclusions show that the most important parameters determining the O2 abundance is the UV field, since the O2 molecules are easily photodissociated, and the C/O abundance ratio in the gas phase. As soon as C/O is larger than 0.7, the O2/CO ratio falls below 0.1. In the frame of steady-state chemistry in a dark cloud, our O2 limit implies a gas phase C/O ratio larger than 1 (at the 1 level) or C/O 0.9 at the 3 level. This would mean that most of the oxygen is frozen onto grains.
| N(O2) | N(CO) | N(O2) | O2/CO | |
| NRO | IRAM | KP | Best | |
| (GHz) | 56.26476 | 136.845411 | 118.7503 | |
| (1) | .025 | 1500 | 0.12 | |
| Tx = 5K | 1.75e16 | 1.51e19 | 3.47e16 | 1.16e-3 |
| Tx = 10K | 4.57e16 | 2.41e19 | 1.08e17 | 1.89e-3 |
| Tx = 15K | 8.90e16 | 3.91e19 | 2.24e17 | 2.20e-3 |
Another possibility is to relax the hypothesis of steady-state chemistry, and consider time-dependent models (Prasad & Huntress 1980, Graedel et al 1982, Langer et al 1984): much more atomic carbon and oxygen exists at times well before steady-state, at so-called ’early-times’, i.e. 1-3 105 yrs. If steady-state has no time to establish, because of a short dynamical mixing time between the diffuse photodissociated phase and the dense dark phase, the relative abundance of O2 can be reduced by one or two orders of magnitude (Chièze et Pineau des Forêts 1989). Most of the oxygen would then be in atomic form, as supported by the recent detection of [OI] 63 in absorption towards Sgr B2 (Baluteau et al 1997). Also in the model of Le Bourlot et al. (1995) molecular clouds reveal chemical bistability, and there may exist a high ionization phase of the ISM with a very low oxygen abundance, where the O2/CO ratio is lower by two orders of magnitude than in the low ionization phase.
The interstellar abundance of molecular oxygen remains problematic; balloon and satellite experiments are much needed. If confirmed, the present low upper limit for the O2/CO ratio strongly constrains chemistry models. If a large fraction of the oxygen abundance is frozen onto grains we expect enhanced O2 and H2O abundances in regions of shocked molecular gas.
Acknowledgements.
We are very grateful to the Green Bank and Kitt Peak NRAO engineers and operators for their particular care in receiver and band-rejection tunings. We also thank N. Kuno for his continuum flux measurements at NRO.References
- [1] Baluteau J-P., Cox P., Cernicharo J. et al 1997, A&A 322, L33
- [2] Carilli C.L., Rupen M.P., Yanny, B.: 1993, ApJ 412, L59
- [3] Cernicharo J., Lim T., Cox P. et al 1997, A&A 323, L25
- [4] Chièze J.P., Pineau des Forêts G.: 1989, A&A 221, 89
- [5] Combes F., Casoli F., Encrenaz P., Gerin M., Laurent C.: 1991, A&A 248, 607
- [6] Combes F., Wiklind T.: 1995, A&A 303, L61
- [7] Combes F., Wiklind T.: 1997, ApJ 486, L79
- [8] Fuente A., Cernicharo J., Garcia-Burillo S., Tejero J.: 1993, A&A 275, 558
- [9] Graedel T., Langer W., Frerking M. 1982, ApJS 48, 321
- [10] Grundahl F., Hjorth J., 1995, MNRAS 275, 67
- [11] Langer W.D., Graedel T.E., Frerking M.A., Armentrout P.B.: 1984, ApJ 277, 581
- [12] Le Bourlot J., Pineau des Forêts G., Roueff E.: 1995, A&A 297, 251
- [13] Liszt H.S.: 1992, ApJ 386, 139
- [14] Maréchal P., Pagani L., Langer W.D., Castets A.: 1997a, A&A 318, 252
- [15] Maréchal P., Viala Y.P., Benayoun J.J.: 1997b, A&A 324, 221
- [16] Menten K.M., Reid M.J., 1996, ApJ 465, L99
- [17] O’Dea, C.P., Baum, S.A., Stanghelli, C., Van Breugel, W., Deustua, S., Smith, E.P. 1992, AJ 104, 1320
- [18] Patnaik A.R., Browne I.W.A., King L.J. et al, 1993, MNRAS 261, 435
- [19] Patnaik A.R., Porcas R.W., Browne I.W.A., 1995, MNRAS 274, L5
- [20] Prasad S.S., Huntress W.T.: 1980, ApJS 43, 1
- [21] Viala Y.: 1986, A&A 64, 391
- [22] Wiklind T., Combes F.: 1995, A&A 299, 382
- [23] Wiklind T., Combes F.: 1996, Nat 379, 139
- [24] Wiklind T., Combes F.: 1997a, ApJ in press
- [25] Wiklind T., Combes F.: 1997b, A&A in prep