On The Origin of the UV Upturn in Elliptical Galaxies. II. Test of the HB Hypothesis
Abstract
Whether or not metal-rich HB stars are the dominant UV source in giant elliptical galaxies (gEs) is an important question in current astronomical research. We follow up our previous evolutionary population synthesis study with quantitative tests to answer this question affirmatively under the following three conditions: (1) Reimers’ empirical mass loss formula is proper, (2) the mass loss efficiency parameter () in metal-rich stars is somewhat larger than the value estimated from the metal-poor star studies, and (3) the true value of the helium enrichment parameter (/) is positive. All three important empirical characteristics of the UV upturn (i.e., the fact that strong UV upturns are restricted to gEs, the positive UV upturn-metallicity correlation, and the narrow range of the of the UV sources) are closely reproduced for reasonable ranges of input parameters. We discuss the major sources of uncertainties in the models, such as the production and role of hot horizontal-branch stars in gEs, and the importance of galactic nucleosynthesis.
and
1 Introduction
The ultraviolet (UV) upturn phenomenon in the spectra of giant elliptical galaxies (gE’s) has been known since early space observations with UV capability became available (Code & Welch (1979)). It is defined as the increase in flux with decreasing wavelength in the range 1,000 – 2,500 Å, as shown in Figure 1.
Several important discoveries have been made related to the UV upturn. Firstly, strong UV upturns are found only in the spectra of gEs111Metal-poor Galactic globular clusters show high ratios of UV-to- flux (e.g., van Albada, de Boer, & Dickens 1981) mainly because of opacity effects (Dorman, O’Connell, & Rood 1995; Yi, Demarque, & Oemler 1997 - hereafter YDO). However, their UV spectra are either flat or declining with decreasing wavelength, producing low ratios of far-UV-to-near-UV flux. Thus, it is correct to say that only gEs show a UV upturn with a steep slope in the UV spectrum.. Secondly, IUE observations suggest a positive correlation between the magnitude of the UV upturn and Mg2 index (Faber (1983); Burstein et al. (1988)). If the Mg2 index traces metallicity (although there is reason for caution [Worthey, Faber, & Gonzalez 1992]), this implies that a more metal-rich galaxy shows a stronger UV upturn. Lastly, Hopkins Ultraviolet Telescope (HUT) observations suggest that the sources of the UV photons are hot stars with a narrow range of temperature, i.e., 20,000 – 23,000 K (Brown, Ferguson, & Davidsen 1995). Since the dominant light sources (main sequence [MS], red giant branch [RGB], and horizontal branch [HB] stars) all tend to become cooler as metallicity increases, the unexpectedly high UV flux in such old, metal-rich systems has been a puzzle.
Understanding the cause of the UV upturn is important for the following reasons: (1) it provides insight into the hot stellar component in elliptical galaxies, (2) it tests the stellar evolution theory, (3) it constrains the age and metallicity of the majority of stars in gEs, if the UV upturn is sensitive to age and metallicity as some models suggest (e.g., Greggio & Renzini (1990); Bressan, Chiosi, & Fagotto 1994; Dorman et al. (1995); YDO). The age-dependence of the UV upturn is particularly noteworthy because such models predict that the UV upturn becomes significant only at large ages when optical spectral evolution is hardly detectable. Finally, (4) the UV upturn implies significant corrections to model-predicted optical colors of distant (high redshift) galaxies (Guiderdoni & Rocca-Volmerange (1987); Bressan et al. (1994)).
The origin of the UV upturn has been controversial since the first observations were made, and several interpretations have been proposed. Young MS stars were among the favorite candidates as the UV sources in many studies (e.g., Gunn, Stryker, & Tinsley 1981; Guiderdoni & Rocca-Volmerange (1987); Rocca-Volmerange (1988); Magris & Bruzual (1993)). However, no evidence of recent star formation has been found in the UV-strong galaxies (O’Connell et al. (1992); Bertola et al. (1993)). Using the HUT, Ferguson et al. (1991) also found that a lack of C IV absorption and the shape of the continuum were inconsistent with flux from a MS population having a standard initial mass function. Moreover, such hot MS stars ( 20,000 K: spectral type B) are short-lived. If the UV upturn were caused by young MS stars, it would be a transient feature, suggesting that all these UV-strong galaxies had experienced a secondary starburst recently, nearly at the same time, which is very unlikely. Post asymptotic giant branch (PAGB) stars were the next to attract attention (Bruzual & Charlot (1993); Magris & Bruzual (1993)). However, PAGB stars are also thought to be so short-lived that the number needed to reproduce the UV upturn in the UV-strong gEs would exceed that allowed by the fuel consumption theorem (Castellani & Tornambé (1991)). In addition, during most of their lifetimes, PAGB stars are much hotter than the suspected UV sources in gEs.
Core helium-burning stars (HB and evolved HB stars) soon became an attractive candidate because they also can be hot and bright (Greggio & Renzini (1990), and references therein). In addition, their mean temperature can match the estimated temperature of the dominant UV source in gEs easily and does not change rapidly with time, thus having advantages in explaining the narrow range of the of the UV sources. Since the HB in Galactic globular clusters tends to become hotter as metallicity decreases, metal-poor HB stars have been suggested as the cause of the UV upturn (Aaronson et al. (1978); Arimoto & Yoshii (1987); Lee (1994); Park & Lee (1997)). However, even the most metal-poor oldest Galactic globular clusters do not show UV upturns that are as strong as those in UV-strong gEs (Dorman et al. 1995; YDO). Moreover, gEs are metal-rich. Thus, if the metal-poor HB stars were the major UV sources in gEs, the positive UV upturn-metallicity relation would be puzzling, unless even the metal-rich gEs contain a substantial number of metal-poor stars the metal-poor stars in the UV-strong galaxies are significantly older than the oldest Galactic globular clusters (Park & Lee (1997)).
Instead, Demarque & Pinsonneault (1988) suggested that, under the conventional assumptions of mass loss222Horch et al. (1992) proposed that if mass loss on the RGB increases with metallicity, a more metal-rich population would contain more hot (low-mass) HB stars. This assumption is not empirically proven yet but consistent with Reimers’ empirical formula of mass loss for a fixed efficiency (see YDO). and galactic helium enrichment, low-mass HB stars evolve into UV-bright objects instead of becoming AGB stars. They found that this phenomenon, the so-called “slow blue phase” (SBP, [Horch, Demarque, & Pinsonneault 1992])333The significance of the SBP is in its positive metallicity dependence. In some sense, the SPB phenomenon states the metallicity dependence of the combined AGB-manqué (Greggio & Renzini (1990)) and post-early-AGB (Castellani & Tornambé (1991)) evolutionary phases, a point which had not been addressed before. Yi, Demarque, & Kim (1997, hereafter YDK) presented a mathematical analysis of the SBP and clarified the general confusion between the SBP and other terms., occurs more easily when metallicity is higher if . Then, the classical metallicity dependence of HB morphology (i.e., HB becomes redder as metallicity increases) should be reversed in the metal-rich regime ( ). Several evolutionary population synthesis (EPS) studies qualitatively showed that the hypothesis that such metal-rich, UV bright, core helium-burning stars are likely to be the dominant UV source in gEs is consistent with empirical data (Greggio & Renzini (1990); Bressan et al. (1994); Dorman et al. (1995); Yi et al. (1995); Brown et al. (1997); YDO). We call this the metal-rich HB hypothesis.
In this quantitative study, we show, following YDO, that EPS models based on the metal-rich HB hypothesis reproduce quite well the empirical discoveries related to the UV upturn phenomenon. We explore the sensitivity of the UV upturn in the models to the input parameters. We compare single abundance models and a few composite models to observations of gE’s. We then discuss major uncertainties in the EPS models and the origin of the discrepancies between various EPS studies. Finally, the implications of the UV upturn for understanding galaxy evolution are also discussed.
2 EPS Models
We have used the YDO model spectra (Yi et al. 1997b ) that were constructed for stellar systems of Age = 1 – 25 Gyr with an age step of 1 Gyr, = 0.0004, 0.004, 0.01, 0.02, 0.04, 0.06, & 0.1 and /= 2 & 3. YDO synthesized the advanced evolutionary stages using Reimers’ empirical mass loss formula (Reimers (1975)) with the mass loss efficiency parameter = 0.3, 0.5, 0.7, & 1.0 (Renzini (1981)) and truncated Gaussian mass distribution of the mass loss with mass dispersion factor = 0.06 (see YDO for details). They assume that all stars in a gE formed in an instantaneous starburst.
The EPS-sensitivity study of YDO concludes that the metal-rich HB hypothesis is plausible if 0.7 in metal-rich () stars, assuming /= 2 – 3, 0.06 , and a Salpeter initial mass function (IMF). YDO found that, other parameters being fixed, a positive metallicity-dependence of can explain the UV-to- flux ratios of both Galactic globular clusters and gEs. The dependence is approximately as follows: 0.3 – 0.5 (), 0.5 – 0.7 (), and 0.7 (), while exact values depend on the adopted ages of the systems, i.e., as a smaller age is assumed, a larger is required. YDO call it the variable- hypothesis which is supported by the independent theoretical work of the Iowa State group (Bowen & Willson (1991); Willson, Bowen, & Struck 1996). Therefore, in our single abundance models, we have adopted the YDO models of for the models of = 0.0004, those of for = 0.004 and 0.01, and those of for the models of 0.02444The choices of in metal-poor stars are the upper limits. Thus, we are overestimating the temperature of average HB stars in a system. However, since we are somewhat reluctant to perform interpolations between models of two different values of , we arbitrarily chose one value, which happened to be the upper limit, in our synthesis. The effect of such choices is small in the galaxy study because metal-poor stars are minor sources of light in gEs..
YDO also found that the Gaussian mass dispersion parameter, , is important to the magnitude of the UV upturn, suggesting that a realistic synthetic HB construction must be employed in the UV population synthesis. However, little is known about the true dispersion, and, thus, we have adopted the models with a value of = 0.06 that was suggested by several globular cluster-HB morphology studies (e.g., Lee, Demarque, & Zinn 1990, see YDO for details). YDO found that the sensitivity of an EPS model to is moderate if is uncertain only within a factor of 2, as suggested by Lee et al. (1990).
EPS studies (Greggio & Renzini (1990); YDO) suggested that the UV upturn is positively correlated with the helium enrichment parameter, /, because both the stellar evolutionary pace and the UV bright, core helium-burning phase (the SBP) are sensitive to the helium abundance. Since the true value of /is not well-known (see Section 6.2 for discussion), we have carried out our study for two values, i.e., /= 2 & 3, for which complete evolutionary tracks are available.
YDO found that UV-to- flux ratios are not sensitive to the IMF slope. Thus, we have adopted the popular Salpeter (1955) IMF (with a slope of ) in this study.
3 Magnitude of the UV Upturn
The first task that EPS models must accomplish is to explain the magnitude of the UV upturn which seems to be positively correlated with metallicity. Why do only gEs exhibit strong UV upturns? Does the element that is responsible for the UV upturn in gEs also produce the UV upturn-metallicity relationship? The most obvious difference between gEs and other old stellar systems (e.g., globular clusters and small elliptical galaxies), other than size and brightness, is metallicity: gEs are more metal-rich. According to YDO, metallicity plays a positive role in the magnitude of the UV upturn, and, thus, the metal-rich HB hypothesis seems qualitatively consistent with the empirical data.
A quantitative comparison of the magnitude of the UV upturn between models and observations has been carried out. The model magnitudes are defined as log where is the mean flux in the bandpass. The , , , and are defined by averaging the flux within the ranges 1,050 – 1,200 Å, 1,250 – 1,850 Å, 2,200 – 2,800 Å, and 5,055 – 5,945 Å (Allen (1976)), respectively. Note that colors defined by such magnitudes are ratios of average fluxes rather than integrated colors over certain bandpasses. The observational data are from Table 2 of Dorman et al. (1995). We excluded two star-forming galaxies, NGC 205 and a NGC 4382, from their list.
As YDO pointed out, and are not good measures of the strength of the “UV upturn” mainly because opacity effects are large in the near-UV. For instance, metal-poor Galactic globular clusters generally exhibit bluer UV-to- flux ratios than UV-strong gEs (Dorman et al. (1995); also Figure 18 of YDO), even though they do not contain a substantial number of hot stars. A UV upturn, such as the ones shown in the spectra of gEs, can only be generated by a strong bimodality in the temperature of stars (Nesci & Perola (1985); Ferguson (1995)), a characteristic of metal-rich populations (see Figures 7-9 of YDO). Opacity effects are less severe in , and therefore is mostly sensitive to the fraction of hot stars to cool stars. Thus we chose as a UV upturn index.
3.1 Single Abundance Models
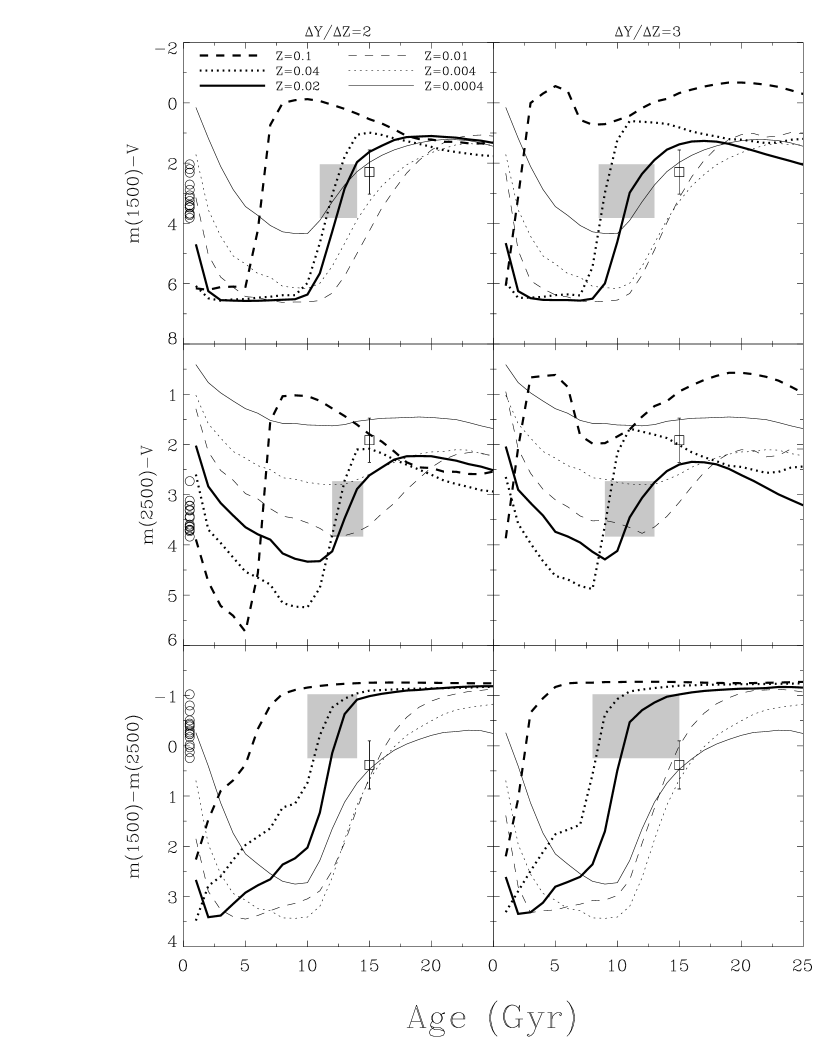
It is useful to examine first the sensitivity of the UV upturn to age and to metallicity using single abundance models, before we construct more elaborate models. Figure 2 shows the UV upturn index, , as a function of age and metallicity. The models shown in Figure 2 are based on the variable- hypothesis: = 0.5 for = 0.0004, = 0.7 for = 0.004 and 0.01, and = 1.0 for 0.02, respectively (see Section 2 for the choice of ). The observed flux ratios of gEs are marked as open circles at the left end of the left panels because their ages are unknown.
The average flux ratios of globular clusters are marked as open boxes with a one standard deviation error bar (data are from Table 1 of Dorman et al. [1995]). The mean metallicity of the star clusters shown here is 0.0014 (s.d. 0.0025). Figure 2 shows that the metal-poor models ( = 0.0004 – 0.004) reasonably match the cluster data at the age of 15 Gyr (the same stellar evolution models that have been used in this study yield 15 Gyr of age for a typical old cluster cluster, Chaboyer et al. [1996]). As pointed out earlier, globular clusters are in general bluer in and in than metal-rich models, mainly due to their low metallicities.
Although single abundance models may be very unrealistic, they fit the empirical flux ratios reasonably and provide several important clues to the UV upturn phenomenon. Firstly, it is shown in Figure 2 that a large age ( 8 Gyr) is essential to produce a significant amount of UV flux, unless the metallicity of the majority of stars in gEs is extremely large. This is because it takes time for a population to develop a substantial number of low mass core-helium burning stars. However, under the current assumptions, the empirical ranges indicate an average age of 10 – 14 Gyr if /= 2 for gEs, as shown as shaded boxes. This age estimate is somewhat smaller than the typical ages of the Galactic globular clusters. Secondly, at a fixed age (e.g., 12 Gyr if /= 2), more metal-rich models ( 0.04, thick dotted lines) show stronger UV flux ratios than less metal-rich ones ( 0.02, thick solid lines). This is because (1) more metal-rich stars lose more mass on the RGB according to the Reimers’ mass loss formula and (2) a higher helium abundance in a more metal-rich star (assuming a positive /) causes the SBP more prominent. If the majority of stars in gEs are metal-rich ( 0.02), as various studies suggest (Buzzoni, Gariboldi, & Mantegazza 1992, and references therein), such a metallicity difference naturally explains the empirical UV upturn-metallicity relation. As YDO pointed out, this is because both the estimated stellar mass loss predicted by Reimers’ formula and the SBP (slow blue phase) are positively correlated with metallicity. Thirdly, the observed range of , the UV upturn index, is easily achievable only by metal-rich models, as shown in the bottom panels of Figure 2. Metal-poor models cannot reproduce the observed range of in gEs unless a very large age ( 20 Gyr) is adopted.
As an alternative to the metallicity spread, an age spread among gEs can also produce the observed difference in UV flux ratios if UV-strong gEs are older than the weak ones by 10 – 30%. A metallicity spread, rather than an age spread, would be a more natural choice if the empirical UV upturn-metallicity relation is real. Conversely, if there is no direct causality between the strength of the UV upturn and metallicity (see the discussion of Lee [1994]), the study of the UV upturn may constrain the relative ages among gEs!
3.2 Composite Models with Realistic Metallicity Distributions
It is certainly an oversimplification to assume that all the stars in a gE have the same metallicity (Larson (1974); Yoshii & Arimoto (1987); Gibson (1997)). Thus, we investigate if any physically plausible mixture of different abundance models can match the data.
The chemical evolution of gEs is still poorly understood. For example, neither the true value of /, nor the metallicity distribution of stars in any galaxy is yet clear. We do not quite understand how gEs have achieved the high metallicities that are measured (e.g., Arimoto et al. (1997)), either. Popular theories suggest an instantaneous chemical enrichment at an early stage of galactic evolution, converting most of the gas into stars, in order to explain the high metallicities of gEs (Larson (1974); Tinsley & Larson (1979); Yoshii & Arimoto (1987), Weiss et al. (1995); Arimoto et al. (1997); Gibson (1997)). But, it is still unclear why gEs had to go through such explosive starbursts at the same epoch. While we admit our ignorance on the galactic chemical evolution, we have adopted the popular abundance distribution models of Yoshii & Arimoto (1987, hereafter YA87) and of Tantalo et al. (1996, hereafter “Infall” models).
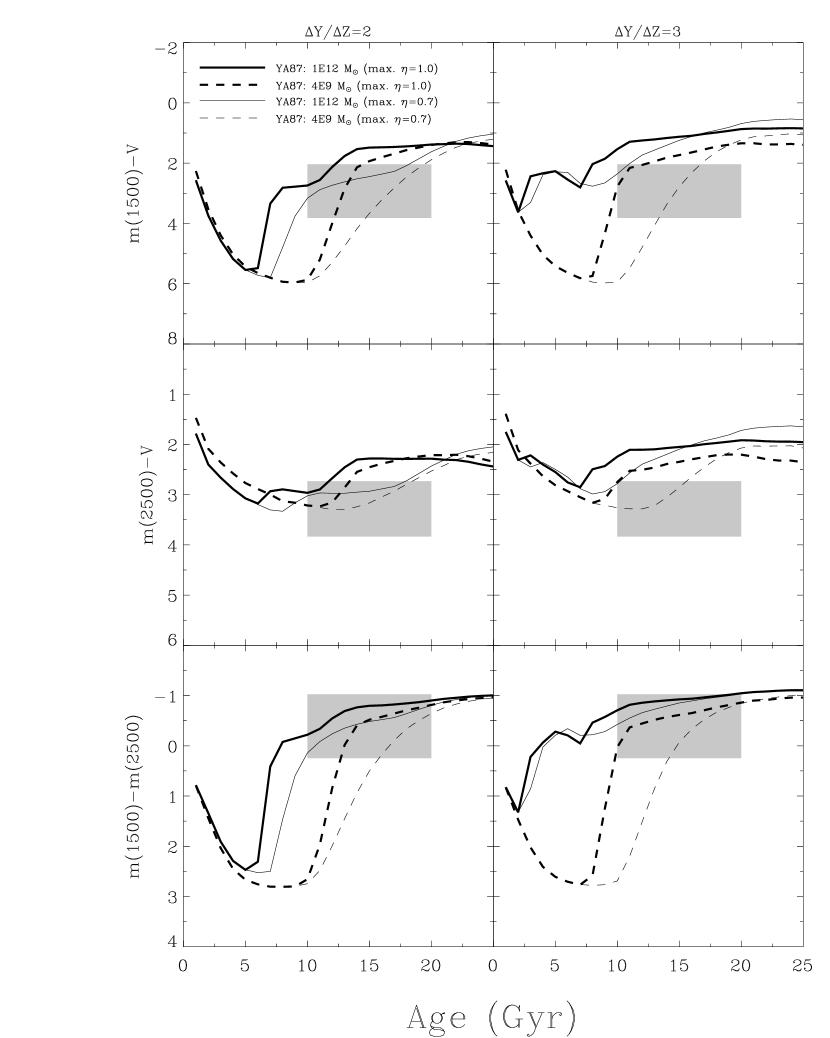
Figure 3 displays four composite models based on the YA87 distributions. The building blocks are the single abundance models described in Section 3.1. Models shown as solid lines are based on the YA87 model, the majority of whose stars are 2 . The other models (dashed lines) are for a galaxy of in which the majority of stars have . These two models are believed to approximately cover the metallicity range of gEs whose optical spectra suggest a high metallicity ( )555We do not argue that these masses defined by the YA87 models are adequate for gEs. We only tried to adopt realistic metallicity distributions whose average metallicities match those of gEs..
YDO suggested that in metal-rich stars should be larger than 0.7 for the metal-rich HB hypothesis to work. In order to indirectly estimate the true in metal-rich stars, we have constructed models that are based on the variable- hypothesis, but with a different . The thin lines are the models with the cutoff at = 0.7; i.e., = 0.5 for = 0.0004 and = 0.7 for 0.004. These models generate the lower bounds of the predicted UV flux. Meanwhile, the hydrodynamical simulations of the Iowa State group666Iowa State group’s simulations were carried out only up to = . We are not certain which value of such a study would predict for the stars of . So, we used the same suggested for = (i.e., ) for the stars of . suggest = 1.0 for = . Thus, we have constructed another set of models with = 1.0; i.e., = 0.5 for = 0.0004, = 0.7 for = 0.004 & 0.01, and = 1.0 for = 0.02.
Interestingly, composite models based on the YA87 prescription deviate from the data in significantly, by predicting too much near-UV flux. Since much of the near-UV flux in the composite model comes from metal-poor stars, this may indicate that the YA87 models predict too many metal-poor stars. This is analogous to the G-dwarf problem in our Galaxy (Audouze & Tinsley (1976)), and it has been noticed by others (Tantalo et al. (1996); Worthey, Dorman, & Jones 1996). Tantalo et al. (1996) claimed that this high near-UV-flux problem can be alleviated if the chemical evolution model takes into account gas that falls in. Such infall models have been known to produce fewer metal-poor stars (Larson 1972a ; Larson 1972b ; Audouze & Tinsley (1976); Chiosi (1980); Tantalo et al. (1996); Kodama (1997)) than non-infall type models, such as the YA87 models. In addition, infall models have a lower maximum metallicity (e.g., 0.07 in Tantalo et al.’s infall models and 0.08 in YA87 models, respectively.).
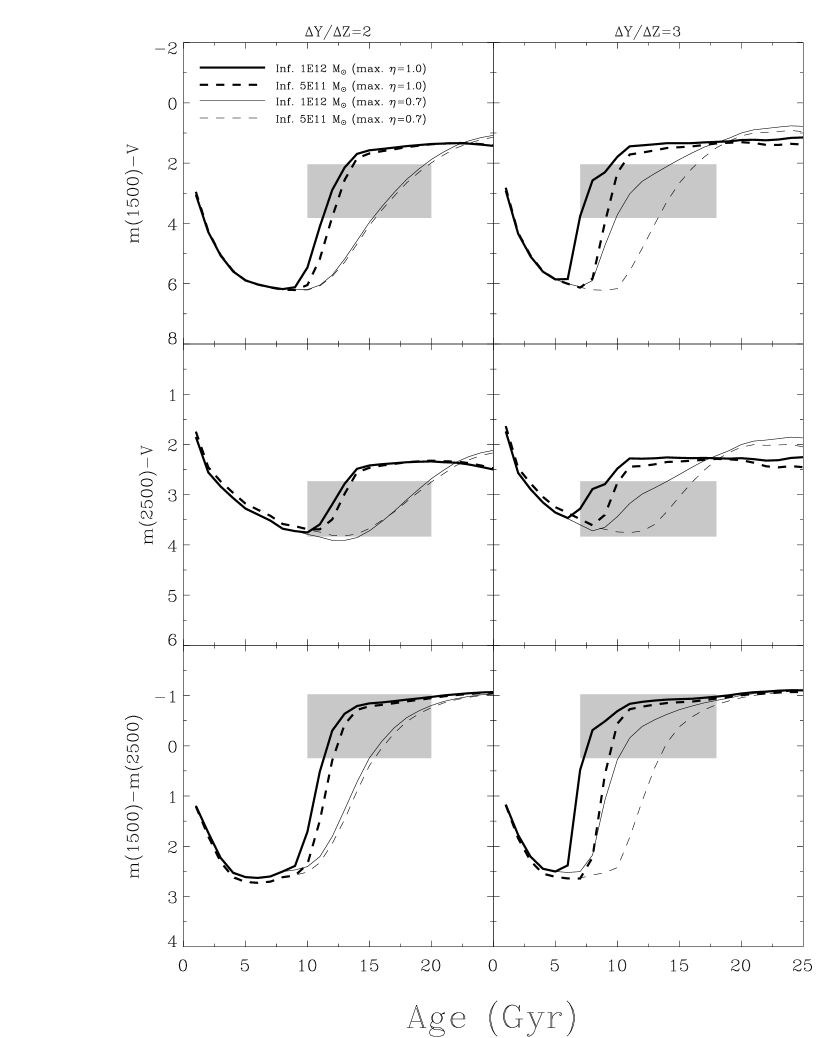
Figure 4 shows the composite models based on the abundance distributions produced by the infall model. The thin (thick) lines are based on = 0.7 (1.0). Solid (dashed) lines are based on the model distributions of () and their mean metallicities are approximately 2 (), respectively. Due to the smaller fraction of metal-poor stars in the infall model, the composite models of = 0.7 – 1.0 now consistently match the empirical data both in the far-UV and in the near-UV.
Note that models of different /lead us to different interpretations about the empirical relation between the strength of the UV upturn and metallicity. The /= 2 models predict little difference in UV flux ratios as metallicity differs by a factor of two. In this case, the observed ranges in flux ratios are likely caused by an age difference among gEs, in the sense that UV-stronger galaxies are older by about 10 – 30%. Then, the empirical UV upturn-metallicity relation has to be either spurious or a consequence of other indirectly-connected relations. In contrast, the /= 3 models suggest that a factor of two difference in metallicity is sufficiently large to cause the UV upturn-metallicity relation at a given age. This is because the metallicity-dependence of the SBP (slow blue phase) of core helium-burning stars, the dominant UV source, is more significant when the helium abundance is larger. Similarly, an age difference of about 10 – 30% among gEs can also produce an equivalent amount of difference in the UV strength. More reliable metallicity measurements would remove such entanglements between age and metallicity.
Let us see whether such composite models, whose flux ratios are in reasonable agreement with data, match the overall spectral shape. Figure 5 exhibits a 13 Gyr old infall model and the empirical spectrum of NGC 4552777 This model is not the best-fitting model but a model whose flux ratios are in reasonable agreement with those of NGC 4552. The empirical spectrum is not entirely that of NGC 4552, as described in the figure caption of Figure 1. Thus, we are not sure if this kind of mosaic spectrum is reliable enough to be used in detailed fitting. Unfortunately, we were not able to find a galaxy whose well-calibrated spectrum is available from far-UV to infrared.. They have been normalized in the band. The overall match is good. However, even though the infall model has fewer metal-poor stars compared to the non-infall type YA87 model, the model still seems to overproduce the flux in the range of 1,700 – 3,600 Å by as much as 20 – 50% (c.f., Dorman & O’Connell (1996)). Could this be still caused by uncertainties in the metallicity distribution?
Figure 6 shows that, when a model approximately fits the spectrum of NGC 4552 (middle panel), the dominant UV source is metal-rich. However, in the 1,700 – 3,600 Å range, the light contribution from metal-poor stars no longer dominates. It seems that the problem of the overpredicted near-UV flux would not disappear entirely, even if we remove the whole metal-poor stars from the model. It is unlikely that the discrepancy is caused entirely by the uncertainties in the fraction of the metal-poor stars in the model metallicity distribution.
Figure 7 shows the light contribution from less evolved (MS & RGB) stars and from evolved (post-RGB) stars. Post-RGB stars make up most of the UV flux and about 20% of optical flux. The flux from post-RGB stars have two peaks, one in the far-UV and the other approximately in the band. The far-UV peak is mostly caused by hot HB and evolved HB stars, whereas the optical peak is caused mostly by AGB and red HB stars. The flux from such evolved stars is quite uncertain, mainly because the mass loss both on the RGB and on the AGB is poorly understood. It seems that at least the overestimated flux in the range 1,700 – 2,500 Å is related with the predicted HB mass distribution, because, in this wavelength range, MS and RGB stars contribute little. If the true flux near 2,500 Å from the evolved stars is lower by about 50%, the problem with the overestimated model flux will disappear. One way of producing a lower flux in this valley is to have a temperature distribution of HB stars that is even more strongly bimodal than our models predict. We will discuss this question later in Section 6.
Despite such uncertainties, composite models, mainly based on the Infall prescription, are successful in matching the observed flux ratios in various bandpasses. As pointed out in the previous section, more metal-rich models show stronger UV upturns, if metallicity differs by a factor of two. This trend agrees with the empirical data. On the other hand, if no significant metallicity difference exists among gEs, a moderate age difference between UV-strong and UV-weak galaxies seems to be required in the sense that UV-strong galaxies are older than the UV-weak ones by 10 – 30%. Whether gEs have such a substantial age difference among themselves is still an open question (c.f., Faber, Worthey, & Gonzalez 1992; Kodama & Arimoto (1997)).
3.3 Regarding “The Onset of the UV Upturn”
The different maximum metallicity predicted by infall models and non-infall type models has a profound impact on the predicted timing of “the onset of the UV upturn”. For example, the Padova group (Bressan et al. (1994); Tantalo et al. (1996)) found that their models with /= 2.5 experience the onset of the UV upturn at 5.6 Gyr. Our models (Figures 3 & 4) confirm their suggestion qualitatively. This is potentially an important discovery, but, one has to be careful in applying this concept. Let us examine this more closely.
The large bump near 5 Gyr (3 Gyr) of age in the /= 2 (3) models based on the YA87 model (top and bottom in Figure 3) is caused mostly by the UV light coming from extremely metal-rich ( 0.06) stars. Such metal-rich stars are also helium-rich under the current assumption of a positive /, and, in fact, it is the helium abundance that is supposed to be more directly related with the UV light production (Dorman et al. (1993); YDO). For this reason, the onset of the UV upturn occurs earlier if a larger /is adopted, as shown in Figures 3 & 4.
These extremely metal-rich stars produce a tremendous amount of UV light at small ages, as shown in Figure 2 (and also in Figures 9 & 12 of YDO). However, the most metal-rich group of stars fade away early because they evolve faster than less metal-rich stars when a positive /is assumed. Then, assuming a smooth metallicity distribution (although our EPS models use discrete distributions), the next metallicity group begins to produce UV light, and so on (see Figure 2). This is perhaps the manner in which a gE develops a strong UV upturn. Thus, the timing of the onset of the UV upturn is sensitive to the maximum metallicity. Note that such a sequential development of UV flux is not predicted by single abundance models (Figure 2).
Since the infall models have a smaller maximum metallicity than YA87 models do, the onset of the UV upturn with the infall models is later, as shown in Figures 3 & 4. Tantalo et al.’s estimate of the onset of the UV upturn, 5.6 Gyr, seems to originate from the extremely metal-rich ( = 0.1) stars whose characteristic onset of the UV light production occurs at about 5.6 Gyrs, as shown in their Figure 4. Since the maximum metallicity in their infall models is 0.07 (see their Figure 12) and their building blocks have a metallicity grid of = 0.0004, 0.004, 0.008, 0.02, 0.05, and 0.1, they seem to have used the = 0.1 population to represent the extremely metal-rich ( 0.05) stars that may not be represented well by their stellar models of = 0.05. We can show the effect of the metallicity grid as well. In our Figure 4, we used Tantalo et al.’s infall models. Since our building blocks have different metallicity grids, i.e., = 0.0004, 0.004, 0.01, 0.02, 0.04, 0.06, & 0.1, we used the = 0.06 population, instead of = 0.1, to represent the stars of = 0.05 – 0.07. Then, the onset of the UV upturn is delayed significantly (to about 10 Gyr & 6 Gyr in the case of /= 2 & 3, respectively, Figure 4). If we use /= 2.5 as Tantalo et al. did, our models would suggest approximately 8 Gyr as the onset of the UV upturn. So, we argue that their estimate, 5.6 Gyr, is a product of their choice of metallicities for building blocks. But, the basic concept still holds good qualitatively.
In principle, a study (including observations) of the onset of the UV upturn would put a useful constraint on the metallicity distribution in a gE. However, in practice, the onset of the UV upturn is still quite uncertain because it is also sensitive to any input parameter that is influential to the production of evolved stars, such as /, , metallicity distribution, and even (the dispersion on the mass loss).
4 Characteristic Temperature of the UV Upturn
What are the observable properties of the stars that are responsible for the UV upturn? Do our models reproduce not only the magnitude of the UV upturn, but also the properties of the UV sources? It is extremely difficult to determine the physical properties of the major UV sources, such as mass and luminosity, from the integrated spectrum. But, it is possible to determine the probable effective temperature of the dominant UV sources reasonably well if their representative metallicity can be constrained independently. This is because the shape of the UV flux is governed mostly by the temperatures of the UV sources.
To begin with, it is convenient to define the characteristic temperature of the UV upturn, , as the effective temperature of the star whose spectrum is in best agreement with the UV spectrum of the galaxy. Precise determination of is important because it tests the validity of the stellar evolution theory and accompanying assumptions in the EPS. Any successful population synthesis model should reproduce not only the magnitude of the UV upturn but also the observed . However, since not all UV sources have the same temperature, the determination is not trivial. It is more difficult when is to be estimated from the spectrum whose UV upturn is not strong, because, then, the UV light contribution from less hot stars, such as MS stars, becomes important.
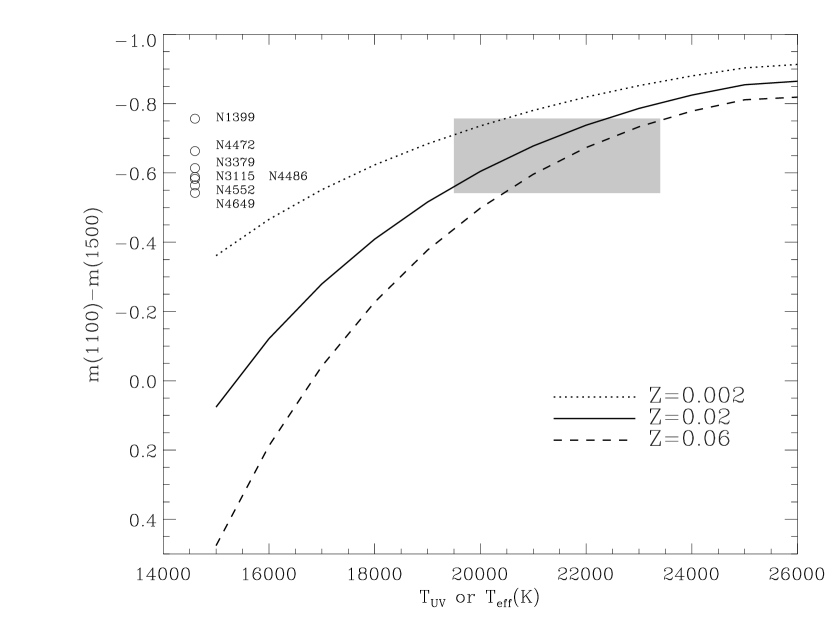
The flux ratio, , is a reasonable indicator, because the slope of the spectrum in the range = 1,000 – 1,500 Å is sensitive to . Figure 8 shows as a function of and metallicity. The value, , is certainly affected by metallicity because of the severe line-blanketing effect in the UV. Although not shown in this plot, reaches a maximum near = 50,000 (), then it drops to or so. For example, stars of = 25,000 K and 60,000 K would have similar values of . Thus, alone does not provide a unique . However, their spectra look very different below the break, and, thus, one can easily distinguish one from another by looking at the far-UV spectrum. Therefore, in practice, serves as a reliable indicator. The empirical values of of seven gEs have been measured from the HUT spectra (Brown et al. (1995)) and marked as open circles in Figure 8. The data have been placed at the left end of the figure because their ’s are not known a priori. If the dominant UV sources in gEs are metal-rich (e.g., ), as the HUT team suggested (Brown et al. (1997)), Figure 8 tells us that the empirical is approximately 19,500 – 23,400 K, which is in good agreement with Brown et al.’s (1995) estimate, 20,000 – 23,000 K.
The UV-strong gE, NGC 1399, also has a lower value of , suggesting that the UV source in this galaxy is hotter than those in other observed gEs. Note that, however, the two other UV-strong gEs, NGC 4552 and NGC 4649 (categorized in the UV-strongest galaxy group by Burstein et al. 1988), show larger values of (lower values of ) than the other UV-weak gEs, indicating that the dominant UV sources in these UV-strong gEs are cooler than those in UV-weak gEs. This trend has also been noticed by Brown et al. (1997, see their Fig. 7). We wonder if such correlation between and the magnitude of the UV upturn is real and why NGC 1399 is an exception. If a larger sample confirms this, models certainly should explain it. We attempt to explain this discovery in this section.
4.1 Single Abundance Models
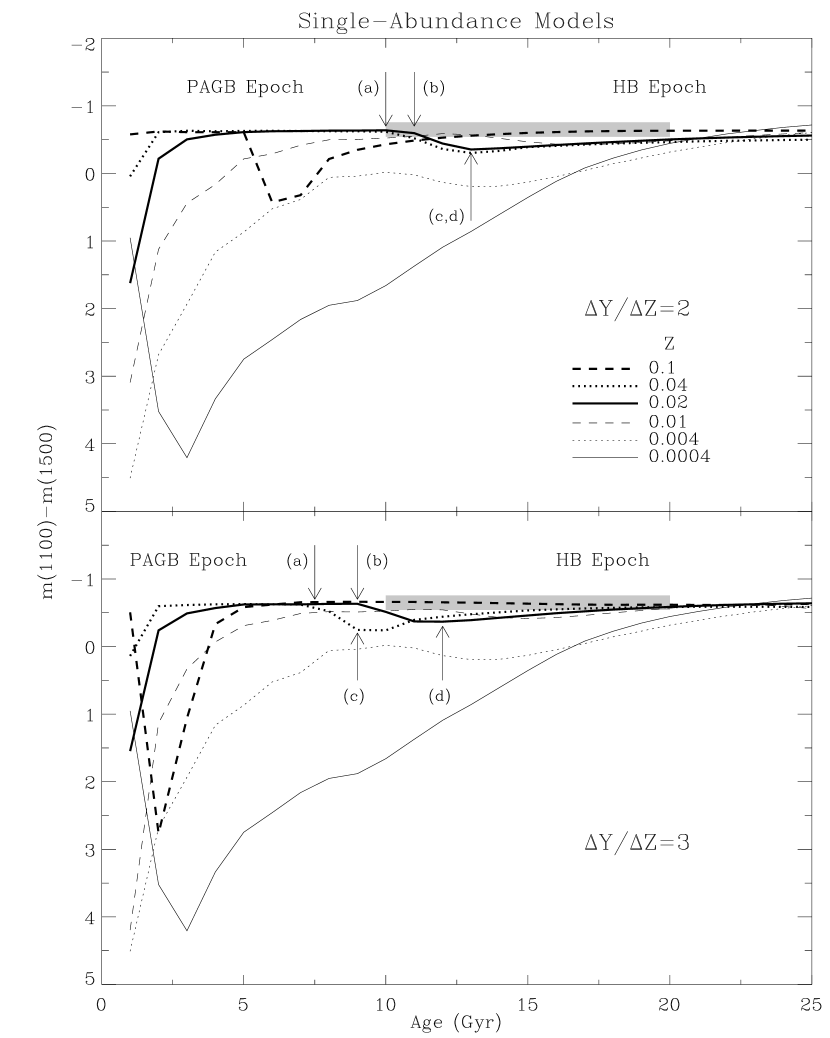
Single abundance models have been constructed and compared with empirical data in Figure 9. The narrow shaded box is the observed range of defined by the seven HUT spectra whose estimated values of are shown in Figure 8, assuming these galaxies are between 10 and 20 Gyrs old. The models were constructed with the same parameters as shown in Figure 2. As in the case of the magnitude of the UV upturn, /affects the model predictions only in terms of the required age.
Metal-rich models show a constant high flux ratio () at low ages (left of arrows (a) & (b)). The arrows (a) & (b) indicate the turning points of the = 0.04 & 0.02 model in age at which core helium-burning stars become more important UV sources than PAGB stars. In the PAGB epoch, does not vary much. This is because PAGB stars, the dominant UV sources at small ages, follow very similar evolutionary tracks as the masses of their progenitors vary, according to conventional PAGB evolution models.
Almost no metallicity dependence is visible between the models of = 0.02 and 0.04. This may be largely an artifact because YDO constructed their EPS models using the same PAGB tracks (tracks of the Kiel group: Schönberner (1979); Schönberner (1983); Blöcker & Schönberner (1990)) for different metallicities and using the same stellar spectra for stars of 50,000 K. But, the effect of metallicity on the stellar spectrum should not be large at high effective temperature. Unless PAGB tracks are very sensitive to metallicity (c.f., Vassiliadis & Wood (1994)), this approximation should be reasonable. Despite such uncertainties, model flux ratios in are in surprising agreement with the empirical values of UV-weak gEs (top end of the shaded box). If this constant is not an artifact, this would suggest that the dominant UV sources in UV-weak gEs are PAGB stars. This argument is consistent with the HUT team’s conclusion on the dominant UV source in the bulge of M 31 whose UV upturn feature is weaker than those in UV-strong gEs (Ferguson and Davidsen (1993)).
As a metal-rich galaxy ages, a larger number of hot (but, still cooler than PAGB stars) core helium-burning stars are produced, dominating over PAGB stars in the far-UV and causing an increase in the value of . Suppose that gEs have ages between the two turning points (a) and (b), that is, 10 – 11 Gyr if /= 2 (or 7.5 – 9 Gyr if /= 3), and that gEs are reasonably represented by metal-rich single-abundance models. Then, the puzzling phenomenon of UV-weak gEs showing a higher (see the header of Section 4) can be explained by a metallicity difference, in the sense that UV-strong galaxies are more metal-rich by a factor of two in . Although this explanation is consistent with the explanation of the UV upturn-metallicity relation, we are uncomfortable with such a fine tuning of the age and metallicity of gEs. Alternatively, the higher of UV-weak gEs can be explained if UV-weak gEs are somewhat younger.
Once core helium-burning stars dominate over PAGB stars as UV sources, decreases (becoming bluer) with increasing age, experiencing another turning point, (c) for = 0.04 and (d) for = 0.02. From this second turning point on, core helium-burning stars dominate the UV flux, and as core helium-burning stars become hotter, decreases. The UV-strong gE with a higher , NGC 1399, can be explained if it is already passed the second turning point. Then, this would suggest either that NGC 1399 is older than other gEs observed if no significant metallicity difference exists, or that it is more metal-rich in which case the second turning point occurs earlier if these gEs are of similar ages, or perhaps both combined. Since NGC 1399 is one of the most metal-rich gEs (at least with a high Mg2, [Dorman et al. 1995]), such explanations are reasonable. It is clear that, if metallicity is uncertain, alone cannot constrain the age of the galaxy.
Metal-poor models take quite different paths. At small ages, metal-poor models still have significant UV light coming from MS stars. Then, before MS stars become cool enough, hot HB stars develop and PAGB stars never have a chance to dominate the UV spectrum. Thus, metal-poor models never reach such a blue epoch as metal-rich models easily do, unless a very large age ( 20 Gyr) is adopted. This shows that metal-poor models cannot match the empirical .
4.2 Composite Models
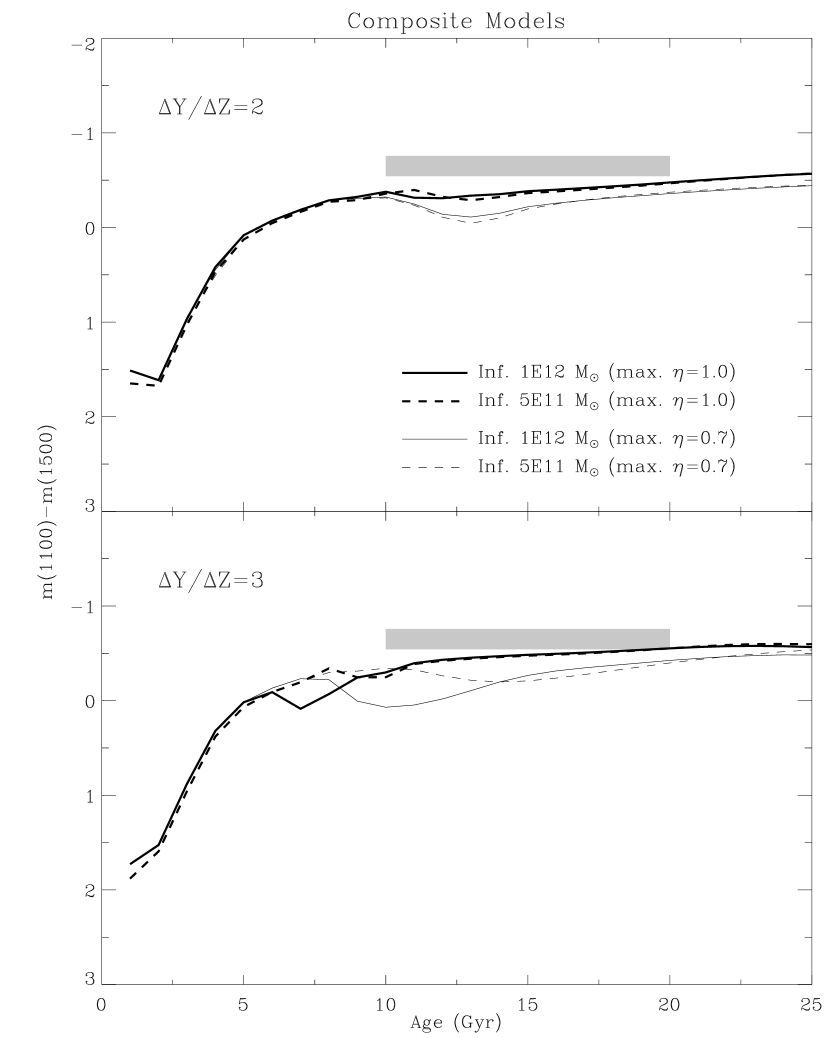
Unlike the moderate success of the single abundance models in matching the observed range of , composite models (Figure 10), constructed in the same manner as those in Figure 4 using the infall models, do not match the observed range of well. Models are slightly redder than observed. At least part of this is caused by the overestimated near-UV light discussed in Section 3.2. If we trust our single abundance models, this would suggest that the mean metallicity of the majority of stars in a gE must be peaked around approximately 1 – 2 . As the metallicity dispersion is larger, the fits would become worse. However, it would be premature to conclude so until single abundance models are empirically checked first.
5 Two Color Diagrams in the UV
Two color diagrams are presented in Figures 11 – 12. In Figure 11, empirical data (filled circles) are compared with single abundance models. The 13 Gyr models are marked as open circles with metallicity shown next to them. Models of approximately solar abundance match the data reasonably if gEs are about 13 Gyrs old. In the metal-rich regime, the effect of metallicity and that of age are almost on top of each other, making these quantities hard to extract from flux ratios alone. However, for metal-poor populations, such two color diagrams based on UV flux ratios can provide a good age estimate.
As pointed out earlier, composite models (Figure 12) somehow overpredict the flux in the near-UV, even if infall models are adopted. At the moment, it is unclear whether this mismatch is caused by the uncertainties in the chemical evolution model or by others, such as those in the HB mass distribution treatment.
6 Discussion: Uncertainties in the Models
It has been pointed out earlier that colors derived from EPS models are sensitive to the uncertainties in the stellar evolutionary tracks and in the stellar spectral libraries (Worthey (1994); Charlot, Worthey, & Bressan 1996). In the UV, however, so little is known about the late phase of stellar evolution that even such basic input assumptions as mass loss and /play significant roles (Greggio & Renzini (1990); Jørgensen & Thejll 1993b ; YDO). YDO investigated the effects of mass loss, /, the IMF slope , and mass dispersion on the HB, among many sources of uncertainties. A few additional comments are discussed in this section.
6.1 Mass Loss
Mass loss is one of the most influential input parameters to the UV flux because it determines the masses (thus ) of HB stars that are important UV sources. However, little is known about the processes of mass loss. Reimers’ empirical formula (Reimers (1975); Renzini (1981)) has been widely used in many EPS studies, thanks to its simple parameterized form, but, the mass loss efficiency parameter, , is not well-determined. Various population studies regard or the amount of mass loss as a free parameter. Thus one should be aware of the effects of the assumed mass loss treatment in order to decipher the results from a UV EPS study properly.
For instance, if a very small ( 0.5) is used, models produce a much lower UV flux at a given time888 Somehow, the Padova group (Bressan et al. (1994); Tantalo et al. (1996)) achieved an equivalent amount of UV flux to ours at a fixed age, even though they used a much lower (= 0.45) than ours (= 0.7 – 1.0 for metal-rich stars). Since the UV flux is also sensitive to the amount and the dispersion of the mass loss, it would be necessary to compare such quantities in their studies to those in YDO.. Such low ’s mostly stem from HB morphology fittings (see YDO) that are carried out for metal-poor stars. However, there seems to be a metallicity dependence of ; for example, the UV spectra of relatively metal-rich Galactic globular clusters already indicate 0.5 – 0.7.
For another example, Park (1995) and Park & Lee (1996) used a fixed mass loss, that is = 0.223 regardless of age and metallicity, in their EPS studies. This value, = 0.223 , in fact corresponds to 1.0 for = 0.0001, 0.7 for = 0.004, 0.5 for = 0.02, and 0.4 for = 0.06 at the age of 15 Gyr (see Figures 3 – 4 in YDO), which is exactly opposite to the variable- hypothesis discussed in YDO. Remember that the metallicity dependence of mass loss for a fixed was one of the necessary conditions in producing a UV upturn (see Section 5). Thus this constant assumption drives metal-poor populations in a composite galaxy model to produce more UV flux than the conventional ( 0.3 – 0.5 in metal-poor stars) allows, while it suppresses metal-rich populations from developing hot HB stars and thus from generating a high UV flux. This is an extreme prescription, given present knowledge about mass loss. Consequently, they conclude that the UV upturn phenomenon in gEs is caused by metal-poor HB stars. This example clearly illustrates the high sensitivity of the UV population synthesis to the mass loss treatment.
There has been a different approach to the mass loss, which allows a dispersion in in red giants instead of assuming a dispersion in (Jørgensen & Thejll 1993a ; D’Cruz et al. (1996), see also Castellani & Castellani (1993)). This is an interesting idea and may be plausible if some dispersions in physical or chemical properties of red giants, such as rotation or convection, are causing a difference in the mass loss efficiency (or ) which is a more fundamental quantity than . However, a current model of this kind (D’Cruz et al. (1996)) seems to produce UV sources that are too hot ( 28,000 K) to be consistent with the estimated temperature of the major UV sources in gEs (20,000 – 23,000 K). This approach deserves attention, and its physical basis and impact on EPS models should be investigated further.
6.2 /
A fundamental basis of the metal-rich HB hypothesis is a postive /. A higher /causes a model galaxy to develop a UV upturn more quickly because of the evolutionary pace on the RGB and the SBP (slow blue phase) phenomenon, both of which are positively correlated with helium abundance (YDK). What if / 2? Then, the SBP phenomenon would be insignificant. Jørgensen and Thejll (1993b) claimed that the metallicity dependence of the magnitude of the UV upturn can be achieved only when the true value of /in gEs is larger than the value in the Sun. This is true if in metal-rich stars is significantly smaller than 1.0. For instance, if we show the metal-rich single abundance models of = 0.3 – 0.5 as a function of age and metallicity as in Figure 2, our models would be consistent with what Jørgensen and Thejll suggested. On the other hand, our models of = 1.0 predict a clear metallicity dependence regardless of /, as shown in Figure 2. We agree with Jørgensen and Thejll in that the metallicity dependence is more prominent as /increases (see Figure 2). However, we find it very difficult to make a general statement about such trends because such trends are quite sensitive to the adopted parameters. It is more so if such crucial input parameters as depend on metallicity.
Since approximately one half of the UV light in old, metal-rich models is attributed to SBP stars, as shown in Figures 14 & 15 in YDO, a model galaxy without a UV light contribution from SBP stars would not be able to achieve such a prominent UV upturn in a reasonable time scale as observed in gEs. In this sense, a moderate /( 2) is preferred to explain the empirical data about the UV upturn, unless other parameters, such as or , are markedly different from the assumptions used in this work. The danger is that the current choice of /basically comes from an extrapolation based on two points, that is, the assumed primordial chemical composition ([, ] [0.00, 0.23]) and the solar composition ( [0.02, 0.28]) (c.f., Dorman et al. [1995]).
6.3 Mass Distribution on the HB
YDO showed that the UV flux is sensitive to the assumed mass distribution on the HB. A truncated-Gaussian function as an approximation to the HB mass distribution in Galactic globular clusters (Rood (1973); Lee et al. (1990); Lee et al. (1994)) has been questioned mainly because of two empirical findings: (1) The HB morphology of some Galactic globular clusters, e.g., M15, is not reproducible by a Gaussian function (Rood (1990)). There are too many extremely hot HB stars with a thin envelope ( 0.05 – 0.15 ) to be explained by single-Gaussian models. (2) There are several hot stars in the old open cluster NGC 6791 and for three of them the best fit is acquired by the evolved HB models of 0.005 (Liebert et al. (1994)). The presence of subdwarf B stars raises the same question (Sweigart et al. (1974)). These stars are not predicted to exist by the minimum hypothesis that was discussed in detail by YDO and used in this study. The minimum hypothesis suggests that HB stars cannot have smaller envelope mass than a critical value because their precursors, red giants, cannot initiate helium core flash at the tip of the RGB if is smaller than the critical value and the helium core flash is not believed to remove any significant amount of envelope material into space. While the exact value is still uncertain, YDO adopted 0.01 as the minimum on the HB. See YDO for the detailed discussion that includes different views. As the minimum in the EPS decreases, the resulting UV flux becomes stronger and becomes higher. It is interesting to note that, if we discard the concept of the minimum and assume HB stars can have a virtually zero , then the problem of the low in the composite models (Figure 10) may disappear. A further investigation is necessary.
Is the single-mass Gaussian assumption appropriate? We pointed out in Section 3.2 that our models produce too much near-UV flux. This could be a sign of the inadequacy of a single-mass Gaussian function for the HB mass distribution. If the true HB temperature distribution is somehow more bimodal than a single-mass Gaussian function would predict, and therefore if blue HB stars are slightly bluer and red HB stars are slightly redder than a single-mass Gaussian would function predict, the fitting, shown in Figure 5, would be better. One can achieve such near-perfect fits if a bimodal HB mass distribution, with two mass peaks, is adopted (Dorman et al. (1995)). If a single-mass Gaussian function turns out to be a bad approximation, such efforts with multiple variables would be unavoidable. However, one has to be careful in introducing one more parameter in the already-complex EPS technique.
Alternatively, the current stellar evolution theory may not be accurate enough to match the data more closely than what we have already achieved. For instance, current models do not take into account any mass loss after stars arrive at the zero-age HB. In fact, low-mass HB stars are good places to expect some mass loss even if their surface gravities are higher than those of red giants. This is because the hydrogen-burning shell is so close to the atmosphere in those stars. Because of their proximity to the energy generating shell, the envelope and atmosphere of such hot stars directly feel the impact of the hydrogen shell burning that takes place during their HB evolution. Demarque & Eder (1985) showed that a small mass loss rate on the HB ( – /yr) is enough to generate hot HB stars and to explain the existence of the field sdB stars. More detailed and modern calculations would be necessary.
How important is binary evolution? Additional mass loss may take place both before and after the helium core flash and create low-mass HB stars in binary evolution (Mengel, Norris, & Gross 1976; Fusi Pecci et al. (1993); Liebert et al. (1994)). In fact, Green et al. (1997) found evidence that most of these hot stars in NGC 6791 are remnants of binary evolution. It is important to understand the impact of binary evolution on stellar evolution first and its significance in an environment like gEs. Binary scenario may attract more attention because UV upturns are found to be more significant in the dense cores of gEs.
If any of these (or other unknown) possibilities mentioned above occurs, the presence of hot stars in the field, in some globular clusters, and in NGC 6791 would be easier to understand. Detailed theoretical (both evolutionary and hydrodynamical) modeling of mass loss as well as detections of hot stars, such as the slow blue phase stars, are crucial for a better understanding of the UV upturn.
Because UV population models are sensitive to the assumed HB mass distribution (see also YDO), modelers should explicitly explain their HB prescription. There are many EPS models currently, but not many of them provide sufficient information about input parameters and assumptions, making comparisons very difficult. Dorman et al. (1995) and Park & Lee (1997) are among the few EPS models with sufficient information, so we could clarify the differences between their models and ours. Unfortunately, we do not have enough information about the assumed HB mass distribution in the work of Bressan et al. (1994) whose approach and conclusion seem to be closest to ours.
6.4 Abundance Distribution in a Galaxy
Our study supports the suggestion of Tantalo et al. (1996) and Kodama (1997) that infall models have advantages of matching the near-UV spectrum better than simple (non-infall) composite models. While such alternatives in chemical evolution models give better fits to the data, one should also be aware how sensitive EPS models are to slight alterations in the adopted chemical evolution model (particularly in the UV). It must be significant, however, that single age, single metallicity models fit the UV observations better than the simplest chemical evolution composite models.
7 Summary and Conclusions
The models based on the metal-rich HB hypothesis seem to satisfy all the empirical constraints related with the UV upturn phenomenon for reasonable input parameters. Under the conventional assumptions of stellar evolution theory, evolved low-mass, metal-rich ( ) core helium-burning stars are likely to be the dominant UV source in gEs, as suggested by earlier studies (Greggio & Renzini (1990); Bressan et al. (1994); Dorman et al. (1995); Yi et al. (1995); Brown et al. (1997); YDO).
The UV upturn is an intricate phenomenon played by an orchestra of various instruments among which the following two phenomena have the most profound effects. (1) More metal-rich red giants experience higher mass loss even for a mass loss efficiency parameter , according to Reimers’ formula. This is because a more metal-rich red giant has a higher opacity in the atmosphere, and the higher opacity causes a larger stellar radius, and a smaller surface gravity, which results in a larger mass loss (see discussion in Horch et al. (1992) and references therein). After the large mass loss, a more metal-rich red giant becomes a lower-mass HB star. However, a large opacity in metal-rich stars causes even low-mass HB stars to become red (low ). So mass loss cannot reproduce by itself the observed magnitude of the UV upturn. (2) The SBP (slow blue phase) phenomenon, the UV bright phase of the core helium-burning stars, is more prominent in more metal-rich stars when a positive /is assumed. Consequently, the magnitude of the UV upturn increases with increasing metallicity under the assumption of a positive /, which is consistent with the empirical discovery (Faber (1983); Burstein et al. (1988)). Composite models seem to reproduce the observed range of the magnitude and the characteristic temperature of the UV upturn () reasonably. However, their match is not as good as those of single abundance models. This may indicate a large uncertainty in galactic chemical evolution models.
If such small mismatchs are considered acceptable, we may claim that a simple instantaneous burst model of the formation of gEs naturally develops a UV upturn with the observed characteristics. The full range of the observed magnitude of the UV upturn (or, ) can be produced either by a metallicity dispersion (e.g., the majority of stars in UV-strong galaxies are 2 and those in UV-weak galaxies are ) or by an age dispersion (UV-strong galaxies being older than UV-weak galaxies) among gEs, or perhaps both combined. At least some age difference seems to be favored if a factor of two difference in metallicity among gEs is unlikely. Models (single abundance models) also match the observed range of (the characteristic temperature of the UV upturn) rather precisely. It is interesting to note the apparently reverse correlation between the magnitude of the UV upturn and (with the exception of NGC 1399), although it is not yet statistically significant. Under the current assumption of input parameters, this phenomenon is also understandable by the same scenario that explains the UV upturn-metallicity relation.
The UV upturn may serve as a relative-age indicator, provided the mean metallicity in a gE can be independently determined either through spectroscopic or photometric studies. However, it seems premature to use the UV upturn as an absolute-age indicator until input parameters are much better constrained. A more secure calibration of the UV upturn (e.g., for the precise dating of galaxies) will require improvements in our understanding of various things including mass loss during stellar evolution and the origin and evolutionary status of sdB stars in gEs. Willson et al. (1996) (also Bowen & Willson (1991)) have recently claimed that their hydrodynamical models describe the mass loss better than Reimers’ formula with a fixed mass loss efficiency parameter. It would be a great step forward if such new approaches can provide the astronomical community with a parameterized mass loss formula for single stars that matches the observations and is easy to use. In the same line, the role and frequency of binary stars, which appear responsible for at least a fraction of the sdB’s in the stellar population of gE’s, has to be studied further.
More fundamentally, it is crucial to obtain a larger and reliable sample of spectra of nearby gEs. It is almost unbelievable that there is hardly any gE whose well-calibrated spectrum is available from far-UV to infrared. It is important to acquire the whole wavelength range of spectrum in order to find a unique solution using the EPS technique. The far-UV (including the break) spectrum is particularly important because it provides important clues to the properties of the UV sources.
We have not even touched other complexities, such as uncertainties in the stellar evolutionary calculation, which can be tested best by observing nearby stellar populations, and in the spectral library. The role of dust and of galaxy merging history could be as important as the ones that are discussed here. So, the question about the UV upturn is still open. However, we feel that the current EPS studies are going toward its solution; at least, this model (the metal-rich HB hypothesis) has survived so far.
References
- Aaronson et al. (1978) Aaronson, M., Cohen, J. G., Mould, J., & Malkan, M. 1978, ApJ, 223, 824
- Allen (1976) Allen, C. W. 1976, in Astrophysical Quantities (The Athlone Press: London), 202
- Arimoto (1996) Arimoto, N. 1996, in From Stars to Galaxies, ed. C. Leitherer, U. Fritze-v. Alvensleben, & J. Huchra (ASP), 287
- Arimoto et al. (1997) Arimoto, N., Matsushita, K., Ishimaru, Y., Ohashi, T., & Renzini, A. 1997, ApJ, 477, 128
- Arimoto & Yoshii (1987) Arimoto, N., & Yoshii, Y. 1987, A&A, 173, 23
- Audouze & Tinsley (1976) Audouze, J., & Tinsley, B. M. 1976, ARA&A, 14, 43
- Bertola et al. (1993) Bertola, F., Burstein, D., Buson, L. M., & Renzini, A. 1993, ApJ, 403, 577
- Bica (1988) Bica, E. 1988, A&A, 195,76
- Blöcker & Schönberner (1990) Blöcker, T., & Schönberner, D. 1990, A&A, 240, L11
- Bowen & Willson (1991) Bowen, G. H., & Willson, L. A. 1991, ApJ, 371, L53
- Bressan et al. (1994) Bressan, A., Chiosi, C., & Fagotto, F. 1994, ApJS, 94, 63
- Brown et al. (1995) Brown, T. H., Ferguson, H. C., & Davidsen, A. F. 1995, ApJ, 454, L15
- Brown et al. (1997) Brown, T. M., Ferguson, H. C., Davidsen, A. F., & Dorman, B. 1997, ApJ, 482, 685
- Bruzual & Charlot (1993) Bruzual, A. G., & Charlot, S. 1993, ApJ, 405, 538
- Burstein et al. (1988) Burstein, D., Bertola, F., Buson, L. M., Faber, S. M., & Lauer, T. R. 1988, ApJ, 328, 440
- Buzzoni et al. (1992) Buzzoni, A., Gariboldi, G., & Mantegazza, L. 1992, AJ, 103, 1814
- Castellani & Castellani (1993) Castellani, M., & Castellani, V. 1993, ApJ, 407, 649
- Castellani & Tornambé (1991) Castellani, M., & Tornambé, A. 1991, ApJ, 381, 393
- Chaboyer et al. (1996) Chaboyer, B., Demarque, P., Kernan, P. J., Krauss, L. M., & Sarajedini, A. 1996, MNRAS, 183, 683
- Charlot et al. (1996) Charlot, S., Worthey, G., & Bressan, A. 1996, ApJ, 457, 625
- Chiosi (1980) Chiosi, C. 1980, A&A, 83, 206
- Code & Welch (1979) Code, A. D., & Welch, G. A. 1979, ApJ, 228, 95
- Demarque & Eder (1985) Demarque, P., & Eder, J.-A. 1985, in Horizontal-Branch and UV-Bright Stars, ed. A. G. Davis Philip (Schenectady: L. Davis Press), 91
- Demarque & Pinsonneault (1988) Demarque, P., & Pinsonneault, M. H. 1988, in Progress & Opportunities in Southern Hemisphere Optical Astronomy, eds. V. M. Blanco & M. M. Phillips (San Francisco: ASP), 371
- Dorman et al. (1993) Dorman, B., Rood, R. T., & O’Connell, R. 1993, ApJ, 419, 596
- Dorman & O’Connell (1996) Dorman, B., & O’Connell, R. 1996, in From Stars to Galaxies, eds. C. Leitherer, U. Fritze-v. Alvensleben, & J. Huchra (ASP: San Francisco), 105
- Dorman et al. (1995) Dorman, B., O’Connell, R., & Rood, R. T. 1995, ApJ, 442, 105
- D’Cruz et al. (1996) D’Cruz, N. L., Dorman, B., Rood, R. T., & O’Connell, R. 1996, ApJ, 466,359
- Faber (1983) Faber. S. M. 1983, Highlights Astr., 6, 165
- Ferguson et al. (1991) Ferguson, H. C. and the HUT team, 1991, ApJ, 382, L69
- Ferguson (1995) Ferguson, H. C. 1995, in IAU Symposium 164, Stellar Populations, ed., P. C. Van der Kruit & G. Gilmore (Dordrecht: Reidel), 239
- Ferguson and Davidsen (1993) Ferguson, H. C., & Davidsen, A. F. 1993, ApJ, 408, 92
- Fusi Pecci et al. (1993) Fusi Pecci, F., Ferraro, F. R., Bellazzini, M., Djorgovski, S., Piotto, G., & Buonanno, R. 1993, AJ, 105, 1145
- Green et al. (1997) Green, E. M., Liebert, J. W., Peterson, R. C., & Saffer, R. A. 1997, in The Third Conference on Faint Blue Stars, in press
- Greggio & Renzini (1990) Greggio, L., & Renzini, A. 1990, ApJ, 364, 35
- Gibson (1997) Gibson, B. K. 1997, preprint, astro-ph/9705104
- Guiderdoni & Rocca-Volmerange (1987) Guiderdoni, B., & Rocca-Volmerange, B. 1987, A&A, 186, 1
- Gunn et al. (1981) Gunn, J. E., Stryker, L. L., & Tinsley, B. M. 1981, ApJ, 249, 48
- Horch et al. (1992) Horch, E., Demarque, P., & Pinsonneault, M. 1992, ApJ, 388, L53
- (40) Jørgensen, U. G., & Thejll, P. 1993a, A&A, 272, 255
- (41) Jørgensen, U. G., & Thejll, P. 1993b, ApJ, 411, L67
- Kodama (1997) Kodama, T. 1997, Ph.D. Thesis, Tokyo University
- Kodama & Arimoto (1997) Kodama, T., & Arimoto, N. 1997, A&A, in press
- Kurucz (1992) Kurucz, R. 1992, in The Stellar Population in Galaxies, ed. B. Barbuy & A. Renzini (Dordrecht: Reidel), 225
- (45) Larson, R. B. 1972a, Nature, 236, 21
- (46) Larson, R. B. 1972b, Nature Physical Science, 236, 62
- Larson (1974) Larson, R. B. 1974, MNRAS, 166, 585
- Lee (1994) Lee, Y.-W. 1994, ApJ, 430, L113
- Lee et al. (1990) Lee, Y.-W., Demarque, P., & Zinn, R. 1990, ApJ, 350, 155
- Lee et al. (1994) Lee, Y.-W., Demarque, P., & Zinn, R. 1994, ApJ, 423, 248
- Liebert et al. (1994) Liebert, J., Saffer, R. A., & Green, E. M. 1994, AJ, 107, 1408
- Magris & Bruzual (1993) Magris, G. C., & Bruzual, A. G. 1993, ApJ, 417, 102
- Mengel et al. (1976) Mengel, J. G., Norris, J. & Gross, P. G. 1976, ApJ, 204, 488
- Nesci & Perola (1985) Nesci, R., & Perola, G. C. 1985, A&A, 145, 296
- O’Connell et al. (1992) O’Connell, R. W. et al. 1992, ApJ, 395, L45
- Park (1995) Park, J.-H. 1995, Ph.D. Thesis, Yonsei University
- Park & Lee (1997) Park, J.-H., & Lee, Y.-W. 1996, 476, in press
- Reimers (1975) Reimers, D. 1975, Mém. Soc. Roy. Sci. Liège, 6th Ser., 8, 369
- Renzini (1981) Renzini, A. 1981, in Physical Processes in Red Giants, ed. I. Iben & A. Renzini (Dordrecht: Reidel), 431
- Rocca-Volmerange (1988) Rocca-Volmerange, B. 1988, MNRAS, 236, 47
- Rood (1973) Rood, R. T. 1973, ApJ, 184, 815
- Rood (1990) Rood, R. T. 1990, in The Confrontation between Stellar Pulsation and Evolution, ed. C. Cacciari & G. Clementi (San Francisco: ASP), 11
- Salpeter (1955) Salpeter E. E. 1955, ApJ, 121, 161
- Schönberner (1979) Schönberner, D. 1979, A&A, 79, 108
- Schönberner (1983) Schönberner, D. 1983, ApJ, 272, 708
- Sweigart et al. (1974) Sweigart, A. V., Mengel, J. G., & Demarque, P. 1974, A&A, 30, 13
- Tantalo et al. (1996) Tantalo, R., Chiosi, C., Bressan, A., & Fagotto, F. 1996, A&A, 311, 361
- Tinsley & Larson (1979) Tinsley, B. M., & Larson, R. B. 1979, MNRAS, 186, 503
- van Albada et al. (1981) van Albada, T. S., de Boer, K. S., & Dickens, R. J. 1981, MNRAS, 195, 591
- Vassiliadis & Wood (1994) Vassiliadis, E., & Wood, P. R. 1994, ApJS, 92, 125
- Weiss et al. (1995) Weiss, A., Peletier, R. F., & Matteucci, F. 1995, A&A, 296, 73
- Willson et al. (1996) Willson, L. A., Bowen, G. H., & Struck, C. 1996, in From Stars to Galaxies, ed. C. Leitherer, U. Fritze-v. Alvensleben, & J. Huchra (ASP), 197
- Worthey (1994) Worthey, G. 1994, ApJS, 95, 107
- Worthey et al. (1996) Worthey, G., Dorman, B., & Jones, L. A. 1996, ApJ, 112, 948
- Worthey et al. (1992) Worthey, G., Faber, S., & Gonzalez, J. J. 1992, ApJ, 398, 69
- Yi (1996) Yi, S. 1996, Ph.D. Thesis, Yale University
- Yi et al. (1995) Yi, S., Afshari, E., Demarque, P., & Oemler, A. Jr. 1995, ApJ, 453, L69
- (78) Yi, S., Demarque, P., & Kim, Y.-C. 1997, ApJ, 482, 677 (YDK)
- (79) Yi, S., Demarque, P., & Oemler, A. Jr. 1997, ApJ, 486, in press (YDO)
- Yoshii & Arimoto (1987) Yoshii, Y., & Arimoto, N. 1987, A&A, 188, 13