Redshifted molecular absorption systems towards PKS 1830211 and B 0218+357: submillimeter CO, Ci and H2O data
Abstract
We have detected the rotational transition of 12CO in absorption at = 0.89 towards the quasar PKS 1830211, but not the 12CO () or the fine structure line of neutral carbon. The intervening molecular medium thus has a total 12CO column density of cm-2with a most likely value of (CO) , which corresponds to the large column density of molecular hydrogen of (H2)= cm-2 and a reddening of Av = 25 magnitudes. The 12CO excitation temperature is low, below 15 K. Comparison with the molecular absorption results of Wiklind and Combes ([1996]) shows that the absorbing material has similar molecular abundances to Galactic dark clouds. We find an upper limit for atomic carbon of (Ci), which again would be the case for most Galactic dark clouds.
We also report new observations of the absorbing system towards B 0218+357 at = 0.68. We have tentatively detected the 13CO () line, but for H2O, although a feature is seen at the correct velocity, due to the inadequate signal to noise ratio we report only an upper limit for the fundamental line of ortho water vapor. The tentative detection of the 13CO line implies that the 13CO excitation temperature is lower than 20 K and the column density is fairly large, (13CO) cm-2, with a likely value of (13CO) cm-2, giving rise to saturated absorption in the () transition. The total column density of molecular gas is again large in this source, (H2) cm-2, which corresponds to a reddening larger than 20 magnitudes.
To appear in Astrophysical Journal Letters
Subject headings: (Galaxies: quasars:) absorption lines — Galaxies: quasars: individual (PKS1830211,B0218+357) — Galaxies: ISM — ISM: Molecules
1 Introduction
Table 1.
Flux densities and line intensities from PKS 1830211.
| Line | Observed | March 1996 | July 1996 | Combined | ||
|---|---|---|---|---|---|---|
| Frequency | Continuum | Line | Continuum | Line | Line | |
| 12CO() | 244 GHz | |||||
| Ci() | 261 GHz | |||||
| 12CO() | 305 GHz | |||||
The continuum fluxes are in Jy, while the line intensities are the fractional absorption depths given relative to the SSB continuum level with a velocity resolution of 6 km s-1. The line width of the CO() line is km s-1. Upper limits and errors are given at the 1 level.
Table 2.
Flux densities and line intensities from B 0218+357.
| Line | Observed | September 1995 | October 1996 | ||
|---|---|---|---|---|---|
| Frequency | Continuum | Line | Continuum | Line | |
| 13CO() | 261 GHz | ||||
| H2O | 330 GHz | ||||
The continuum fluxes are in Jy, while the line absorption intensities are given relative to the SSB continuum level with a velocity resolution of 1.5 km s-1 for the 13CO line and 6 km s-1 for the H2O line. Upper limits are given at the 1 level.
1.1 PKS 1830211
In addition to emission line observations, the interstellar medium of distant galaxies can be probed by absorption lines when a background continuum source is present. The intervening galaxies of gravitationally lensed QSOs fulfill this condition. Wiklind and Combes ([1994], [1995]) have searched for molecular line absorption towards such sources and in a few cases have detected molecules such as HCO+, HCN, HNC, and CO that are commonly found in dark interstellar clouds within the Galaxy. The most remarkable example is the line of sight toward the radio source PKS 1830211, for which the redshift of the intervening galaxy was determined by molecular absorption line spectroscopy to be = 0.88582 (Wiklind & Combes [1996]).
The flat spectrum radio source PKS 1830211 is well established as being a gravitationally lensed object (Rao & Subrahmanyan [1988]) with no optical counterpart (Djorgovsky et al. [1992]). Recent radio images (van Ommen et al. [1995]) show two major components separated by about 1 arcsec, with a minor, possibly demagnified, third component between them. The system has been modeled as two images of a background source with a core-jet morphology, magnified and distorted by an intervening galaxy which partially obscures the southwest image. There is a time delay between the two lensed images of days (van Ommen et al. [1995]). The flux density varies with time, between 0.5 and 1.3 Jy at 1.3 mm (Steppe et al. [1992], [1993]), with the SW image containing between 40 and 45% of the total flux.
Wiklind and Combes ([1996]) have detected rotational lines of HCN, HNC, HCO+, H13CO+, CS, and N2H+ in the intervening galaxy. The lines are moderately narrow with a maximum linewidth of 30 km s-1. Though saturated, the absorptions do not reach the zero level, indicating that the absorbing system covers only 36% of the continuum source. This is verified by the recent maps made with the BIMA interferometer at 3mm (Frye, Welch, & Broadhurst [1997]) where molecular absorptions are detected towards the SW image only.
The data set of Wiklind and Combes ([1996]) does not include CO lines, because at the redshift of 0.89, the three lowest CO transitions are shifted to frequencies suffering severe atmospheric absorption and are impossible or difficult to observe from the ground. The next two rotational lines, however, can be observed: the 43 line at a rest frequency of 461.040 GHz and the 54 line at a rest frequency of 576.268 GHz are redshifted to 244.477 GHz and 305.579 GHz, respectively. In this paper we report observations at these two line frequencies as well as of the fine structure line of neutral carbon at 492.161 GHz, redshifted to 260.980 GHz.
1.2 B 0218+357
HI absorption has been detected at = 0.68466 toward the Einstein ring B 0218+357 (Carilli, Rupen, & Yanny [1993]), which is the prototype of a lensed object where the lensing galaxy is perfectly aligned with the QSO. The column density of absorbing material is very high, as shown by the presence of saturated lines of HCN, CO, and its isotopes (Wiklind & Combes [1995]). Formaldehyde has also been detected at centimeter wavelengths (Menten & Reid [1996]), as a weak absorption feature. The small linewidth of the molecular absorption, 5 – 10 km s-1, indicates that we are dealing with a single molecular cloud or a small number of clouds along the line of sight. Estimates of the molecular hydrogen column density range from (Menten & Reid [1996]) to (Combes & Wiklind [1995]). To aid in the understanding of the physical nature of the absorbing cloud we have searched for the 13CO(43) transition.
Combes and Wiklind ([1995]) searched unsuccessfully for molecular oxygen. We have searched for the fundamental transition of ortho water vapor at 556.936 GHz towards this object, redshifted to 330.592 GHz.
2 Observations
We observed PKS 1830211 using the Caltech Submillimeter Observatory (CSO) 10.4m telescope in March and July of 1996, under good weather conditions. The observed position was taken from NED as R.A.(1950)=18:30:40.600, Dec(1950)=21:06:00.0, near the location of the modeled lensing galaxy (Subrahmanyan et al. [1990]). The telescope is equipped with SIS receivers operated in double sideband (DSB) mode. The observations were performed by beam switching using the chopping secondary with a frequency of 1 Hz and a beam separation of 90′′. The pointing was checked on Jupiter, IRC 10216, and CIT 6 and was found to be accurate to about 3′′ rms. The frequency calibration was checked on G 34.3+0.2, a nearby ultracompact HII region. We searched for the CO() line redshifted to 244.477 GHz, the CO() line at 305.579 GHz and the Ci () line at 260.980 GHz. Single sideband (SSB) system temperatures, relevant to the line observations, were between 200 and 300 K at 244 and 261 GHz and K at 305 GHz.
The spectra were simultaneously analysed with two acousto-optic spectrometers (AOS), one with a total bandwidth of 500 MHz and an effective spectral resolution of 1.5 MHz and the other with 1.5 GHz total bandwidth, 0.9 GHz of which were usable due to the limited IF bandpass of the receiver. For the Ci observations the 500 MHz wide AOS was used. The angular resolution of the CSO is 28′′ at 244 GHz, 26′′ at 261 GHz, and 23′′ at 305 GHz. The conversion factors from Kelvins to Janskys are obtained from efficiency values given in the CSO Observing Manual and are 43 Jy/K at 230 GHz and 46 Jy/K at 345 GHz.
B 0218+357 was observed in 1995 September for two nights and in 1996 October for 4 nights. The source position, again obtained from NED, is R.A.(1950)=02:18:04.1, Dec(1950)=35:42:32. In addition to the 500 MHz AOSs, we used a narrow band AOS with a total bandwidth of 50 MHz and an effective spectral resolution 100 kHz to identify possible narrow features.
For both sources, the spectra are presented in the LSR velocity scale. To obtain heliocentric velocities, subtract 12 km s-1 for the observations toward PKS 1830211 or add 2 km s-1 in the case of B 0218+357.
3 Results

3.1 Continuum Flux
The continuum emission of PKS 1830211 was readily detected at all three frequencies in both backends. The results are summarized in Table 1 for both observing runs. The spectral index in the millimeter and submillimeter range is about -1.3. The continuum level was fainter by a factor of about 2 in July 1996; this reduction of the flux density is in agreement with the measurements at lower frequencies made at a similar epoch with the IRAM and SEST telescopes (F. Combes, private communication). Also shown in Table 1 are the line intensities relative to the SSB continuum level. While it is possible that the relative contributions of the two images to the total continuum may change with time, so causing the observed fractional absorption of the continuum to vary, this apparently is not a particularly significant factor in this experiment, since the fractional absorption of the CO () is the same within the error bars for the two epochs. Thus it seems reasonable to combine the results, at least in the case of limited signal to noise ratio, as presented here. The final column of Table 1 shows the combined absorption fraction.
For B 0218+357, we measured a continuum flux density of 0.18 Jy at 330 GHz in 1995 September and 0.21 Jy at 261 GHz in 1996 October. Table 2 presents the B 0218+357 flux measurements and line intensities in the same format as Table 1.
3.2 Absorption lines toward PKS 1830211
Figure 1 shows the combined single-sideband (SSB) spectra of the two sessions normalized to the observed continuum level for each session, for CO(), CO(), and Ci. Only the CO() absorption line was detected. The absorption reaches the same depth as the HCN and HCO+ lines detected by Wiklind and Combes ([1996]), about 40% of the SSB continuum level. Following Wiklind and Combes’ ([1996]) interpretation of their HCN and HCO+ observations, we conclude that only part of the QSO continuum emission is being absorbed, and that the CO () line is, in fact, optically thick. This is confirmed by BIMA measurements of Frye et al. ([1997]) who show that only one of the lensed QSO images has a line of sight that passes through the absorber. Therefore, the CO() absorption is also probably saturated and has a similar covering factor to the HCN and HCO+ absorptions. The line appears at VLSR = 15 km s-1, hence Vhel = 3 km s-1, in agreement with the redshift given by Wiklind and Combes ([1996]). The linewidth is 18 km s-1, somewhat smaller than the linewidth of 30 km s-1 given for the most saturated HCO+ line. The difference in linewidth between CO and HCO+ is likely to be due to differences in line opacities since the CO() line is not detected at a similar sensitivity. We conclude from our data that the opacity of the CO() line is larger than 3 in order to get a saturated absorption, while the opacity of the CO() line is smaller than 1 at the 1 level.
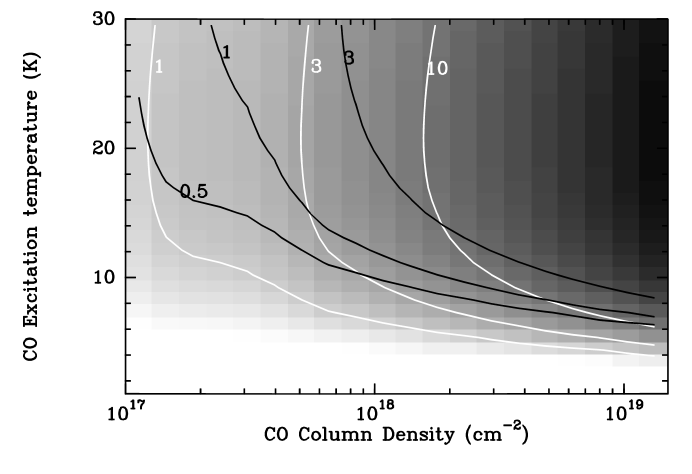

The detection of CO() absorption with a moderately large opacity combined with the non-detection of the CO() line puts constraints on the CO excitation temperature. We show in Figure 2 a comparison of the opacities of the () and () lines for a range of excitation temperatures and column densities. These calculations have been done assuming LTE. The excitation temperature of the gas must be smaller than 15 K. Assuming Tex = 8 K, the upper limit for the excitation temperature of HCO+, we obtain the following range for the CO column density : with a most likely value of 2 cm-2.
With a 12CO abundance relative to H2 of 8, as in Galactic dark clouds (Irvine, Goldsmith, & Hjalmarson [1987]), the H2 column density is 2.5 cm-2. These CO and H2 column densities are in good agreement with the estimates proposed by Wiklind and Combes ([1996]) and show that the molecular gas seen in absorption has similar molecular abundances to that of Galactic dark clouds.
We have not detected Ci absorption, with a 1 noise level of 20% of the continuum flux in 6 km s-1 channels. This means that the opacity of the Ci line must be of the order of 1 or lower. For Ci at 8 K, we get (Ci) 1018 cm-2, thus [C]/[CO] 1, which again is in accord with Galactic dark clouds for which [C]/[CO] = 0.1 - 1.0 (Keene [1995]).
3.3 The line of sight towards B 0218+357
Although an absorption feature appears at the correct velocity, we cannot report the detection of the redshifted H2O () line due to inadequate signal to noise ratio, but we did obtain a tentative detection of the 13CO() line toward B 0218+357. The spectra are shown in Figure 3. The line width of the 13CO() line is small compared to the lower lines, suggesting an opacity of the order of 1, more precisely . However, the 13CO() line is certainly saturated with an opacity larger than 5 since the C18O() line is nearly saturated (Combes & Wiklind [1995]). Using similar calculations as for PKS 1830211 and assuming a Doppler linewidth of 5 km s-1, we conclude that the excitation temperature of the 13CO gas is lower than 20 K, with a likely value in the range of K. Then, the column density lies in the range (13CO) 2.2. These data can be used to set a lower limit on the molecular gas column density. We use a 13CO abundance relative to H2 of , which lies at the upper end of the derived range for dark clouds (Irvine et al. [1987]) and get (H2) . Finally, it is well known from Galactic molecular cloud studies that the LTE approximation is usually reasonable, particularly in the case of CO molecules in dark clouds. In the case here, an LVG calculation with (13CO) = 10 and a linewidth of 5 km s-1 shows that the maximum kinetic temperature compatible with the observations is 50 K for an H2 density of 500 cm-3, decreasing to 15 K for (H2) = 104 cm-3. In Galactic dark clouds it is the high density, low kinetic temperature case which is observed (Falgarone & Phillips [1996]), essentially the LTE result.
4 Conclusion
We have made new observations on the line-of-sight towards PKS 1830211 and B 0218+357. We show that the gas is cold in both lines of sight, with Tex 15 K and 20 K respectively. We have determined the gas column density in both cases, finding for PKS 1830211 and for B 0218+357. We find the gas along the line of sight to PKS 1830211 to be chemically typical of a Galactic dark cloud.
There are various ways to enhance the quality of the description of the physical conditions and characteristics of the absorbing cloud. It should be possible, for example, to search for specific tracers of the chemistry and the elemental gas phase abundances, such as CCH, CS, SO, and DCN, because their relative abundances are expected to be sensitive to the physical conditions. Deuterated species, though difficult to observe, are particularly interesting since the efficiency of the deuterium fractionation mechanism differs considerably in the high ionization and low ionization chemical phases of dark interstellar clouds (Gerin et al. [1997]).
Work at the CSO is supported by NSF grant #AST96-15025.
References
- 1993 Carilli, C. L., Rupen, M. P., & Yanny, B. 1993, ApJ 412, L59
- 1995 Combes, F., & Wiklind, T. 1995, A&A 303, L61
- 1992 Djorgovsky, S., et al. 1992, MNRAS 257, 240
- 1996 Falgarone, E., & Phillips, T. G., ApJ 472, 191
- 1997 Frye, B., Welch, W. J., & Broadhurst, T. 1997, ApJ 478, L25
- 1997 Gerin, M., Falgarone, E., Joulain, K., Kopp, M., Le Bourlot, J., Pineau des Forêts, G., Roueff, E., & Schilke, P. 1997, A&A 318, 579
- 1987 Irvine, W. M., Goldsmith, P.F., & Hjalmarson A. 1987, Interstellar Processes
- 1995 Keene, J. 1995 in The Physics and Chemistry of Interstellar Molecular Clouds, ed. G. Winnewisser & G. C. Pelz (Berlin; New York: Springer), 186
- 1996 Menten, K., & Reid, M. J. 1996, ApJ 465, L99
- 1988 Rao, A. P., & Subrahmanyan, R. 1988, MNRAS 231, 229
- 1992 Steppe, H., et al. 1992, A&AS. 96, 441
- 1993 Steppe, H., et al. 1993, A&AS. 102, 611
- 1990 Subrahmanyan, R., Narashima, D., Rao, A. P. and Swarup, G. 1990, MNRAS 246, 263
- 1995 van Ommen, T. D., Jones, D. L., Preston, R. A., & Jauncey, D. L. 1995, ApJ 444, 561
- 1994 Wiklind, T., & Combes, F. 1994, A&A 286, L9
- 1995 Wiklind, T., & Combes, F. 1995, A&A 299, 382
- 1996 Wiklind, T., & Combes, F. 1996, Nature 379, 139