03 (11.09.1 NGC 7172 11.19.1 13.25.2)
F. Ryde
The variable X/-ray spectrum of the Seyfert 2 galaxy NGC 7172
Abstract
A broad band X-, gamma-ray spectral study of the Seyfert 2 galaxy NGC 7172 is presented. We use our ASCA observations from May 1995 and combine these with the CGRO OSSE data from March 1995. The only Seyfert 2 galaxy previously to have been modelled over such a broad spectral range is NGC 4945.
The ASCA GIS data alone, can be acceptably described by a model consisting of a power law, with a photon index , affected by absorption due to intervening neutral matter along the line of sight, with an equivalent hydrogen column density cm-2. An Fe K emission line is not required by the fits. The observed flux in the keV range is erg cm-2 s-1, which corresponds to a small increase since the Ginga measurement in October 1989. The power law found is flatter than what is expected in the unified model of Seyfert galaxies.
Combining these ASCA data with the CGRO OSSE data from March 1995, the above conclusions do not change. In this case, we also find that the most probable model for the data is an absorbed power law, but being affected by a high energy exponential cut-off. The power law is still flat with , while cm-2. The OSSE data do not contradict the flat spectrum found from using the ASCA data alone, which could have been an artifact of the narrow spectral range covered by this single instrument.
Even though it is not possible to completely reject an alternative explanation to the observed flat spectrum in terms of a transmission or a reflection model, the spectral index of the underlying power law of NGC 7172 appears actually to have varied from to since the Ginga observations in 1989. The e-folding energy is relatively well constrained and lies at keV, using the CGRO OSSE viewing period with the highest quality data. We note, however, that the CGRO OSSE spectral shape appears to be variable on a time scale of weeks.
keywords:
Galaxies: individual: NGC 7172 – Galaxies: Seyfert – X-rays: galaxies.1 Introduction
In the unified model of Seyfert galaxies (Antonucci [1993]), the observed differences between Seyfert 1 and Seyfert 2 galaxies are explained as an orientation effect. All Seyfert galaxies are suggested to be intrinsically the same type of object, having a central, accreting, massive black hole, around which there is a luminous disk and hot gas. A molecular torus surrounds the central X-ray source, obscuring it for edge-on viewing, but not for face-on viewing within the opening angle of the torus. Seyfert galaxies viewed from an angle at which the central region is directly visible are classified as Seyfert 1, and when the central region is obscured, they are classified as Seyfert 2. The model is based on the observations of polarized broad lines in the optical spectra of several Seyfert 2 galaxies (see, e.g., Antonucci & Miller [1985]) and the presence of strong absorption in the X-ray spectra of Seyfert 2 galaxies, indicating a molecular torus (e.g., Koyama et al. [1989]).
Some Seyfert 2 galaxies have been observed to have an intrinsic spectrum which is flatter than has been observed for Seyfert 1 galaxies (Smith & Done [1996], Cappi et al. [1996]). This contradicts the unified model, which predicts the same average intrinsic photon index for Seyfert 1 and Seyfert 2 galaxies. However, observations with a single satellite are usually limited to a fairly narrow spectral range, e.g., keV for ASCA. If the radiation from the object undergoes extensive absorption, this range may be too narrow to make it possible to determine whether the intrinsic spectrum is really flat or whether it is intrinsically steep and maybe affected by a complex absorber and/or Compton reflection. By combining data from two or more satellites, one can broaden the spectral coverage and reduce these uncertainties. In this paper we conduct such an analysis on the Seyfert 2 galaxy NGC 7172. The only Seyfert 2 galaxy previously studied over a broader band using non-simultaneous ASCA/Ginga/CGRO OSSE data is NGC 4945 (Done et al. [1996]). The average, non-simultaneous Ginga/CGRO OSSE spectrum of three Seyfert 2 galaxies has also been studied (Zdziarski et al. [1995]).
An X-ray source detected by the sky surveys of ARIEL V/SSI and HEAO-1/A2, was later identified as NGC 7172, which is an edge-on, Sa(pec)111Anupama et al. ([1995]) advocate a morphological type S0-Sa for the galaxy. spiral galaxy (de Vaucouleurs et al. [1991] (RC3)). The galaxy has a strong equatorial dust lane and an equivalent neutral hydrogen column density of about atoms cm-2, determined from the Balmer decrement, as compared to the galactic column density of cm-2. NGC 7172 lies at a redshift of , corresponding to a distance of 51.8 Mpc ( km s-1 Mpc-1), in the southern compact group HCG 90 (see Sharples et al. [1984]; Anupama et al. [1995]). The X-ray spectrum was studied by EXOSAT in October 1985 (Turner & Pounds [1989]), by Ginga in October 1989 (Warwick et al. [1993]; Nandra & Pounds [1994]; Smith & Done [1996]), by ROSAT/PSPC in November 1992 (Polletta et al. [1996]), by CGRO OSSE in March 1995, and by ASCA on 13 May, 1995 (Ryde et al. [1997]) and on 17 May, 1996 (Matt et al. [1997]). Here we analyse and fit the March/May 1995 data, as well as the 1989 Ginga data. The ASCA data for NGC 7172 are extracted using XSELECT (ftools v3.6) and all the data analysis is performed with XSPEC v8.5 (Arnaud [1996]).
2 The Ginga spectrum of NGC 7172
In order to compare with earlier results, we also analyse the Ginga data, starting with a simple model spectrum, consisting of a power law, absorption due to intervening neutral matter along the line of sight, and an iron K emission line with the line energy fixed at keV and the line width at keV. In agreement with Warwick et al. ([1993]), we find a photon spectral index , and an equivalent hydrogen column density cm-2 with , for the number of degrees of freedom, d.o.f. (reduced ). The model (absorption power law) , where is the photo-electric absorption cross section, will be referred to as ‘model P’. All errors given, unless otherwise stated, are confidence intervals for one interesting parameter, i.e., . The Ginga data show a hardening of the spectrum above 10 keV, which can be interpreted as an indication of a Compton reflection component. Such a component can be expected when, for instance, the relatively cold matter in an accretion disk subtends a substantial solid angle as seen from the X- and -ray emitting corona. The amount of reflection is measured by the parameter , which is proportional to the ratio of the observed reflection spectrum and the observed underlying continuum. is normalized in such a way that for reflection by an infinite disk illuminated by an isotropic continuum source. Including a Compton reflection component in the model (XSPEC model pexrav by Magdziarz & Zdziarski [1995]) with the cosine of the inclination angle = 0.45, one finds and cm-2 with an amount of reflection, , and d.o.f. (). The model absorption (power law + reflection), will be referred to as ‘model R’. The hardening may also be explained by a transmission model, in which the absorption is approximated with a dual absorber. Here, two column densities are used, having complete coverage, and covering only a fraction, , of the source. The transmission , where the function is derived in a 1D, two-stream approximation, taking into account both photoelectric absorption and Thomson scattering, allowing the absorber to be marginally Thomson thick. Such a model can be a crude description of a non-uniform density distribution of absorbing matter. Using this ‘model T’ on the Ginga data one finds and the column densities cm-2 and cm-2 with . The fit had d.o.f. ().
The Ginga flux of NGC 7172 in the 2 - 10 keV range, erg cm-2 s-1.
3 The ASCA spectrum of NGC 7172
We observed NGC 7172 with the ASCA satellite from 23:18 UTC on the 12 May until 16:00 UTC on the 13 May 1995, with its four telescopes, which focus the X-rays onto the two CCD detectors, SIS0 and SIS1 and onto the two gas scintillation proportional counters, GIS2 and GIS3.
3.1 The GIS data
In screening the GIS data, standard, conservative criteria are applied: Minimum angle to Earth limb , angle from bright Earth (illuminated limb) , minimum cut-off rigidity GeV/c. The spatial region filter, centred around the object, is chosen to have a radius of . Background spectra are accumulated from regions of the observation itself, which are sufficiently far away to avoid contamination from the source. The final results do not differ significantly, if, instead, the background is extracted from the event files for a blank sky background provided by the ASCA Guest Observer Facility. Furthermore, they are not very sensitive to the screening criteria adopted. The extracted data are regrouped to contain a minimum of counts per channel to allow the use of the -test. The spectrum clearly shows a soft ( keV) excess above the extrapolation of the higher energy continuum found below. These channels, however, do not have many counts after the background subtraction and they are ignored in the modelling. The net exposure time for both detectors is ks.
3.1.1 GIS analysis and results
The GIS2 and GIS3 observations are presented in Table 1, where model P, i.e., a power law and a neutral absorber, has been fitted for a first comparison. The observations are in agreement with each other and we analyse the data by fitting the GIS2 and the GIS3 spectra simultaneously. We start off by studying model P, without an Fe K line. The fit is satisfactory with and an equivalent hydrogen column density, cm-2, with d.o.f. (). Even though the fit does not require the model to have any additional components, we try adding an Fe K line, described by three additional parameters, which reduces the by 5 units, d.o.f. (). By studying the confidence contour plot of the Fe line strength versus the line energy, it is obvious that the Fe line is not significantly detected and we do not add it in the following fits. The equivalent width is 60 eV with a 90 upper limit of 120 eV.
The observed energy flux in the keV range is erg cm-2 s-1, which after absorption correction becomes erg cm-2 s-1. The luminosity, with , km s-1 Mpc-1, , becomes erg s-1.
As a reflection component is suspected to exist in the Ginga data, we continue by trying model R with a free Compton reflection parameter. However, for the GIS data the form of the fitted model does not change appreciably, with the reflection parameter, , remaining close to zero and having an upper limit of 3.5. In the next step of the analysis, we try fitting model T to the data. The covering fraction cannot be constrained by the data. The GIS data do not reach sufficiently high in energy to be able to constrain the parameters for these models. We therefore adopt the simple power law model as the best fit model for the ASCA GIS data.
Figure 1 shows the ASCA GIS2 data, together with the folded, best-fit model.
| Detector | d.o.f. () | |||
|---|---|---|---|---|
| (cm-2) | ( erg cm-2 s-1) | |||
| SIS0 | 1.430.16 | 8.10.7 | 5.1 | 185 / 152 (1.21) |
| SIS1 | 1.110.16 | 7.00.8 | 5.5 | 121 / 134 (0.90) |
| GIS2 | 1.510.18 | 7.60.9 | 4.8 | 147 / 166 (0.89) |
| GIS3 | 1.630.16 | 8.50.7 | 4.7 | 167 / 191 (0.87) |


3.2 The SIS data
The SIS data are sensitive to the screening criteria and give different results depending on the criteria adopted. We therefore apply the standard conservative data filters: Minimum angle to Earth limb , angle from bright Earth (illuminated limb) , minimum cutoff rigidity GeV/c. Only the SIS events that are graded as are used and the spatial region filter, centred around the object, is chosen to have a radius of . The background is extracted from the event files for a blank sky background provided by the ASCA Guest Observer Facility (November 1994). These files contain events from 3 deep field observations, without any obvious sources and with a total exposure time of about ks. If, instead, the background is extracted from the observation itself, the results do not change more than a few per cent and the conclusions of the subsequent modelling are in principle the same. The SIS detectors operated in the 2 CCD bright mode and had a net exposure time of 26 ks. The extracted data are regrouped to contain a minimum of counts per channel to allow the use of the -test. The low energy channels up to keV are ignored.
3.2.1 SIS analysis and results
The SIS0 data, together with the folded model P fit, are shown in Fig. 2. The results of this fit and the corresponding ones for SIS1, are given in Table 1. As shown in the table, the two SIS detectors give noticeably different results. For instance, the photon indices are not consistent with each other at the confidence level used. From the SIS results themselves, one can not judge which observation is the one mainly causing the discrepancy. We continue by studying the SIS data by fitting the SIS0 and the SIS1 spectra individually.
Using model R, with a free reflection parameter, the resulting fits give a steeper photon index and a large reflection parameter, which is an indication for a hard tail; for SIS0, and , and for SIS1, and , only having an upper limit. The column densities are cm-2 and cm-2, respectively, and the fits have d.o.f. () and d.o.f. (). Here too the iron line is weak, which could pose a problem for the scenario with reflection off cold, neutral material, where one would expect a strong iron line. This supports the interpretation of the spectral hardening in terms of the transmission model.
We now apply the transmission model T. The best fit for the SIS0 detector, gives and column densities of the fully and partially covering components, cm-2 and cm-2, with a covering fraction, . The fit has d.o.f. (). The corresponding fit for the SIS1 detector gives , cm-2, cm-2, and d.o.f. (). The large uncertainty in the partial absorber is due to the fact that it is effective only for a narrow energy interval at high energies and therefore only a few data points can constrain the values. This model is of the same quality as the reflection model, and one cannot tell from the data which is the better one. A more complicated model, using a power law and a dual absorber as well as Compton reflection, does not increase the quality of the fit.
3.3 Conclusions
The SIS data can constrain models R and T better than the GIS data. However, due to the uncertainties in the reduction, where the SIS data are sensitive to the screening criteria and give different results depending on the criteria adopted, we rely more on the GIS results. The SIS0 and the SIS1 detectors also give results that differ from each other, while the GIS data are more consistent with each other and are usually less sensitive to details in the reduction. In the subsequent investigation, we therefore use only the GIS2 and the GIS3 data for the ASCA observation.
The errors in the GIS flux can be found by varying the model parameters to map out the confidence region. The errors then turn out to be of the same order as those due to counting statistics. The estimated energy flux becomes erg cm-2 s-1, which after absorption correction becomes erg cm-2 s-1 and finally the luminosity becomes erg s-1.
The fitted GIS spectrum is rather flat, , which is in the lower end of the range found in Seyfert galaxies, having a mean value of (e.g., Nandra & Pounds [1994], Nandra et al. [1997]). It has also varied since the Ginga observations in October 1989, when , and erg cm-2 s-1. The X-ray spectrum of NGC 7172 has thus become flatter between 1989 and 1995, and the keV flux level has increased somewhat. The ASCA observation of NGC 7172 from May 1996 also shows a flat spectrum, (Matt et al. [1997]).
NGC 7172 did not show any significant variability during the observations, with the variations being less than 10 of the mean count rate.
4 The CGRO OSSE spectrum of NGC 7172
NGC 7172 was observed by CGRO OSSE during viewing periods (VP) 411.5, 412.0 and 413.0 from 21 February to 21 March 1995. The data could be affected by the proximity of PKS 2155-304, as both objects had to be observed together, due to the field of view of the OSSE instrument being a few times larger than the angular separation between the two objects. During VP 411.5 and 413.0 a two-pointing strategy was adopted, where one pointing was centred on NGC 7172 and the second was pointed off source, closer to PKS 2155-304. This strategy makes it possible to study the contamination of the PKS object, by fitting for the two sources, using both viewing positions, with the analysis package IGORE (Johnson et al. [1993]). Such a study was conducted by the CGRO Science Support Center (SSC) and resulted in the conclusion that there is no evidence for emission from PKS 2155-304 in the OSSE band (Niel Johnson, 1997, private communication), so therefore we attribute all the flux observed to NGC 7172.
The OSSE data from all pointings were appropriately prepared for XSPEC and made available to us by the SSC. The results from fitting the data with a power law are shown in Table 2. Viewing periods 412.0 and 413.0 are consistent with each other, while the observations from viewing period 411.5 differs significantly, having a much flatter spectrum. This indicates that NGC 7172 is variable in the OSSE range over a time scale of a few weeks. VP 413 is the viewing period with the best signal-to-noise ratio, having the longest effective observation time. Fitting all the viewing periods together gives a photon index of and d.o.f. (). The fits should be compared to those of other Seyfert galaxies observed in the OSSE range (Johnson et al. [1994]), for which the mean index is .
| Viewing | Detector | d.o.f. () | |
|---|---|---|---|
| Period | seconds | ||
| 411.5 | 60.3 / 51 (1.18) | ||
| 412.0 | 27.3 / 44 (0.62) | ||
| 413.0 | 34.1 / 51 (0.67) | ||
| All | 142.7 / 150 (0.95) |
5 The combined X/gamma-ray spectrum of NGC 7172
We now analyse the combined spectrum using the Ginga, ASCA GIS, and CGRO OSSE data discussed above. As the spectrum of NGC 7172, observed with ASCA in 1995, is flatter than that from Ginga in 1989, it is of interest to combine the GIS data with the OSSE data to form a broader spectral range. The aim is to be able to determine the photon index unambiguously and thus prove that the slope really has changed and is not only an artifact of the narrowness of the spectral range studied. The observations were not simultaneous, but were made only two months apart.
5.1 The combined ASCA/OSSE spectrum
We start by studying the combined ASCA GIS and CGRO OSSE data. As shown above, the OSSE data alone indicated some variability during the couple of weeks it was gathered. We therefore study different combinations of the GIS and the sets of OSSE data. We use the model P, with a free e-folding energy, ; , and a single neutral absorber. We let the GIS and the OSSE data have free normalizations compared to each other. The results are presented in Table 3.
| Model | d.o.f. () | |||||||
|---|---|---|---|---|---|---|---|---|
| (keV) | (cm-2) | (cm-2) | ||||||
| 1 | Ginga P | 1.850.04 | - | 10.50.5 | - | - | - | 30.3 /23 (1.32) |
| 2 | Ginga R | 1.98 | - | 11.00.5 | - | - | 0.8 | 23.1/22 (1.05) |
| 3 | Ginga T | 2.00 | - | 10.0 | 70 | 0.32 | - | 25.6/22 (1.17) |
| 4 | ASCA P | 1.580.12 | - | 8.2 | - | - | - | 316/360 (0.88) |
| 5 | GingaOSSE P a | 1.840.04 | (780) | 10.50.4 | - | - | - | 96.6/74 (1.31) |
| 6 | GingaOSSE P b | 1.84 | (95) | 10.5 | - | - | - | 60.6/66 (0.92) |
| 7 | GingaOSSE P c | 1.82 | (120) | 10.50.5 | - | - | - | 66.1/74 (0.90) |
| 8 | GingaOSSE P d | 1.84 | (350) | 10.50.4 | - | - | - | 173.2/173 (1.00) |
| 9 | ASCAOSSE P a | 1.55 | (550) | 8.0 | - | - | - | 378.9/411 (0.92) |
| 10 | ASCAOSSE P b | 1.44 | 45 | 8.0 | - | - | - | 344.9/404 (0.85) |
| 11 | ASCAOSSE P c | 1.54 0.13 | 140 | 8.1 | - | - | - | 351.1/411 (0.85) |
| 12 | ASCAOSSE P d | 1.58 | 500 | 8.2 | - | - | - | 459.6/510 (0.90) |
| 13 | ASCAOSSE R c | 1.74 | 8.40.7 | - | - | e | 350.0/410 (0.85) | |
| 14 | ASCAOSSE T c | 1.70 | 165 | 7.5 | 75 e | 0.43 e | - | 349.7/409 (0.86) |
Using the OSSE data from viewing period 411.5, the normalizations for the GIS respectively the OSSE data differ by a factor of 2, with the GIS data being stronger and there is no evidence for a cut-off. Renormalizing the GIS data to the normalization of the OSSE data, gives a flux erg cm-2 s-1 and a subsequent fit, keeping the GIS band fixed, still does not need a cut-off. This could also have been suspected in the OSSE data themselves, which shows a flat spectrum during that viewing period. Figure 3 shows the combined GIS and OSSE data from VP 411.5, and the best-fit, unfolded model, plotted as versus . The difference in normalization is clearly seen.
The difference in the normalization between the GIS and the OSSE is also obvious, when the VP 412.0 data are used, with the GIS data being lower. The data now clearly show a sharp cut-off at keV, which already is indicated in the OSSE data alone, exhibiting a steep power law. The photon index of the total fit is also affected, as it gets somewhat flatter; . Figure 4 shows the combined GIS and OSSE data from VP 412.0, and the best-fit, unfolded model, plotted as versus .

In the case of using the VP 413.0 data, there is no difference in normalization () between the GIS and the OSSE ranges and there is also no statistically significant change of the fit, when the normalizations are locked to each other (). The data also show a sharp cut-off at keV.
The combinations of data studied above, unequivocally indicate that the e-folding energy has changed during the observation period. The photon index does not change significantly, as it probably, more or less, is determined by the ASCA data. The OSSE data does, however, have an impact on the fit.
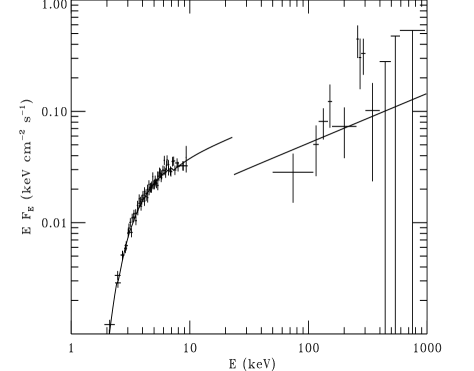
Of the data studied, we find the GIS data combined with the OSSE data from VP 413 as the most interesting combination. Firstly, the normalization are consistent with each other, secondly the VP 413 data set has the longest effective observation time, leading to the best quality of the data sets and thirdly, it can be mentioned that VP 413 is the data set that is closest to the ASCA observations. The resulting fit gives , and cm-2, with d.o.f. (). The fitted spectrum is as flat as the one obtained with the GIS data alone. Figure 5 shows the combined GIS and OSSE data from VP 413.0, and the best-fit, unfolded model, plotted as versus .

We continue studying the GIS/OSSE(VP 413) data by applying more advanced models. We begin by trying to add a Compton reflection component. By adding the reflection parameter , the of the resulting fit is reduced by only units. Furthermore, the data can not properly constrain the parameter. At a 68 confidence level lies between and 3.4, so even at this level the resulting fit is consistent with no reflection.
Continuing with model T one finds a fit with a power law, with keV and cm-2. Here too, the data have difficulty in constraining the model. At a 68 confidence level the best fit has cm-2 and . The fit is not better than the fit of model P, d.o.f. (). Neither the reflection model nor the transmission model is therefore preferred by the data over the power law model, and thus the OSSE data do not alter, or at least do not contradict, the conclusion from using the ASCA data alone, i.e., that the X-ray spectrum of NGC 7172 has become flatter between 1989 and 1995. The conclusion of the tests to prove the flatness of the spectrum found by the GIS data alone, can, however, only be tentative, due to the spectral and normalization variations in the OSSE band in the short time scales, observed.
With the available data, and bearing in mind the problems connected with non-simultaneous studies, we present the results from model P, using GIS data from the ASCA observation and the VP 413.0 data from the CGRO OSSE observation, GIS/OSSE(VP 413), as the finally most interesting ones (Fig. 5.). Figure 6 shows a contour plot of the column density versus the photon index of the power law. The contours are 90 and 68 confidence levels. The figure manifests the flatness of the spectrum. Another contour plot is shown in Fig. 7. Here the photon index is plotted against the e-folding energy. The contours are again 90 and 68 confidence levels. The figure shows that the e-folding energy is not as tightly constrained to low energies, as the single parameter interval suggests, but it is obviously bounded upwards.


The ASCA data below keV are not used in the modelling. It is, however, evident that a soft ( keV) component exists, which is often seen in Seyfert 2 galaxies (Morse et al. [1995]). In this case, the power of this soft component is about a factor of lower than the peak power of the source. The keV luminosity is found to be approximately 10 times larger than the ROSAT/PSPC measurement on 18 November 1992 of erg s-1 (Polletta et al. [1996]). It probably originates from a parsec sized region far away from the nuclear source. It may be due to scattered nuclear light or thermal bremsstrahlung.
For comparison, we also study the combined ASCA/OSSE(VP 413) spectrum using the SIS0 data instead, which is the least conspicuous of the SIS observations as compared to the GIS. The resulting fit confirms the low e-folding energy, and the flat power law .
5.2 The combined Ginga/OSSE spectrum
We now turn over to the Ginga data and combine it with the OSSE data, noting that several years separate these two observations, which demands even more caution to be taken, in interpreting the non-simultaneous fits. In the first fit, using the OSSE data from viewing period 411.5 the normalization of the OSSE data are only 10 higher than the Ginga data. There is no cut-off at high energies. The best fit has d.o.f. () with .
The next two fits include the OSSE data from viewing period 412.0 and 413.0. The photon index of the power law is dictated by the high quality Ginga data, . The free normalization shows that the Ginga data is 50 higher and 60 lower, respectively. For these two periods, the e-folding energies are low, even with the steeper spectrum given by the Ginga data. They are not constrained upwards, with 90 lower limits of 95 and 120 keV, respectively.
5.3 The combined GIS/Ginga/OSSE spectrum
Finally, we analyse all three data sets together. It is evident from an inspection of the data that there is a difference in the normalization between the 1995 ASCA and the 1989 Ginga data, and we allow the Ginga data to have variable normalization relative to the ASCA and OSSE data sets. From inspection of the residuals of the different instruments, it is clear that the high quality Ginga data that defines the fit, and leaving the ASCA data poorly fit. This supports earlier findings, that NGC 7172 had a different spectral shape and absorber in 1989 than in 1995 and we do not make any further analysis using data from all three satellites at the same time.
6 Discussion
Using the ASCA GIS observations of NGC 7172, the best fit for a power law and a single absorber (model P) gives a flat spectrum with . Adding the CGRO OSSE data, a broader band spectrum is achieved, which could constrain the spectral parameters better. The GIS/OSSE observations of NGC 7172 were, however, not simultaneous. The time interval between the observations was only two months and the source did not show any evidence of variability during the ASCA observation. Furthermore, the flux variation over the period 1985–1995 was quite modest. On the other hand, the OSSE observations showed considerable spectral variations during the month it was observed. In addition, the ASCA data from the May 1996 observation (Matt et al. [1997]) show a decrease in keV flux, down to erg cm-2 s-1. This emphasises the difficulty of combining non-simultaneous observations, which should be studied using great caution. Very few broad-band studies have been done and as they are of great physical interest, it is useful to study even non-simultaneous data sets, taking into account the uncertainties that infallibly accompanies the study.
The combined data from March and May 1995 are consistent with the spectrum of NGC 7172 being as flat as observed with the ASCA satellite alone. The OSSE data show a rather sharp cut-off at keV, and it is relatively well constrained. The fits do not improve when more complicated models are used, such as adding an Fe line, a reflection component, or using a dual absorber model.
The flat spectrum found means that the spectral index of NGC 7172 is variable, changing from in 1989 to in 1995. It still lies within the range that Seyfert 1 galaxies are observed to have. We note that some other Seyfert galaxies (see, e.g., Yaqoob [1992] and references therein), most notably NGC 4151 (Yaqoob & Warwick [1991], Zdziarski et al. [1996]), also have variable . Furthermore, both Ginga (Smith & Done [1996]) as well as ASCA (e.g. Cappi et al. [1996], Weaver et al. [1994]) observations show that some Seyfert 2 galaxies have flat spectra similar to that sometimes shown by NGC4151. In a large fraction of these sources with flat spectra, reflection is not needed in the fits, and thus the intrinsic spectrum could be flat.
Zdziarski et al. ([1996]) discussed in detail the theoretical implications of the flat intrinsic spectrum and weak reflection of NGC 4151. Similar arguments also apply to NGC 7172. A flat intrinsic spectrum implies that the X/ source is soft-photon starved. This, in turn, requires that any cold matter reprocessing the X/ radiation into soft UV-photons must subtend a small solid angle as viewed from the X/ source, and/or that the X/ source subtends a small solid angle as viewed from the cold matter. Weak reflection, furthermore, requires similarly that the cold matter subtends a small angle as viewed from the X/ source, or, if the cold matter has a disk geometry, that the disk is viewed nearly edge-on. Several geometries are consistent with these requirements, for instance, a hot inner disk and a cold outer disk (Shapiro et al. [1976]), or edge-on view of a cold disk with hot sources elevated above the disk (e.g., Svensson [1996]). The varying spectral slope can then be due to a change in geometry, such as changing the interface radius between the inner hot and the outer cold disk, or changing the elevations of the hot sources above the cold disk. As we are likely to view the central source in Seyfert 2 galaxies more or less edge-on, anisotropic spectral effects are a less likely source of spectral variability (Stern et al. [1995], Poutanen et al. [1997]).
On the other hand, a reflection model or a transmission model with a photon index, , cannot be ruled out completely. The fits are, however, not significantly better. In the case of the dual absorber, the geometry of the absorbing gas components with covering fraction over scales of cm (i.e., the scale of the central X-ray source) is not obvious.
It is of interest to compare our results with previous efforts to fit broad band spectra of Seyfert 2 galaxies. NGC 4945 (Done et al. [1996]) shows a steep intrinsic spectrum with and a very large absorber, cm-2. The e-folding energy is not well constrained at keV. Our results for NGC 7172 are more consistent with the average broad band spectrum of the three Seyfert 2 galaxies, NGC 4507, NGC 7582, and MCG-523-16 (Zdziarski et al. [1995]) which displays a flatter spectrum with and an e-folding energy at keV.
7 Conclusions
According to the ASCA observations from 1995 and 1996, the Seyfert 2 galaxy NGC 7172 exhibits a flat spectrum, , unlike the typical Seyfert 1 galaxies, thus posing a problem for the current theory of the Seyfert unification scheme, which predicts the same average intrinsic photon index for Seyfert 2 galaxies and Seyfert 1 galaxies, i.e., a mean value of . Moreover, the 1989 observation by Ginga, with its broader spectral range, showed a spectral slope, , similar to that of Seyfert 1 galaxies. By combining the ASCA and the CGRO OSSE data, both from 1995, a broad band spectral fit is possible, which better determines the effects of a possible complex absorber and of Compton reflection, which may be undetectable using the ASCA data alone. The data are, however, non-simultaneous and the final results should therefore be treated with appropriate caution.
We find that the simplest model, consisting of an absorbed power law with an exponential high energy cut-off, gives an acceptable description of the data. The fit does not change significantly as compared to the results obtained by analysing only the ASCA data. The spectral index of the power law has thus become flatter since the Ginga observations in 1989 and the change in spectral slope, , could be an intrinsic change. The value obtained for the photon index still lies at the lower end of the range observed for Seyfert 1 galaxies. The spectrum is observed to cut-off at about 150 keV, using the CGRO OSSE viewing period with the highest quality data. We also find that the CGRO OSSE spectral shape appears to vary on a time scale of weeks.
Acknowledgements.
We wish to thank Drs. Thomas Bridgman, Christine Done, Matteo Guainazzi, the referee Giorgio Matt and Niel Johnson for enlightening discussions and valuable comments. We are also indebted to the CGRO Science Support Center and the ASCA GOF at Goddard Space Flight Center for their assistance. Furthermore, we wish to thank Dr. David Smith for providing us with the Ginga data. This research was supported by the Swedish National Space Board and the Swedish Natural Science Research Council.References
- [1993] Antonucci R.R.J., 1993, ARAA 31, 473
- [1985] Antonucci R.R.J., Miller J.S., 1985, ApJ 297, 621
- [1995] Anupama G.C., Kembhavi A. K., Elvis M., Edelson R., 1995, MNRAS 276, 125
- [1996] Arnaud K.A., 1996, in ‘Astronomical Data Analysis Software and Systems V’, eds. Jacoby G. and Barnes J., ASP Conf. Series 101, 17
- [1996] Cappi M., Mihara T., Matsuoka M. et al., 1996, ApJ 456, 141
- [1996] Done C., Madejski G.M., Smith D.A., 1996, ApJL 463, L63
- [1994] Johnson W.N., Grove J.E., Kinzer R.L. et al., 1994, in ’The Second Compton Symposium’, eds. Fichtel C.E., Gehrels N., Norris J.P., AIP v.304, p.515
- [1993] Johnson W. N., Kinzer R. L., Kurfess J. D. et al. 1993, ApJS 86, 693
- [1989] Koyama K., Inoue H., Tanaka Y., 1989, PASJ 41, 731
- [1995] Magdziarz P., Zdziarski A.A., 1995, MNRAS 273, 837
- [1997] Matt G., Guainazzi M., Antonelli L.A. et al., 1997, in ‘The 2nd INTEGRAL Workshop: The Transparent Universe’, eds. Winkler C., Courvoisier T.J.-C., Durouchoux Ph., ESA SP-382, p.457
- [1995] Morse J.A., Wilson A.S., Elvis M., Weaver K.A., 1995, ApJ 439, 121.
- [1994] Nandra K., Pounds K.A., 1994, MNRAS 268, 405
- [1997] Nandra K., George, I. M., Mushotzky, R. F., Turner, T. J., Yaqoob, T., 1997, ApJ, in press
- [1996] Polletta M., Bassani L., Malaguti G., Palumbo G.G.C., Caroli E., 1996, ApJS 106, 399
- [1997] Poutanen J., Svensson R., Stern B. E., 1997, in ‘The 2nd INTEGRAL Workshop: The Transparent Universe’, eds. Winkler C., Courvoisier T.J.-C., Durouchoux Ph., ESA SP-382, p.401
- [1997] Ryde F., Larsson S., Mihara T. et al., 1997, in ‘X-ray Imaging and Spectroscopy of Cosmic Hot Plasmas’, eds. Makino F. & Mitsuda K., Universal Academy Press, Tokyo, p.299
- [1976] Shapiro S. L., Lightman A. P., Eardley D. M., 1976, ApJ 204,187
- [1984] Sharples R.M., Longmore A.J., Hawarden T.G., Carter D., 1984, MNRAS 208, 15
- [1996] Smith D.A., Done C., 1996, MNRAS 280, 355.
- [1995] Stern B. E., Poutanen J., Svensson R., Sikora M., Begelman M. C., 1995, ApJ 449, L13
- [1996] Svensson R., 1996, A&AS 120, C475
- [1989] Turner T.J., Pounds K.A., 1989, MNRAS 240, 833
- [1991] de Vaucouleurs G., de Vaucouleurs A., Corwin Jr. H.G., et al., 1991, ‘Third Reference Catalogue of Bright Galaxies’. Springer, New York, (RC3)
- [1993] Warwick R.S., Sembay S., Yaqoob T. et al., 1993, MNRAS 265, 412
- [1994] Weaver K. A., Yaqoob T., Holt S. S. et al. , 1994, ApJ 436, L27
- [1991] Yaqoob T., Warwick R.S., 1991, MNRAS 248, 773
- [1992] Yaqoob T., 1992, MNRAS 258, 198
- [1995] Zdziarski A.A., Johnson W.N., Done C., Smith D., McNaron-Brown K., 1995, ApJ 438, L63
- [1996] Zdziarski A.A., Johnson W.N., Magdziarz P., 1996, MNRAS, 283, 193