GRANAT/WATCH catalogue of cosmic gamma-ray bursts: December 1989 to September 1994††thanks: Figure2 is only available in the on-line version of the paper; Table1 is only available in electronic form at the CDS via anonymous ftp to cdsarc.u-strasbg.fr (130.79.128.5) or via http://cdsweb.u-strasbg.fr/Abstract.html
Abstract
We present the catalogue of gamma-ray bursts (GRB) observed with the WATCH all-sky monitor on board the GRANAT satellite during the period December 1989 to September 1994. The cosmic origin of 95 bursts comprising the catalogue is confirmed either by their localization with WATCH or by their detection with other GRB experiments. For each burst its time history and information on its intensity in the two energy ranges 8–20 keV and 20–60 keV are presented. Most events show hardening of the energy spectrum near the burst peak. In part of the bursts an X-ray precursor or a tail is seen at 8–20keV. We have determined the celestial positions of the sources of 47 bursts. Their localization regions (at confidence level) are equivalent in area to circles with radii ranging from 0.2 to 1.6 deg. The burst sources appear isotropically distributed on the sky on large angular scales.
Key words: astronomical data bases: miscellaneous – catalogs – gamma rays: bursts
1 Introduction
From December 1989 to September 1994 the astrophysical observatory GRANAT performed pointed observations of different celestial regions. During that period, the X-ray instrument WATCH, a part of the scientific payload of the observatory, was monitoring the whole of the sky. WATCH is uniquely capable of precisely measuring the celestial positions (the radius of the localization region is generally smaller than 1deg at the 3 confidence level) of short-lived hard X-ray sources, which include GRBs. Another feature of the instrument relevant to observations of GRBs is that its detectors are sensitive over an X-ray energy range that reaches down to keV, the domain where the properties of GRBs are known less than at higher energies.
In this paper, we present the catalogue of GRBs detected with WATCH in 1989–1994. For nearly half of the events we have been able to determine the location of the burst source on the celestial sphere. Earlier, a preliminary catalogue covering the WATCH observations carried out before October 1992 was compiled by [Castro-Tirado (1994)]. The new catalogue has been updated mainly in the two aspects: 1) the bursts detected between October 1992 and September 1994 have been added, 2) more accurate positions have been determined for many of the previously catalogued events due to the use of more precise information on the spacecraft attitude and an improved model of the instrument.
2 The WATCH experiment
Four monitors WATCH ([Lund 1986]), designed at the Danish Space Research Institute, are mounted on board the orbital observatory GRANAT. The field of view of a monitor is a circle 74∘ radius. The scintillation detector is made of alternating stripes of NaI and CsI. The full geometrical area of the detector is 47cm2. The effective area of the detector is dependent on the incident angle of the arriving photons as shown in Fig.1: at small angles it declines as a cosine, starting at ∘ more steeply, and for a source 65∘ off-axis it is one fourth of that for an on-axis source. The fields of view of the four instruments cover different quarters of the sky and partially overlap. Because at the very beginning of the experiment one of the monitors went out of order, % of the sky can be simultaneously viewed under most favourable conditions. The performance of the WATCH instrument is based on the rotation modulation collimator principle. A point source, provided it is bright enough for at least one rotation of the modulation collimator (s), can be localized with an accuracy of arcmin (at the confidence level), where is the source signal in units of 10 standard deviations ([Brandt 1994]). The detector count rate is recorded in two energy bands, the boundaries of which were reset several times during the mission and roughly correspond to 8–20keV and 20–60keV.

3 Registration of cosmic gamma-ray bursts
WATCH possesses an on-board algorithm of triggering on burst events. A burst is detected if an increase in the count rate of more than 6 standard deviations above the background level has been registered at one of 12 sampling times evenly covering on the logarithmic scale a range from 16ms to 32s. If an event is detected on a time scale shorter than 2s, its time history will be recorded with a resolution of 1s, whereas for slower bursts the standard integration time of either 7s or 14s will be used. The purpose of the ground data analysis is then to separate events of cosmic and different nature. These latter include solar flares which differ from GRBs in their generally softer spectra. It is also usually possible to establish with WATCH that their incident direction is coincident with the direction to the solar disc. In many cases burst events were generated by accelerated charged particles. The time histories of such events are different from those of GRBs. Although most non-cosmic events can be reliably identified by their characteristic features, the origin of a number of bursts remains unsettled. In this catalogue, only those events are presented that either have been localized with WATCH or are designated as cosmic in the catalogues of other GRB experiments. The significance of the detection of % of the bursts included in the catalogue was not high enough () to generate a trigger on board. These events, discovered already in the course of the ground analysis as a significant () increase in the count rate, are coincident in time with GRBs observed by other experiments, mainly by the BATSE instrument on the Compton Gamma-Ray Observatory ([Meegan et al. 1996]).
4 The catalogue
A total of 95 GRBs have been included in the catalogue. The information on these events is presented in Table1. In the first column of the table the names of the bursts are given, which were formed using a common terminology: the first letter ’W’ indicates the instrument’s name, WATCH, then follows the year, month and day of the detection of the event. The burst may have a letter (’b’ or ’c’) appended to its name, if it is the second or third burst detected in a day. The second column yields the time (UT) of the trigger. In the subsequent columns the basic characteristics of the bursts are given. As a measure of the burst duration we use the quantity which is the length of the interval during which 90% (from 5% to 95%) of the total counts from a burst was accumulated. The fluence and the peak energy flux of the bursts were calculated in the two energy bands: 8–20keV and 20–60keV (spectral shape similar to that of the Crab Nebula was assumed). When calculating these quantities we made a correction for the aspect of the burst source, which is known for the majority of the presented events from localizations with either WATCH or CGRO/BATSE ([Meegan et al. 1996]). However, for 18 bursts such information is not available, hence we accepted for them as an estimate of the detector geometrical efficiency (see Fig.1) its expectation value of 0.7. The quoted errors for the fluxes are purely statistical ones, the uncertainties due to unknown spectral shapes and source aspects have not been considered. The peak flux was calculated using the count rate data with the best time resolution available for a given event. Also, given in the table is the ratio of the fluences in the 20–60keV and 8–20keV energy bands, which characterizes the hardness of the burst spectrum. Finally, the last column of the table contains information on detections of the bursts by other experiments that were in orbit during the period examined: KONUS/GRANAT, PHEBUS/GRANAT, SIGMA/GRANAT, GINGA, BATSE/CGRO, COMPTEL/CGRO, OSSE/CGRO, DMS, Mars Observer, PVO, ULYSSES, WATCH/EURECA and YOHKOH ([Golenetskii et al. 1991]; [Terekhov et al. 1994]; [Terekhov et al. 1995]; [Sunyaev et al. 1993]; [Ogasaka et al. 1991]; [Meegan et al. 1996]; [Hanlon et al. 1994]; [Hurley et al. 1994]; [Brandt et al. 1994]).
4.1 Burst time histories
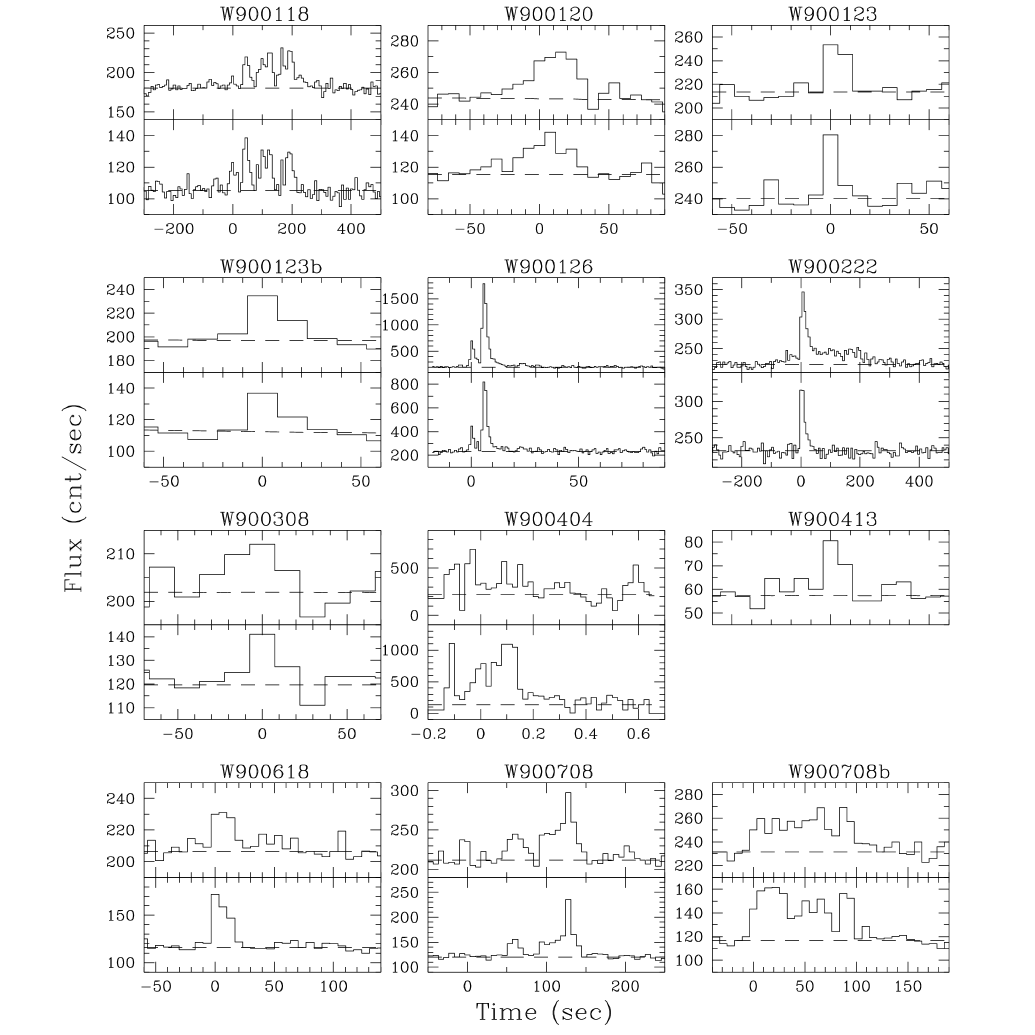
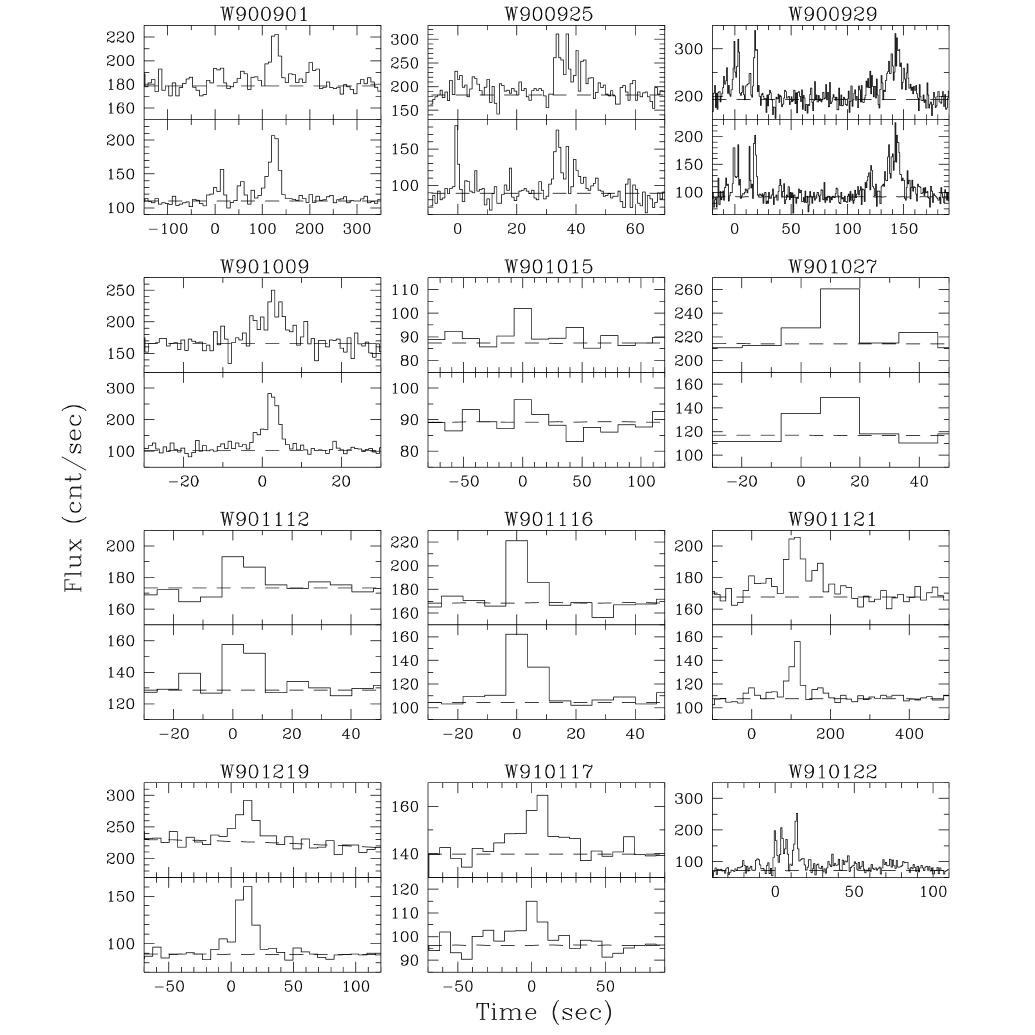
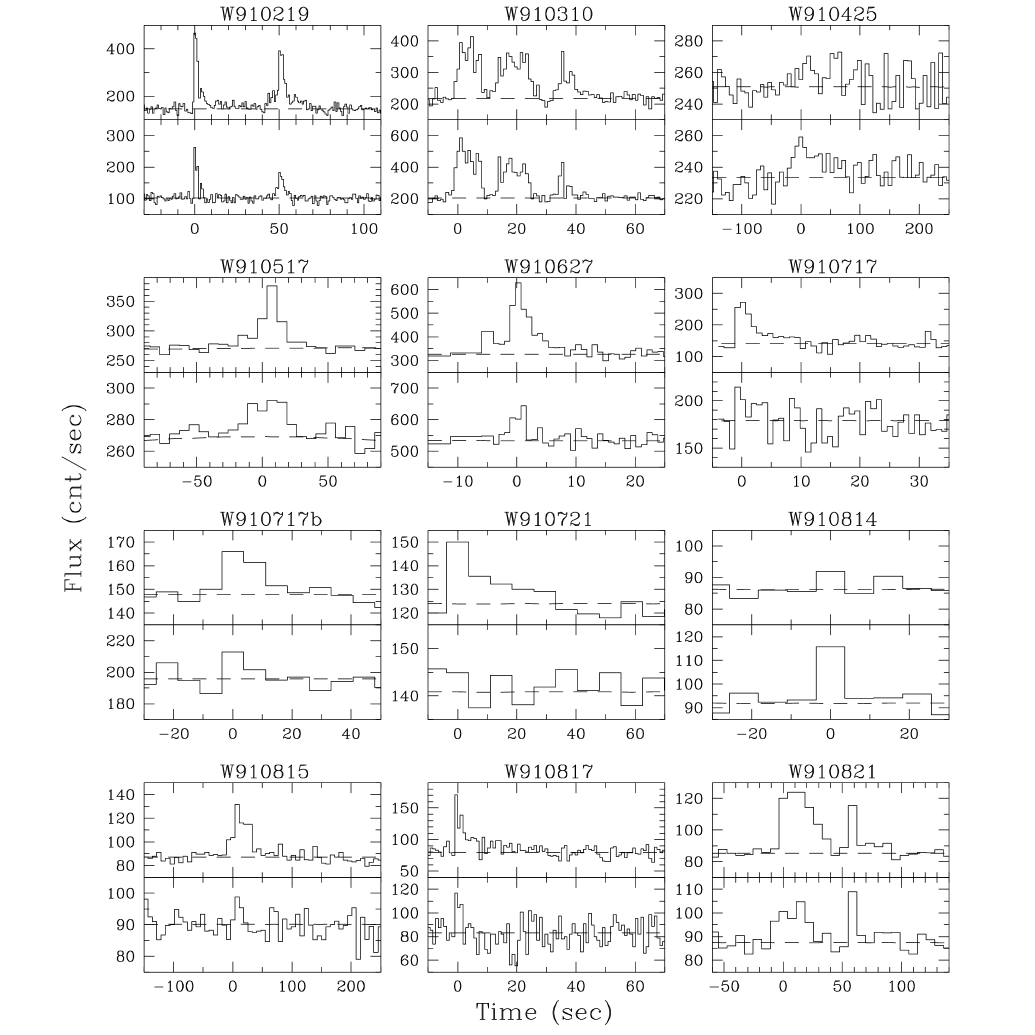
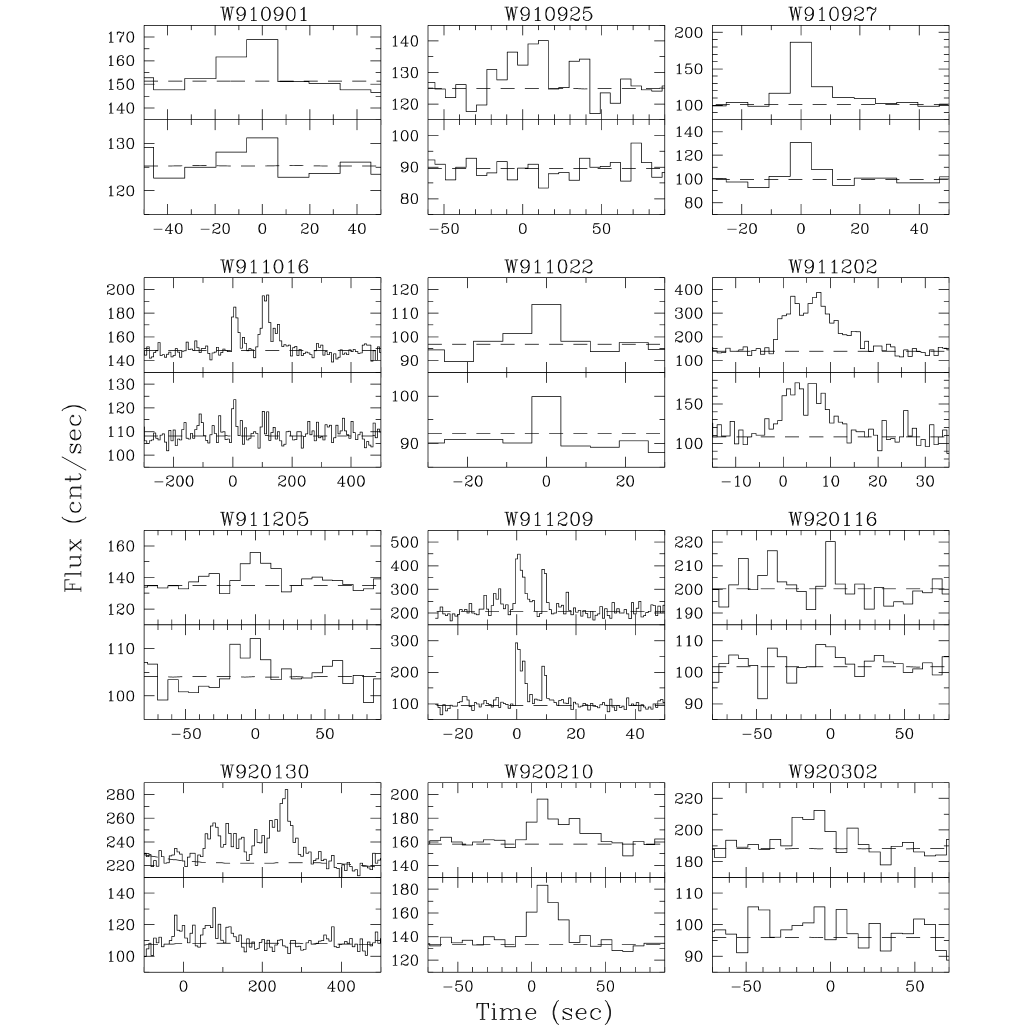
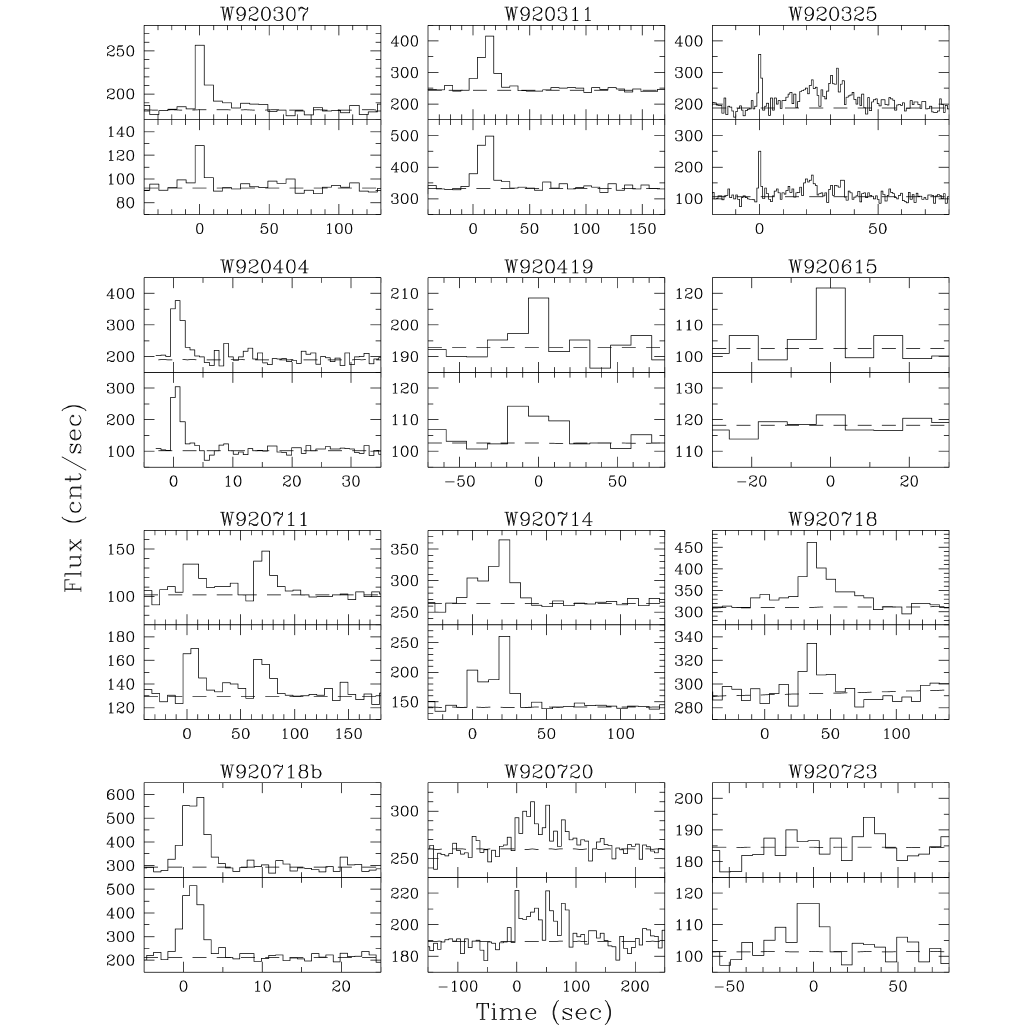
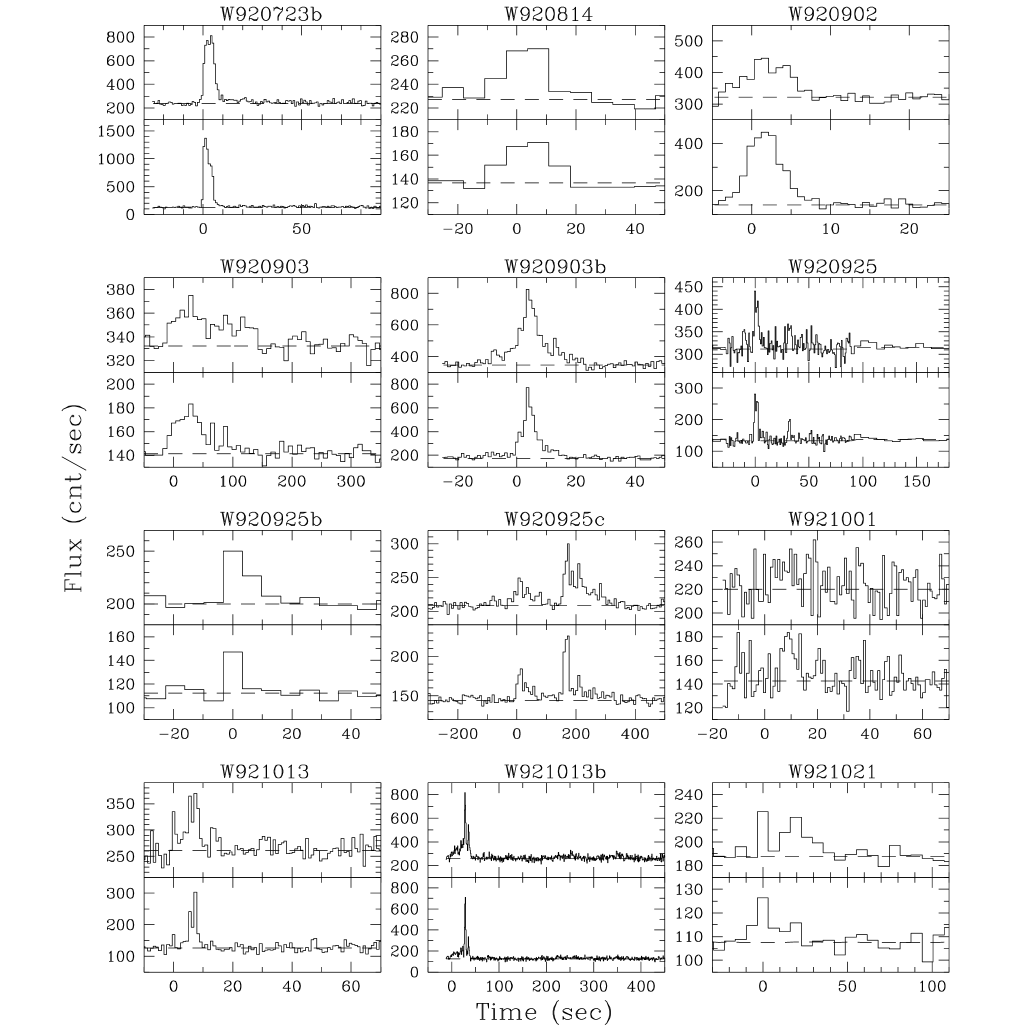
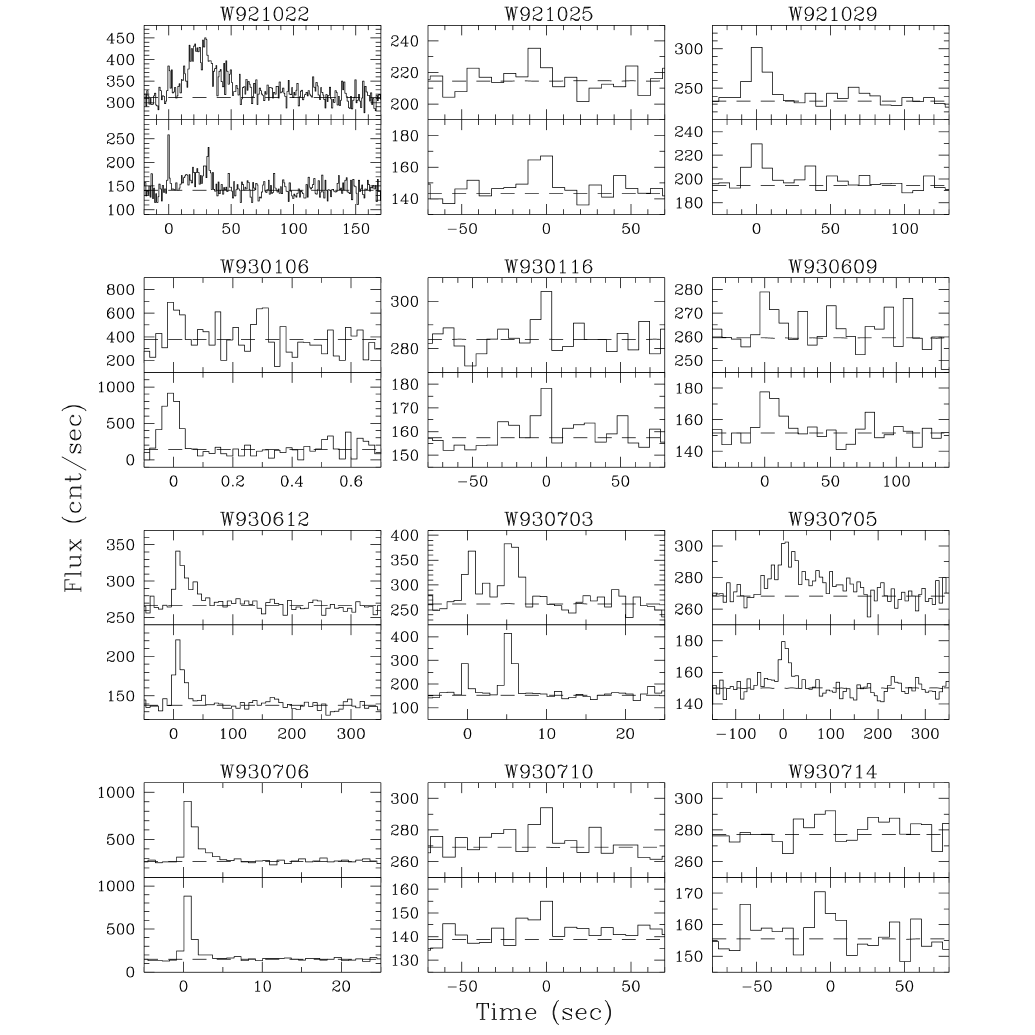
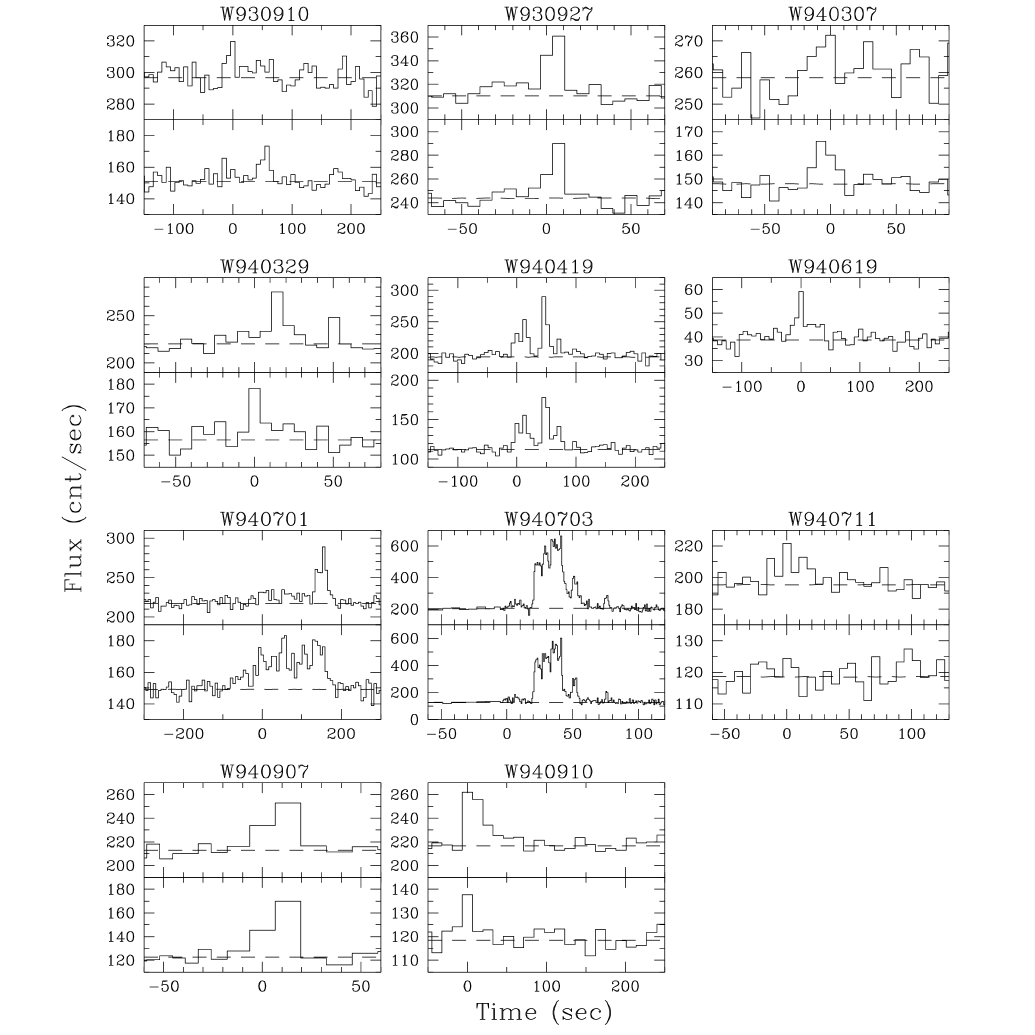
In Fig.2 the time histories of the detector count rate during the bursts in the two WATCH energy bands are shown. For the longer bursts, the best time resolution available is either 7s or 14s. For the shorter events, time histories of 1s resolution are presented. Finally, for the two shortest events W900404 and W930106, which lasted less than 1s, light curves obtained by integrating the count rate over 20ms intervals are presented. We note that these two time histories are necessarily distorted to some degree by the modulation effect caused by the rotation of the collimator. The background was in most cases estimated by averaging the count rate over time intervals immediately before and after the burst. When the background was strongly variable during the burst, we used approximation of the count rate by polynomials of first or higher orders.
4.2 Burst durations
Figure3 shows the duration () distribution for the bursts detected. It was obtained using those 89 out of 95 events whose durations could be determined reliably. At least 5 of the 6 events excluded from the analysis are apparently short (shorter than a few seconds), but they were too weak to force the on-board burst logic to trigger. Hence no count rate data with a good time resolution needed for determining their durations is available. The mean burst duration is 66s, and the maximum of the distribution lies in the interval 10 to 100s. Our sample contains 2 events shorter than 2s and 7 events longer than 200s. In other experiments, two classes of bursts were identified: of duration shorter and longer than s ([Kouveliotou et al. 1993]). It was noticed that the energy spectra of the shorter bursts of type1 were generally harder than those of the longer bursts of type2 ([Kouveliotou et al. 1993]; [Lestrade et al. 1993]). The negligibly small number of type1 events in our catalogue compared to the previous results ([Meegan et al. 1996]; [Terekhov et al. 1995]) can be accounted for by at least two selectional effects: 1) all bursts with detection significance less than included in our duration sample are longer than 7s, because this value is the time resolution of the data, 2) WATCH is sensitive to X-ray photons with energies significantly below the effective energy of the photons emitted in type1 bursts.

4.3 Burst spectral hardness and evolution
The spectral information on the emission produced during GRBs provided by WATCH is limited to the count rates in the two energy ranges 8–20keV and 20–60keV. Hence to describe the spectra of the observed bursts we calculated the ratios of the burst energy fluxes in the higher and lower bands. As follows from the cross-correlation diagram presented in Fig.4, there is no clear dependence of burst overall hardness ratio (the 20–60keV fluence divided by the 8-20keV fluence) on burst duration. This graph gives further support to the above statement that most of the bursts in the WATCH catalogue are of the same type.

The WATCH observations illustrate that the energy spectra are usually not constant but evolve throughout bursts, the typical situation being that the spectra during the burst rise and decay phases are softer than that at the peak of the event. This is demonstrated by Fig.5, where burst peak hardness ratio, i.e. the ratio of the peak energy fluxes in 20–60keV and 8–20keV (in some bursts the two flux maxima are not coincident in time), is shown as a function of burst overall hardness ratio. It can be seen that the former is larger than the latter for the majority of events, reflecting the fact that bursts generally have “sharper” profiles in the harder energy band. In 13 bursts (Table2) this spectral evolution reveals itself especially distinctly as a significant activity observed only at 8–20keV either preceding or following the hard X-ray event (see the corresponding time histories in Fig.2, for discussion on part of these events with occurences before October 1992 see also [Castro-Tirado (1994)] and Castro-Tirado et al. (1994)). Similar X-ray precursor and tail activities have been observed before in a number of bursts by a few space-flown GRB instruments sensitive to medium or soft Xrays ([Murakami et al. 1991]). In the observations carried out with the GRB detector on board the GINGA satellite, which had a low-energy cut-off at as low as 1.5keV, such X-ray-active events accounted to about one third of the total bursts detected ([Murakami et al. 1992]). The photon spectra measured with GINGA at 1 to 10keV during both the burst X-ray precursor and tail could be approximated by a black-body model with temperatures between 1 and 2keV, indicating that the emission mechanism at these burst phases may be thermal at variance with the apparently non-thermal emission during the main gamma-ray event.

| Burst name | Type of X-ray activity |
|---|---|
| W900222 | precursor and tail |
| W900708 | precursor and tail |
| W900901 | tail |
| W910817 | tail |
| W911209 | precursor |
| W920718 | precursor |
| W920723b | tail |
| W920903 | tail |
| W920903b | precursor |
| W920925 | precursor |
| W921013b | tail |
| W921022 | tail |
| W930705 | tail |
4.4 Distribution of bursters in space
For describing the distribution of GRB sources in space, the statistics ([Schmidt et al. 1988]) is widely used. In this statistics, for each burst detected according to the set criterium one calculates the quantity by the formula: , where is the minimum count rate to satisfy the burst detection criterion, and is the maximum count rate during the burst. If the bursters are homogeneously distributed in space, will be uniformly distributed in the interval (0,1), and its expectation will be 0.5.
We have carried out a test on the WATCH GRB catalogue. Calculating the values of the parameters and , in order to have a homogeneous sample, we used the count rate data with 14s integration time, for data of such resolution exist for all of the events. Of crucial importance in our case is the definition of , since the inclusion of many bursts into the catalogue was dependent on observations of the event by other experiments. We have chosen the criterion that the peak count rate must exceed the background by at least (this limit very roughly corresponds to a flux threshold of ergcm-2s for the WATCH sensitivity energy range and a typical trigger time scale of 8s), for it proves that virtually all cosmic bursts meeting it can be registered with WATCH independently, through localization. The average value of for 43 so selected events is . This implies that the burst sources are homogeneously distributed within the WATCH sampling distance. The WATCH instrument is not sensitive enough to make it possible for us to analyze the distribution of more distant bursters, a deficit of which has been observed in a number of burst experiments ([Meegan et al. 1996]; [Terekhov et al. 1995]).
4.5 Burster locations in the sky
The location of the source of a burst can be found from the WATCH data if the following three requirements are met: 1) the burst is strong enough, 2) it lasts longer than 1 rotation of the modulation collimator, and 3) the modulation pattern used for localization is not significantly distorted by the presence in the light curve of bright details on time scales shorter than the rotation period of the collimator. The presence of other bright sources in the field of view can possibly make the procedure of deriving the source position unreliable even when the above conditions are satisfied. Therefore we considered a source localized only if the same position was resulted from two statistically independent modulation patterns. These patterns may belong to different time intervals, different energy ranges, or, in rare cases, different phase intervals of the same modulation pattern. For several weak bursts an additional independent verification was obtained through comparing the positions provided by WATCH and BATSE.
We have succeeded in localizing the sources of 47 bursts (Table3). The statistical uncertainty of position determination is inversely proportional to the significance of source detection and varies between 7arcmin and 1.5deg for the localized bursts (the radius of a circle with an area equal to the area of the confidence region), the localization region being an ellipse somewhat contracted along the source off-axis angle . In preparation of this catalogue special efforts were made to decrease the influence of various systematic effects on burst localizations. Significant progress in this direction has now been achieved, in the first instance due to the use of information provided by the star tracker of the SIGMA telescope for determination of the attitude of the spacecraft at the times of bursts. Besides, on the basis of an ample archive of WATCH data on localizations of bright persistent X-ray sources, we have found more accurate values for some of the parameters relevant to the instrument, including the mounting angles defining the orientation of the WATCH detectors with respect to the SIGMA star tracker. Unfortunately, the star tracker was at times off during WATCH observations, and for 16 bursts we thus were bound to use other information resources to calculate the attitude, namely readings of the navigational instruments of the spacecraft and the knowledge of the celestial positions of bright X-ray sources that are always present in the field of view and can be localized with the WATCH detectors. This leaves an irremovable uncertainty ∘ resulted from the rapid (min period) and virtually unpredictable wobbling of the spacecraft attitude. For the 31 positions that were calculated using precise navigational information we conservatively estimate the remaining systematic error at 0.2∘. This uncertainty is mainly due to the not complete accounting for various physical phenomena in the instrument mathematical model currently used, in particular the dependence of the instrument’s positional response on the energy spectrum of the incident radiation. The cumulative localization uncertainties given in the last column of Table3 were calculated by summing (in quadrature) the statistical () and estimate systematic errors. Although we have already arrived at the state that for most of the localized burst sources it is the statistical error that mostly contributes to the location uncertainty, a cooperative effort between IKI and DSRI is now in progress to further improve the modelling of the instrument, which we expect will eventually enable further reducing of the localization regions of several stronger bursts.
When analyzing a celestial distribution of sources, it is necessary to know how long different regions of the sky have been monitored. We have compiled from the WATCH data an exposure map, which is shown in Galactic coordinates in Fig.6. Calculating this map, in cases when a sky region had been observed simultaneously by two or three WATCH detectors, the corresponding time interval was appended only once. We considered an area of the sky being in sight of the instrument if it was not more than 65∘ off axis. The maximum of the exposure map of 510days is located in the vicinity of the Galactic center (∘, ∘), and its minimum of 218days has coordinates ∘, ∘. The exposure time averages 372days over the celestial sphere, which corresponds to an all-sky monitoring efficiency of 21%.
In Fig.7, a celestial map of the positions of the burst sources in Galactic coordinates is presented. In order to check the angular distribution of the bursts for possible large-scale anisotropies, we have calculated its dipole and quadrupole moments relative to the Galactic center and the Galactic plane, respectively. Upon correction for exposure time (terms are summed with weights inversely proportional to the position exposure) the dipole moment ( is the source angular distance from the Galactic center), the quadrupole moment ( is the source galactic latitude). Therefore our observations are consistent with an isotropic distribution of the burst sources on the sky, in agreement with the corresponding BATSE result ([Meegan et al. 1996]). We carried out similar calculations for samples of bursts selected out by various attributes. We have not found any significant deviations from isotropy, in particular, the distribution of the sources of the stronger bursts is apparently isotropic. Note that the dipole and quadrupole moments calculated using the 32 events of the first WATCH catalogue of GRBs are: , , respectively ([Castro-Tirado et al. 1994]). Thus, the tendency for bursters to concentrate towards the Galactic center, evident at a significance of in the first catalogue, is not confirmed by the new data obtained since October 1992.
| Burst | (2000.0) | (2000.0) | stat. error | Total error | ||
|---|---|---|---|---|---|---|
| name | (∘) | (∘) | (∘) | (∘) | (∘) | (∘) |
| W900118 | 174.68 | -44.32 | 289.46 | 16.64 | 0.54 | 0.73 |
| W900123b | 357.19 | -38.56 | 347.89 | -72.61 | 0.60 | 0.78 |
| W900126 | 131.15 | -37.79 | 258.76 | 3.09 | 0.24 | 0.32 |
| W900222 | 336.73 | 34.83 | 92.09 | -19.25 | 0.79 | 0.81 |
| W900708 | 185.91 | 30.62 | 181.40 | 82.99 | 0.22 | 0.30 |
| W900708b | 252.79 | 16.20 | 34.92 | 33.74 | 0.43 | 0.48 |
| W900901 | 276.31 | -45.18 | 349.28 | -14.59 | 0.45 | 0.67 |
| W900925 | 133.14 | -36.72 | 258.92 | 5.00 | 0.77 | 0.80 |
| W900929 | 169.68 | -6.48 | 265.83 | 49.59 | 0.44 | 0.49 |
| W901009 | 348.61 | 30.40 | 99.28 | -27.98 | 0.51 | 0.72 |
| W901116 | 39.93 | 24.97 | 151.95 | -31.73 | 0.48 | 0.52 |
| W901121 | 30.39 | 72.40 | 128.24 | 10.26 | 0.55 | 0.59 |
| W901219 | 348.62 | -54.00 | 329.84 | -57.77 | 0.55 | 0.59 |
| W910122 | 297.48 | -71.23 | 324.06 | -30.26 | 0.66 | 0.69 |
| W910219 | 212.94 | 58.54 | 104.43 | 55.61 | 0.93 | 0.95 |
| W910310 | 184.10 | 6.38 | 279.48 | 67.64 | 0.24 | 0.55 |
| W910627 | 199.60 | -2.60 | 316.32 | 59.57 | 1.08 | 1.09 |
| W910821 | 353.08 | -72.01 | 311.26 | -43.81 | 0.38 | 0.43 |
| W910927 | 49.70 | -42.72 | 250.24 | -56.37 | 0.80 | 0.94 |
| W911016 | 297.37 | -4.71 | 35.35 | -15.05 | 0.78 | 0.92 |
| W911202 | 171.97 | -22.59 | 278.81 | 36.34 | 0.80 | 0.94 |
| W911209 | 261.92 | -44.19 | 345.18 | -5.15 | 0.60 | 0.78 |
| W920210 | 154.15 | 47.89 | 167.78 | 53.51 | 1.08 | 1.19 |
| W920311 | 132.25 | -36.39 | 258.20 | 4.65 | 0.26 | 0.33 |
| W920404 | 323.07 | 22.53 | 73.92 | -20.85 | 0.63 | 0.66 |
| W920714 | 221.43 | -30.75 | 330.15 | 26.01 | 0.48 | 0.52 |
| W920718 | 21.37 | -3.36 | 143.31 | -64.88 | 0.75 | 0.78 |
| W920718b | 296.17 | -55.95 | 341.69 | -29.51 | 0.62 | 0.65 |
| W920720 | 145.67 | -11.20 | 246.46 | 30.31 | 1.07 | 1.09 |
| W920723b | 287.08 | 27.33 | 59.26 | 8.69 | 0.19 | 0.28 |
| W920814 | 259.83 | -45.17 | 343.53 | -4.47 | 1.13 | 1.24 |
| W920902 | 279.08 | -22.81 | 10.87 | -7.04 | 0.41 | 0.46 |
| W920903 | 295.87 | 35.46 | 70.02 | 5.81 | 0.67 | 0.70 |
| W920903b | 301.54 | 22.59 | 61.53 | -5.05 | 0.22 | 0.30 |
| W920925 | 201.11 | 42.20 | 100.96 | 73.49 | 0.73 | 0.76 |
| W920925c | 330.80 | 25.48 | 81.64 | -23.60 | 0.34 | 0.39 |
| W921013 | 87.97 | 1.93 | 204.27 | -12.31 | 1.50 | 1.51 |
| W921013b | 117.71 | 33.41 | 186.99 | 26.20 | 0.25 | 0.32 |
| W921022 | 254.43 | -9.64 | 10.21 | 19.97 | 0.52 | 0.72 |
| W921029 | 35.82 | -0.42 | 166.28 | -55.37 | 1.23 | 1.25 |
| W930612 | 109.24 | -71.20 | 282.48 | -23.56 | 0.68 | 0.70 |
| W930703 | 311.06 | 8.04 | 54.10 | -20.65 | 0.59 | 0.77 |
| W930706 | 281.42 | -20.18 | 14.23 | -7.83 | 0.42 | 0.47 |
| W940419 | 358.82 | -48.19 | 326.63 | -66.27 | 1.00 | 1.02 |
| W940701 | 145.67 | -6.15 | 241.88 | 33.54 | 1.54 | 1.56 |
| W940703 | 133.20 | 28.11 | 197.08 | 37.69 | 0.12 | 0.24 |
| W940907 | 161.42 | -31.81 | 273.93 | 23.88 | 0.84 | 0.98 |


5 Summary
The WATCH GRB catalogue provides a set of 47 burster positions, 39 of which have a total (statistical plus systematic) uncertainty of less than 1deg. For 13 events error boxes with radii smaller than 30arcmin are now available. The WATCH sample thus contributes to the currently available list of moderately accurate GRB positions a number of locations comparable to that accumulated by the interplanetary satellite networks and never before obtained with any stand-alone instrument. We therefore hope that the new data presented here will be useful for burster counterpart searches in different energy ranges as well as for studying possible correlations in GRB positions.
The WATCH GRBs appear distributed both isotropically on the celestial sphere and homogeneously in space. These two results seem to be consistent with the implications from the third BATSE catalogue, as WATCH is about an order of magnitude less sensitive than the large-area detectors of BATSE, and the brighter bursts in the BATSE catalogue also show both isotropy and homogeneity ([Meegan et al. 1996]).
The light curves of most bursts observed by WATCH show hardening of the energy spectrum near the burst maxima. Several bursts demonstrate a significant 8–20keV activity in the absence of hard X-ray flux either before or after the GRB. To all appearances, these X-ray events accompanying gamma-ray bursts are higher energy manifestations of the soft X-ray precursors and tails observed at 1.5–10keV by GINGA.
-
Acknowledgements.
We thank all specialists involved in the GRANAT/WATCH experiment, in particular: the staffs of the Lavochkin Association, the Evpatoria Deep Space Control Center and the group of B.S. Novikov maintaining the instrument operations; the group of A.V. Dyachkov at IKI RAN processing telemetry data; N.G. Havenson and E.M. Churazov for their assistance in determining the spacecraft attitude. The participation of the russian co-authors in this project was supported by Russian Basic Research Foundation grant No. 95-02-05938 and INTAS grant 93-3364. SS acknowledges the hospitality of the Max-Planck-Institut für Astrophysik where the final manuscript of this paper was finished.
References
- Brandt 1994 Brandt S., 1994, Ph. D. Thesis, University of Copenhagen
- Brandt et al. 1994 Brandt S., Lund N., Castro-Tirado A.J., 1994. In: Fishman G.J., Brainerd J.J. and Hurley K.(eds.) AIP Conference Proc. 307, Gamma-Ray Bursts. AIP, New York, p. 13
- Golenetskii et al. 1991 Golenetskii S.V., Aptekar R.L., Gurian Y.A. et al., 1991, SvA 17, 195
- Castro-Tirado (1994) Castro-Tirado A.J., 1994, Ph. D. Thesis, University of Copenhagen
- Castro-Tirado et al. 1994 Castro-Tirado A.J., Brandt S., Lund N. et al., 1994. In: Fishman G.J., Brainerd J.J. and Hurley K.(eds.) AIP Conference Proc. 307, Gamma-Ray Bursts. AIP, New York, p.17
- Hanlon et al. 1994 Hanlon L.O., Bennett K., Collmar W. et al., 1994, A&A 285, 161
- Hurley et al. 1994 Hurley K., Lund N., Brandt S. et al., 1994. In: Fishman G.J., Brainerd J.J. and Hurley K.(eds.) AIP Conference Proc. 307, Gamma-Ray Bursts. AIP, New York, p. 364
- Kouveliotou et al. 1993 Kouveliotou C., Meegan C.A., Fishman G.J. et al., 1993, ApJ 413, L101
- Lestrade et al. 1993 Lestrade J.P., Dezalay J.-P., Atteia J.-L. et al., 1993, A&AS 97, 79
- Lund 1986 Lund N., 1986. In: Culhane J.L.(ed.), SPIE Proc. 597, X-ray Instruments. Int. Soc. for Optical Eng., Bellingham, Washington, p. 95
- Meegan et al. 1996 Meegan C.A., Pendleton G.N., Briggs M.S. et al., 1996, ApJS 106, 65
- Murakami et al. 1991 Murakami T., Inoue H., Nishimura J. et al., 1991, Nat 350, 592
- Murakami et al. 1992 Murakami T., Ogasaka Y., Yoshida A. and Fenimore E.E., 1992. In: Paciesas W.S., Fishman G.J. (eds.) AIP Conference Proc. 265, Gamma-ray Bursts. AIP, New York, p. 28
- Ogasaka et al. 1991 Ogasaka Y., Murakami T., Nishimura J. et al., 1991, ApJ 383, L61
- Schmidt et al. 1988 Schmidt M., Higdon J.C., Hueter G., 1988, ApJ 329, L85
- Sunyaev et al. 1993 Sunyaev R.A., Churazov E.M., Gilfanov M.R. et al., 1993, ApJ 402, 579
- Terekhov et al. 1994 Terekhov O.V., Denisenko V.V., Lobachev V.A. et al., 1994, SvA 20, 323
- Terekhov et al. 1995 Terekhov O.V., Denisenko V.V., Lobachev V.A. et al., 1995, SvA 21, 83
| Burst | Start | Fluence (10-7 erg/cm2) | Hardness | Peak flux (10-7 erg/cm2/s) | Rem | Confirma | |||||||||
| name | (UT) | (s) | 8–20 keV | 20–60 keV | ratio | 8–20 keV | 20–60 keV | ||||||||
| W900118 | 17 40 06 | 227 | 27 | 102.1 | 4.9 | 169 | 11 | 1.65 | 0.14 | 0.87 | 0.10 | 1.81 | 0.23 | ||
| W900120 | 20 37 51 | 61 | 16 | 28.3 | 4.2 | 65.3 | 9.2 | 2.31 | 0.48 | 0.67 | 0.13 | 1.91 | 0.30 | b | K |
| W900123 | 01 42 17 | 7.5 | 6.5 | 8.6 | 1.1 | 13.2 | 2.6 | 1.54 | 0.37 | 0.63 | 0.09 | 1.41 | 0.21 | b | K |
| W900123b | 18 44 31 | 15 | 10 | 25.3 | 3.5 | 40.6 | 8.1 | 1.60 | 0.39 | 1.01 | 0.10 | 2.08 | 0.26 | ||
| W900126 | 18 04 22 | 22.6 | 1.2 | 79.7 | 1.5 | 67.3 | 2.9 | 0.84 | 0.04 | 18.95 | 0.52 | 15.60 | 0.79 | G | |
| W900222 | 11 56 34 | 246 | 38 | 110.8 | 5.2 | 44 | 14 | 0.41 | 0.13 | 1.73 | 0.10 | 3.21 | 0.27 | Ph | |
| W900308 | 09 39 09 | 29 | 18 | 4.7 | 2.2 | 13.7 | 3.8 | 2.9 | 1.5 | 0.16 | 0.06 | 0.76 | 0.11 | b | KPh |
| W900404 | 17 54 35 | 0.38 | 0.04 | 1.04 | 0.20 | 6.14 | 0.56 | 5.9 | 1.2 | 7.5 | 2.9 | 34.2 | 8.2 | b | PhS |
| W900413 | 10 11 30 | 37 | 15 | – | – | – | – | – | b | Ph | |||||
| W900618 | 23 12 24 | 73 | 20 | 17.2 | 3.3 | 59.5 | 7.2 | 3.46 | 0.80 | 0.46 | 0.11 | 2.93 | 0.26 | b | Ph |
| W900708 | 11 28 10 | 181 | 27 | 108.9 | 8.1 | 279 | 17 | 2.56 | 0.25 | 2.57 | 0.20 | 9.49 | 0.48 | ||
| W900708b | 18 44 54 | 94 | 12 | 59.9 | 5.0 | 183.2 | 8.8 | 3.06 | 0.30 | 0.87 | 0.14 | 2.48 | 0.26 | ||
| W900901 | 01 33 40 | 195 | 12 | 38.9 | 4.3 | 176.9 | 8.6 | 4.54 | 0.55 | 0.74 | 0.09 | 3.99 | 0.22 | ||
| W900925 | 20 25 22 | 45.9 | 2.2 | 33.6 | 3.0 | 43.6 | 6.5 | 1.30 | 0.23 | 3.22 | 0.48 | 7.3 | 1.1 | Ph | |
| W900929 | 01 49 26 | 159.4 | 2.6 | 76.8 | 4.6 | 188 | 10 | 2.45 | 0.20 | 3.22 | 0.45 | 9.3 | 1.1 | Ph | |
| W901009 | 00 15 48 | 14.6 | 3.7 | 11.7 | 1.8 | 52.0 | 3.7 | 4.44 | 0.75 | 1.85 | 0.37 | 9.55 | 0.93 | ||
| W901015 | 08 44 46 | – | 12.8 | 2.9 | 28 | 15 | 2.1 | 1.3 | 0.67 | 0.11 | 1.80 | 0.64 | b | Ph | |
| W901027 | 04 21 01 | 13.2 | 9.3 | 17.7 | 1.8 | 47.8 | 4.3 | 2.70 | 0.37 | 1.04 | 0.10 | 2.30 | 0.24 | b | PhS |
| W901112 | 14 57 41 | 21.9 | 8.9 | 4.7 | 1.3 | 18.5 | 2.9 | 3.8 | 1.2 | 0.37 | 0.10 | 1.31 | 0.21 | b | PhU |
| W901116 | 01 42 12 | 14.5 | 8.9 | 11.3 | 1.8 | 40.8 | 3.7 | 3.59 | 0.68 | 1.21 | 0.12 | 3.22 | 0.26 | Ph | |
| W901121 | 18 07 11 | 188 | 12 | 61.5 | 3.7 | 92.8 | 7.0 | 1.51 | 0.15 | 0.65 | 0.07 | 2.00 | 0.13 | PhU | |
| W901219 | 21 52 43 | 39 | 10 | 46.1 | 5.6 | 146 | 12 | 3.17 | 0.47 | 2.30 | 0.22 | 8.00 | 0.54 | c | |
| W910117 | 00 58 13 | 51 | 12 | 18.6 | 3.4 | 102 | 24 | 5.4 | 1.6 | 0.73 | 0.14 | 4.6 | 1.0 | b | PhU |
| W910122 | 15 14 00 | 94.8 | 7.1 | – | – | – | – | – | GPPhSU | ||||||
| W910219 | 11 45 24 | 59.2 | 1.9 | 69.3 | 2.9 | 124 | 19 | 1.80 | 0.29 | 7.22 | 0.51 | 31.2 | 3.3 | PU | |
| W910310 | 13 02 03 | 37.10 | 0.80 | 77.8 | 3.1 | 301.4 | 8.3 | 3.87 | 0.19 | 4.71 | 0.50 | 22.6 | 1.4 | PU | |
| W910425 | 00 38 05 | 104 | 13 | 57 | 10 | 203 | 30 | 3.51 | 0.80 | 1.15 | 0.34 | 4.13 | 0.99 | BCPU | |
| W910517 | 05 02 38 | 37.1 | 6.4 | 59.0 | 4.3 | 193 | 34 | 3.28 | 0.64 | 3.06 | 0.20 | 5.7 | 1.5 | b,c | PPhSU |
| W910627 | 04 29 23 | 14.8 | 2.4 | 48.1 | 3.1 | 69 | 20 | 1.44 | 0.44 | 10.38 | 0.89 | 20.8 | 4.9 | BCPPhU | |
| W910717 | 04 33 06 | 9.2 | 1.1 | 27.8 | 2.5 | 22 | 11 | 0.80 | 0.41 | 7.09 | 0.94 | 8.4 | 3.6 | BGPPhU | |
| W910717b | 13 07 23 | 14.7 | 6.4 | 15.9 | 3.9 | 22 | 19 | 1.4 | 1.2 | 1.04 | 0.27 | 4.2 | 1.3 | b | U |
| W910721 | 19 30 17 | 29.4 | 9.0 | 28.4 | 4.7 | 5 | 21 | 0.18 | 0.74 | 1.76 | 0.30 | 1.1 | 1.2 | BU | |
| W910814 | 19 14 38 | – | – | – | – | – | – | d | BCGOPPhSU | ||||||
| W910815 | 12 34 25 | 36.6 | 8.9 | 74.8 | 5.4 | -3 | 22 | -0.05 | 0.30 | 2.56 | 0.24 | 2.14 | 0.93 | b | GPh |
| W910817 | 17 09 25 | 17.6 | 9.7 | 20.6 | 2.7 | -7 | 13 | -0.38 | 0.68 | 4.16 | 0.61 | 8.4 | 2.8 | b | PhU |
| W910821 | 10 33 42 | 73 | 12 | 106.9 | 7.8 | 179 | 34 | 1.68 | 0.34 | 2.53 | 0.26 | 6.1 | 1.1 | GPhS | |
| W910901 | 05 24 34 | 13 | 11 | 12.6 | 2.7 | 22 | 14 | 1.7 | 1.1 | 0.59 | 0.11 | 1.19 | 0.64 | b | Ph |
| W910925 | 03 35 10 | 45 | 10 | 17.2 | 3.6 | -18 | 17 | -1.0 | 1.0 | 0.57 | 0.18 | 0.77 | 0.85 | B | |
| W910927 | 23 27 00 | 28.7 | 6.2 | 50.6 | 3.5 | 76 | 18 | 1.51 | 0.38 | 4.19 | 0.25 | 8.4 | 1.1 | BDU | |
| W911016 | 11 01 34 | 264 | 19 | 65.9 | 5.4 | 135 | 45 | 2.06 | 0.71 | 1.07 | 0.12 | 3.46 | 0.92 | BDGPPhU | |
| W911022 | 04 14 00 | – | 8.9 | 2.7 | 3 | 14 | 0.4 | 1.6 | 0.85 | 0.19 | 2.1 | 1.0 | BU | ||
| W911202 | 20 28 51 | 16.5 | 1.1 | 69.6 | 2.1 | 152 | 13 | 2.19 | 0.21 | 6.24 | 0.52 | 14.8 | 2.9 | BDPU | |
| W911205 | 23 04 55 | 29.5 | 6.4 | 14.4 | 2.6 | 50 | 20 | 3.5 | 1.5 | 0.70 | 0.15 | 2.3 | 1.1 | B | |
| W911209 | 18 36 11 | 22.1 | 2.5 | 26.3 | 1.7 | 71.7 | 4.7 | 2.73 | 0.26 | 4.26 | 0.42 | 12.7 | 1.2 | BUY | |
| W920116 | 18 30 47 | – | 3.0 | 1.3 | 7.9 | 3.4 | 2.6 | 1.5 | 0.41 | 0.11 | 0.53 | 0.30 | BP | ||
| W920130 | 00 28 36 | 287 | 10 | 136.8 | 6.3 | 80 | 15 | 0.59 | 0.11 | 1.31 | 0.15 | 1.73 | 0.35 | c | B |
| W920210 | 09 53 52 | 36.1 | 6.2 | 25.8 | 2.6 | 89.6 | 7.3 | 3.47 | 0.45 | 1.06 | 0.14 | 4.12 | 0.41 | BPhS | |
| W920302 | 06 17 16 | 58.8 | 5.6 | 12.2 | 2.3 | 21.0 | 6.0 | 1.72 | 0.59 | 0.47 | 0.11 | 0.69 | 0.28 | B | |
| W920307 | 00 18 11 | 58.8 | 8.0 | 16.9 | 2.0 | 26.5 | 5.4 | 1.57 | 0.37 | 1.29 | 0.11 | 2.21 | 0.27 | BU | |
| W920311 | 02 20 26 | 29.0 | 6.2 | 86.7 | 4.1 | 252 | 13 | 2.91 | 0.21 | 5.05 | 0.23 | 14.48 | 0.73 | BDPPhSU | |
| W920325 | 17 17 37 | 51.7 | 3.3 | 31.3 | 1.7 | 50.5 | 4.4 | 1.61 | 0.17 | 2.46 | 0.30 | 7.56 | 0.92 | BDPPhSU | |
| W920404 | 13 11 45 | 2.5 | 1.0 | 9.19 | 0.95 | 28.1 | 2.6 | 3.06 | 0.42 | 3.67 | 0.42 | 14.3 | 1.3 | BU | |
| W920419 | 20 07 01 | 26 | 11 | 4.1 | 1.5 | 21.9 | 4.0 | 5.2 | 2.1 | 0.27 | 0.07 | 0.72 | 0.19 | BU | |
| W920615 | 14 24 58 | – | 6.7 | 1.7 | 5.9 | 9.5 | 0.8 | 1.4 | 0.79 | 0.17 | 0.76 | 0.93 | B | ||
| W920711 | 16 09 17 | 80.2 | 8.9 | 83.7 | 5.9 | 357 | 34 | 4.27 | 0.52 | 2.11 | 0.20 | 10.0 | 1.2 | b | BDPUY |
| W920714 | 13 04 33 | 28.9 | 5.1 | 30.8 | 1.7 | 81.8 | 3.2 | 2.65 | 0.18 | 1.59 | 0.11 | 4.60 | 0.24 | BPPhSU | |
Table1(continued) Burst Start Fluence (10-7 erg/cm2) Hardness Peak flux (10-7 erg/cm2/s) Rem Confirma name (UT) (s) 8–20 keV 20–60 keV ratio 8–20 keV 20–60 keV W920718 14 40 43 64.6 8.8 58.4 2.5 26 10 0.46 0.18 2.02 0.11 2.40 0.39 BU W920718b 21 32 44 4.50 0.80 12.92 0.74 29.4 1.5 2.28 0.18 3.69 0.32 9.21 0.73 BPhU W920720 05 53 20 117 20 41.9 3.2 94 10 2.25 0.29 0.72 0.10 1.69 0.30 BPU W920723 01 00 49 32.7 8.0 – – – – – d BDPhU W920723b 20 03 09 53.0 3.7 59.4 2.1 209.9 4.3 3.54 0.15 7.83 0.41 41.1 1.2 PPhSU W920814 06 10 35 21.6 6.2 10.5 1.3 19.9 2.5 1.89 0.34 0.56 0.08 1.09 0.16 BEU W920902 00 29 02 7.3 1.1 11.7 1.1 85.2 3.0 7.26 0.76 2.02 0.35 15.7 1.1 BDPhU W920903 01 35 46 131.8 6.3 42.0 3.4 107.4 7.3 2.56 0.27 0.58 0.10 1.80 0.22 PhU W920903b 23 29 01 23.8 1.9 61.5 2.4 171.3 6.0 2.78 0.15 6.99 0.45 27.7 1.3 PhU W920925 20 30 42 57.1 6.8 22.2 2.7 44.5 5.5 2.00 0.35 2.23 0.38 8.13 0.97 PhU W920925b 21 45 20 12.9 5.6 10.8 1.3 20.2 3.8 1.87 0.42 1.00 0.12 2.65 0.36 BU W920925c 22 46 24 282.1 8.8 120.3 4.8 207 10 1.73 0.11 1.55 0.11 3.50 0.24 U W921001 04 03 54 – 4.8 1.3 13.6 2.7 2.80 0.96 0.73 0.30 1.80 0.63 B W921013 20 32 32 12.9 2.0 6.50 0.85 15.9 1.9 2.46 0.44 1.15 0.21 5.92 0.61 BU W921013b 23 00 42 344.6 3.7 114.2 4.9 209 11 1.84 0.13 8.11 0.43 26.8 1.2 PhU W921021 18 20 46 32.4 7.9 14.6 2.0 24.8 5.9 1.70 0.47 0.82 0.13 1.56 0.36 B W921022 15 21 00 95 13 57.2 2.8 49.8 5.9 0.87 0.11 1.84 0.30 4.95 0.72 BEUY W921025 13 55 40 21.6 8.8 4.3 1.9 20.3 3.8 4.7 2.2 0.36 0.10 1.04 0.21 b PhU W921029 12 38 05 80.1 8.9 18.8 2.1 27.1 5.0 1.44 0.31 0.90 0.09 1.18 0.18 BU W930106 15 37 40 0.06 0.03 – – – – – d BDPhSUY W930116 02 47 06 7.3 5.1 3.9 1.2 13.0 2.9 3.3 1.3 0.37 0.12 1.24 0.28 BU W930609 10 07 30 50 15 6.4 1.9 18.2 3.6 2.8 1.0 0.28 0.09 0.96 0.18 BU W930612 00 44 20 130 51 29.9 3.1 77.0 7.5 2.57 0.37 1.00 0.09 3.48 0.23 BCDMPhU W930703 11 26 30 7.3 1.1 13.5 1.6 37.3 3.2 2.75 0.41 3.01 0.52 16.4 1.3 W930705 12 39 18 152 29 36.1 3.8 25.3 7.4 0.70 0.22 0.45 0.08 0.99 0.16 BU W930706 05 13 31 4.50 0.80 16.71 0.81 37.8 1.6 2.26 0.15 8.48 0.42 24.8 1.0 BMPhU W930710 03 14 42 14.4 6.2 4.5 1.3 12.8 3.0 2.8 1.0 0.42 0.11 0.87 0.24 BU W930714 16 13 04 14.4 8.8 – – – – – d BPhU W930910 12 12 30 79.8 6.2 27.8 6.5 78 14 2.82 0.85 0.88 0.26 2.74 0.59 BU W930927 04 18 15 50 11 11.4 1.6 25.4 4.7 2.21 0.52 0.59 0.08 1.70 0.23 BU W940307 07 56 29 14.3 8.7 2.9 1.4 8.5 2.6 2.8 1.6 0.18 0.08 0.59 0.16 B W940329 18 15 44 72 11 – – – – — d BU W940419 19 11 07 84 10 59.5 3.5 213 12 3.59 0.30 2.02 0.14 6.21 0.49 BPhU W940619 21 32 32 72 11 – – – – – BCPhU W940701 21 44 29 201 23 54.9 4.2 307 16 5.61 0.53 1.18 0.11 2.51 0.39 c BU W940703 04 40 55 45.6 7.9 239.2 4.6 1010 17 4.22 0.11 9.36 0.22 40.46 0.93 BPhSUY W940711 18 14 10 32.4 5.6 11.1 1.9 0.2 6.6 0.03 0.60 0.53 0.11 0.53 0.40 B W940907 20 36 20 26 11 20.9 2.6 115 10 5.50 0.85 0.95 0.10 5.62 0.43 W940910 23 57 56 51 15 38.1 3.8 51 13 1.36 0.37 1.09 0.11 2.30 0.40 Ph
Notes:
a Bursts were also observed by other instruments: B-BATSE/CGRO,
C-COMPTEL/CGRO, D-DMS, E-WATCH/EURECA, G-GINGA, K-KONUS/GRANAT, M-Mars
Observer, O-OSSE/CGRO, P-PVO, Ph-PHEBUS/GRANAT, S-SIGMA/GRANAT, U-ULYSSES,
Y-YOHKOH.
b Direction of burst arrival unknown.
c Burst superimposed on variable background. Values given for the parameters possibly in error.
d Burst source was either outside or at the border of the WATCH field of view according to the BATSE localization (Meegan et al., 1996).