The Cluster of Galaxies Surrounding Cygnus A
Abstract
We report optical imaging and spectroscopy of 41 galaxies in a 22 arcmin square region surrounding Cygnus A. The results show that there is an extensive rich cluster associated with Cygnus A of Abell richness at least 1 and possibly as high as 4. The velocity histogram has two peaks, one centered on Cygnus A, and a more significant peak redshifted by about 2060 km s-1 from the velocity of Cygnus A. The dynamical centroid of the spatial distribution is also shifted somewhat to the NW. However, statistical tests show only weak evidence that there are two distinct clusters. The entire system has a velocity dispersion of 1581 km s-1 which is slightly larger than other, well studied, examples of rich clusters.
and
1Visiting Astronomer, Kitt Peak National Observatory, National Optical Astronomy Observatories, operated by the Association of Universities for Research in Astronomy, Inc., under contract with the National Science Foundation.
2The National Radio Astronomy Observatory is operated by Associated Universities, Inc., under a cooperative agreement with the National Science Foundation.
3 Also University of New Mexico, Dept. of Physics & Astronomy, Albuquerque, NM 87131
1 Introduction
The well-known, radio luminous, prototypical FR II radio galaxy, Cygnus A has been known for some time to be embedded in an extensive, cluster-like cloud of hot gas. The gas distribution was first imaged well by the Einstein x-ray satellite (Arnaud et al. 1984). The best high resolution (ROSAT HRI) image was made by Carilli, Perley, & Harris 1994, which shows a complex interaction between the radio jets and lobes of Cygnus A and the x-ray emitting gas in the region immediately surrounding the galaxy. The overall x-ray structure has been interpreted as a cluster-scale cooling-flow, as is usually found in very rich clusters of galaxies. However, only four other galaxies in this region have published redshifts close to that of Cygnus A (Spinrad & Stauffer 1982) and thus it has appeared that Cygnus A does not lie in a rich cluster. However, the low galactic latitude (5∘) of Cygnus A certainly hampers the detection of a cluster because of the dense, confusing galactic star field and the relatively high galactic extinction in this region.
Given the apparent anomaly of a cooling flow in a poor group surrounding the most luminous radio galaxy known with a redshift less than 0.1, we thought this problem was worth another look. Below we report the detection of an extensive cluster of optical galaxies surrounding Cygnus A and briefly discuss its properties as currently known.
2 Observations and Results
A Cousins R-band image of a 22 arcmin field surrounding Cygnus A was obtained with the KPNO 0.9m telescope. The standard CCD camera on the 0.9m telescope was used with the 2048X2048 TK2A CCD. The final image was constructed from three 5 minute exposures. Seeing was 2.2 arcsec for the final image. The magnitudes were calibrated using about 20 Landolt standards (Landolt 1992). Candidate galaxies on the flattened frame were identified by eye down to a constant peak surface brightness of 21 mag arcsec-2. Very likely this selection process was incomplete.
104 of the candidates were then observed using the MX multifiber spectrograph on the Steward Observatory 2.3-m telescope (Hill & Lesser 1986) between 12Oct96 and 16Oct96. We used a 400 line mm-1 grating covering 3700 to 6950 Å at 8 Å resolution with a UV-flooded Loral 1200800 pixel CCD as the detector.
41 velocities were measured with this system in the velocity range near the recessional velocity of Cygnus A. With our selection criteria no redshifts outside this range were found. We used the IRAF cross correlation task, FXCOR, to derive the velocities, except for Cygnus A itself for which we used the emission lines. Velocity errors were calculated from the cross-correlation strength, parameterized by the Tonry & Davis (1979) R-value. We used the relationship km sec-1, derived from redundant MX observations of cluster galaxies (Hill & Oegerle 1993). We have rejected objects with as unreliable.
In table 1, we list the right-ascension and declination (J2000.0), the heliocentric velocity and its error estimate, and the absolute Cousins R magnitude for each object from the CCD frame. Aperture magnitudes were measured within a Gunn-Oke aperture (Gunn & Oke 1975), with a metric diameter of 26.2 kpc (assuming km s-1 Mpc-1, ) and assuming a galactic absorption of (Spinrad & Stauffer 1982) and a K-correction of 0.08 magnitudes. The cosmology and velocity given above for the cluster imply a distance modulus of 37.15.
After the observations we reexamined the CCD frame using FOCAS to pick candidate galaxies and then reviewed all the objects from FOCAS and from our previous visual survey of the image. After rejecting many close stellar pairs found by FOCAS and some of our previous galaxy candidates which turn out to be stars, we find 138 non-stellar objects brighter than our limiting peak magnitude of which we have measured redshifts for 41. Thus we have redshifts for about 30% of these objects. Presumably, the remaining objects are a combination of cluster members, background objects and probably some stars.
3 Analysis and Discussion
In figure 1, we show the velocity histogram for the 41 galaxies in table 1. The central biweight velocity is 18,873 km s-1 and the biweight scale (dispersion) is 1581 corrected to the restframe of the cluster(see Beers et al. 1990 for a description of the biweight estimators). This is a large, but not unprecedented dispersion (Oegerle, Hill & Fitchett 1995) for a very rich cluster. Most such high-dispersion clusters are made up of two or more subclusters and figure 1 hints at a bimodal distribution.
We applied a battery of 1-D, 2-D, and 3-D statistical tests (see Pinkney et al. 1996) in order to determine the form and amount of both velocity and spatial substructure. 6/8 of the kurtosis tests performed returned a significant statistic ( probability), while none of the tests sensitive to skewness were significant. Thus the velocity distribution in figure 1 has a heavier tail than expected for a Gaussian distribution. This 1-D substructure is a result of the secondary peak at the velocity of Cygnus A.
In figure 2, we show a velocity-coded diagram indicating the spatial location of the member galaxies. Certainly there appears to be no simple segregation of velocities. The Dressler-Shectman test [DS] (Dressler & Shectman 1988) gives a cumulative delta of only 45.5, significantly different from a random distribution of galaxy velocities and positions at the 82% level (no evidence for a spatially segregated subcluster). The DS test, however, is insensitive to substructure if the cores of the two subclusters are too close together in angular or redshift space as could be the case here.
Of the three 3-d statistical tests we applied to the sample, only the -test (West & Bothun 1990) returned a significant result (at the 98% level). This test is a measure of how much the centroid of the galaxy distribution shifts due to correlations between the local kinematics (of the nearest neighbors) and the projected galaxy distribution. This test is also insensitive to a merger with a small projection angle. We suspect that the significant result arises from the grouping of lower-velocity galaxies to the NW of the centroid in figure 2, which would have a small local velocity dispersion and large offset from the dynamical centroid. Note that this galaxy grouping does not include Cygnus A itself.
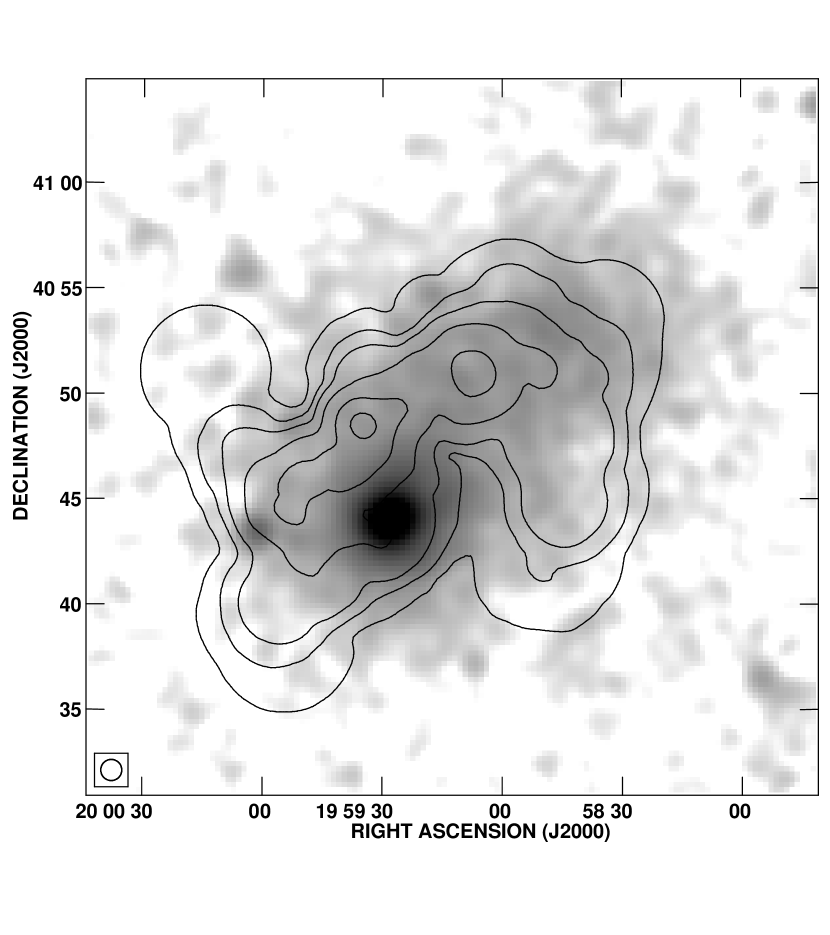
In figure 3, we show the adaptively smoothed distribution of galaxies from table 1 overlayed on the ROSAT PSPC image of the Cygnus cluster. One can see that the galaxy distribution follows the diffuse x-rays fairly well. However, the bright clump containing Cygnus A lies offset from both the x-rays and the galaxies. The velocity of Cygnus A (16811 km s-1 is offset by 2039 km s-1 from the cluster peak (figure 1). Thus there appears to be a very rich cluster in the direction of Cygnus A but the radio galaxy does not appear to be at its center.
Using a Schechter function with , and a King law with kpc (to estimate the number of galaxies missed due to the field of view of the CCD), we can set a lower limit to the Abell richness class of 1. If we are incomplete by about a factor of two for cluster members as we suspect, the cluster would be richness class 3. If all 138 objects we have found still without redshifts were cluster members the richness could be as high as 4 but this seems unlikely since some objects are likely to be foreground or background galaxies and, based on past experience, some are probably stars.
Such a rich cluster in the vicinity of Cygnus A both in celestial and velocity space seems unlikely to occur by chance. Other such examples of high velocity dispersion clusters have been explained as cluster-cluster mergers in progress. The dense core of hot gas surrounding Cygnus A, often called a “cooling flow”, is typical of the cores of relaxed, very rich clusters. The offset position of Cygnus A suggests that the dense core may be a remnant of a rich cluster which is taking part in a merger with another system. Alternatively, Cygnus A could be the dominant galaxy in a poor cluster merging with a richer system. Such a merger or collision, if it is taking part supersonically, could compress and heat the gas in the surviving core. This would in turn enhance and confine the radio emitting plasma and could be partly responsible for the very high radio luminosity of Cygnus A. Such a process might also be capable of stimulating the AGN itself.
Further measured velocities are necessary for the region around Cygnus A to clarify whether this system is actually a cluster-cluster merger in progress and if so what sort of a merger scenario is consistent with the system. Many fainter galaxies, for which we have not been able to measure redshifts, lie in the vicinity of the radio galaxy. Also we have only probed about about 700 kpc from the center of Cygnus A in projection. Thus many more cluster members are likely to lie outside our search radius.
4 Conclusions
The Cygnus A radio galaxy lies within a rich, possibly very rich, high velocity dispersion cluster. It appears to be offset from the cluster center both in physical space and in velocity. The existence of a very powerful radio galaxy/AGN in a dense, hot gaseous core is at least very interesting and could well be a key to the origin of such systems.
We thank Bill Oegerle for comments on the text. M.J.L. acknowledges partial support from NSF Grant AST-9317596.
References
- (1)
- (2) Arnaud, K. A., Fabian, A. C., Eales, S. A., Jones, C., & Forman, W. 1984, MNRAS, 211, 981
- (3)
- (4) Beers, T.C., Flynn, K., & Gebhardt, K. 1990, AJ, 100, 32
- (5)
- (6) Carilli, C. L., Perley, R. A. & Harris, D. E. 1994, MNRAS, 270, 173
- (7)
- (8) Dressler, A. & Shectman, S.A. 1988, AJ, 95, 985
- (9)
- (10) Gunn, J. E. & Oke, J. B. 1975, ApJ, 195, 225
- (11)
- (12) Hill, J. M. & Lesser, M. P. 1986, SPIE Vol. 627, Proceedings of SPIE Conference on Instrumentation in Astronomy VI (SPIE, Bellingham) p.303
- (13)
- (14) Hill, J. M. & Oegerle, W. R. 1993, AJ, 106, 831
- (15)
- (16) Gunn, J. E. & Oke, J. B. 1975, ApJ, 195, 225
- (17)
- (18) Landolt, A. U. 1992, AJ, 104, 340
- (19)
- (20) Oegerle, W. R., Hill, J. M., & Fitchett, M. J. 1995, AJ, 110, 32
- (21)
- (22) Pinkney, J., Roettiger, K., Burns, J.O., & Bird, C.M. 1996, ApJS, 104, 1
- (23)
- (24) Spinrad, H. & Stauffer, J. R. 1982, MNRAS, 200, 153
- (25)
- (26) Tonry, J. & Davis, M. 1979, AJ, 84, 1511
- (27)
- (28) West, M.J. & Bothun, G.D. 1990, ApJ, 350, 36
- (29)
| RA | DEC | |||||||
|---|---|---|---|---|---|---|---|---|
| 19:58:33.1 | 40:42:47 | 18161 | 57 | -20.6 | ||||
| 19:58:33.7 | 40:52:20 | 19295 | 41 | -21.2 | ||||
| 19:58:40.3 | 40:50:01 | 15966 | 55 | -21.2 | ||||
| 19:58:41.1 | 40:54:44 | 19359 | 61 | -21.0 | ||||
| 19:58:42.8 | 40:45:28 | 17095 | 49 | -21.2 | ||||
| 19:58:45.5 | 40:45:38 | 19031 | 48 | -22.7 | ||||
| 19:58:45.8 | 40:48:51 | 19924 | 40 | -21.5 | ||||
| 19:58:48.1 | 40:36:55 | 18599 | 57 | -20.4 | ||||
| 19:58:56.8 | 40:48:51 | 16119 | 44 | -21.2 | ||||
| 19:58:59.2 | 40:53:19 | 17070 | 61 | -20.9 | ||||
| 19:59:01.0 | 40:51:07 | 19479 | 42 | -22.4 | ||||
| 19:59:06.3 | 40:36:20 | 20242 | 30 | -21.6 | ||||
| 19:59:06.7 | 40:44:03 | 20219 | 31 | -21.9 | ||||
| 19:59:08.1 | 40:54:13 | 16495 | 50 | -22.6 | ||||
| 19:59:11.3 | 40:51:25 | 18256 | 34 | -23.0 | ||||
| 19:59:13.4 | 40:50:05 | 19084 | 70 | -21.7 | ||||
| 19:59:14.1 | 40:48:15 | 15936 | 44 | -21.2 | ||||
| 19:59:16.3 | 40:50:07 | 15563 | 60 | -21.4 | ||||
| 19:59:26.1 | 40:44:08 | 14805 | 23 | -21.5 | ||||
| 19:59:28.3 | 40:44:02 | 16811 | 20 | -23.4 | ||||
| 19:59:32.6 | 40:49:25 | 19266 | 51 | -20.8 | ||||
| 19:59:33.8 | 40:52:17 | 19738 | 64 | -21.3 | ||||
| 19:59:33.7 | 40:47:09 | 19630 | 33 | -21.619:59:34.0 | 40:47:35 | 20071 | 38 | -21.4 |
| 19:59:35.8 | 40:50:23 | 19972 | 22 | -22.4 | ||||
| 19:59:36.4 | 40:42:06 | 18239 | 70 | -21.2 | ||||
| 19:59:37.3 | 40:36:47 | 18924 | 36 | -21.2 | ||||
| 19:59:40.3 | 40:47:15 | 21283 | 44 | -21.7 | ||||
| 19:59:41.5 | 40:42:04 | 19193 | 68 | -20.7 | ||||
| 19:59:44.2 | 40:47:01 | 17039 | 32 | -22.0 | ||||
| 19:59:49.4 | 40:44:37 | 20706 | 35 | -21.2 | ||||
| 19:59:55.0 | 40:40:56 | 19652 | 70 | -20.9 | ||||
| 19:59:55.3 | 40:45:20 | 19654 | 27 | -23.1 | ||||
| 19:59:55.6 | 40:43:56 | 20090 | 70 | -20.9 | ||||
| 19:59:56.1 | 40:38:27 | 19780 | 34 | -21.9 | ||||
| 20:00:02.1 | 40:45:58 | 18661 | 57 | -21.0 | ||||
| 20:00:03.4 | 40:40:42 | 18819 | 39 | -22.4 | ||||
| 20:00:06.0 | 40:36:36 | 18387 | 38 | -22.2 | ||||
| 20:00:07.7 | 40:46:03 | 17726 | 50 | -20.4 | ||||
| 20:00:14.7 | 40:50:13 | 19454 | 37 | -21.3 | ||||
| 20:00:17.4 | 40:51:17 | 23355 | 64 | -21.2 |