AX J1749+684: a narrow emission-line galaxy with a flat X-ray spectrum
Abstract
We report the serendipitous detection of an X-ray source, AX J1749+684 with the ASCA Gas Imaging Spectrometer. AX J1749+684 is identified with a LINER/starburst-type spiral galaxy KUG 1750+683A at a redshift . It has a hard X-ray spectrum, consistent with that of the X-ray background (XRB) in the 1-10 keV band. Despite the optical classification, the X-ray luminosity cannot be explained by starburst activity. Combined with spatial variations in the optical emission line ratios, this suggests the presence of an obscured Seyfert nucleus embedded within a starforming galaxy. Similar behaviour could explain the ambiguous properties of the faint narrow-line X-ray galaxies (NLXGs) emerging from deep X-ray surveys.
keywords:
galaxies: individual: AX J1749+684 – galaxies: active – X-rays:1 INTRODUCTION
Although the origin of much of the soft XRB below keV is now understood in terms of the integrated contribution of quasars and faint NLXGs (Boyle et al 1995; Roche et al 1995; Carballo et al 1995; Griffiths et al 1996; McHardy et al 1996; Hasinger 1997), the situation is less clear at higher energies where the bulk of the energy density occurs. A strong possibility is that the NLXGs have hard X-ray spectra similar to that of the XRB, which is well fitted by a power-law of photon index in the 1-7 keV band (Gendreau et al 1995; Chen et al 1997). The NLXGs may therefore dominate the background contribution at harder energies. In the softer 0.1–2.4 keV ROSAT band there are already indications that NLXGs show significantly harder spectra than other types of X-ray sources (Almaini et al 1996, Romero-Colmenero et al 1996). The hard spectra of NLXGs may be intrinsic to the continua of those sources, making them unlike any other well-studied objects, or it may be produced by the integrated effect of varied levels of intrinsic absorption in a more typical active galaxy population. The 2–10 keV spectra of sources detected serendipitously are therefore of great interest since they may be the brighter, and probably nearer, members of the population dominating the XRB. Studies of such objects may therefore help to reveal the true nature of this X-ray population.
So far most NLXGs have been discovered in deep ROSAT observations, where they are now thought to dominate the X-ray source population at faint fluxes below keVerg s-1cm-2. A small number of bright NLXGs have been known for many years (see e.g. Piccinotti et al 1982; Lawrence & Elvis 1982) but their relevance to the XRB is unclear. Serendipitous sources detected with ASCA provide a new way forward, since good spectra are then obtained over the whole 1-10 keV band. The discovery of possible flat X-ray spectrum from NGC 3628 (Yaqoob et al 1995) has already highlighted the possible importance of previously hidden AGN in explaining the hard XRB.
We report here on the serendipitous detection of a previously unidentified X-ray source with a flat X-ray spectrum, discovered during the ASCA observation of Mrk 507. The object is arcmin away from Mrk 507 and seen in the same Gas Imaging Spectrometer (GIS) field of view. We refer to this source as AX J1749+684. A ROSAT Position Sensitive Proportional Counter (PSPC) image of the same field greatly improved the positional uncertainty of the source and allowed us to identify it with a galaxy which has a UV excess. An optical spectrum of AX J1749+684 then allows us to obtain the redshift and deduce the nature of the activity in this galaxy. Our results show that it is a low redshift and hence one of the brightest (erg cm-2s-1) members of the NLXG population.
A value of the Hubble parameter of km s-1 Mpc-1 and a cosmological deceleration parameter of have been assumed throughout.
2 X-ray data
2.1 Observations
ASCA observed Mrk 507 (and thus AX J1749+684) on 1995 December 16 with a total exposure time of 34.8 ks with the GIS. The data reduction and analysis were performed using ftools and xspec, provided by the ASCA Guest Observer Facility at Goddard Space Flight Center. Spectral data were taken from circular regions with 5 arcmin radii, giving a G2 count rate of counts s-1. Only the GIS data are available for this source, since it was outside the SIS field of view. This object was also observed in a ROSAT PSPC pointing at Mrk 507 on 1993 August 8–10. The total exposure time for this pointing was 24.7 ks. The brightest source in this ASCA observation is Kaz 163, a Seyfert 1 galaxy at a redshift of , arcmin SW of Mrk 507. This object will be used for comparison in the spectral fitting. For the results of spectral fits, we quote 90 per cent confidence errors for one parameter of interest.
2.2 Source identification
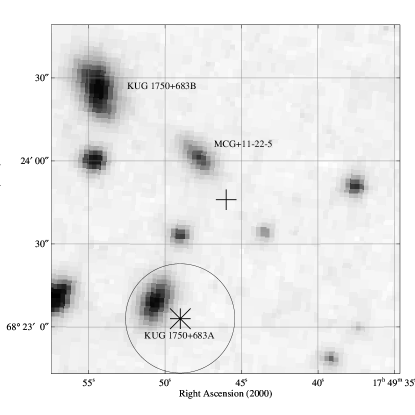
AX J1749+684 is detected serendipitously about 21 arcmin south of Mrk 507 with the GIS. The source position determined from a summed G2+G3 image is , . We estimated that the positional uncertainty is probably 1–2 arcmin (see Fig. 1; also Gotthelf 1996).
The ROSAT PSPC has much better positional accuracy than ASCA, and we have searched the PSPC field in the 0.5–2.0 keV band for a counterpart. One PSPC source within the ASCA error box has a similar X-ray spectrum and a comparable flux level. It is the brightest ROSAT source in the ASCA error circle. The position of the ROSAT source is , with an error circle radius of about 20 arcsec, and we shall refer to this source as RX J 174949+682303.
Several objects are seen around AX J1749+684 on the Palomar Optical Sky Survey (POSS-I) plate (Fig. 1). A spiral galaxy, KUG 1750+683A ( mag), which was selected by the ultraviolet excess galaxy survey with the Kiso Schmidt camera (Takase & Miyauchi-Isobe 1989), is the closest object to the ROSAT position for RX J 174949+682303 and the only one within its error circle. We regard this galaxy to be the most probable counterpart to both AX J1749+684 and RX J 174949+682303. We note that a ROSAT source is also associated with the galaxy KUG 1750+683B (see Figure 1), but with 10 times less ROSAT flux than KUG 1750+683A we do not consider this to be a likely counterpart to AX J1749+684 .
2.3 X-ray spectrum
We can use the X-ray spectrum of the nearby Seyfert 1 galaxy Kaz 163 to compare with AX J1749+684 . Further details of the ASCA spectrum of Kaz 163 are given in Iwasawa et al (1997). The object has a featureless X-ray spectrum with a spectral slope typical of Seyfert 1 galaxies (). The spectral ratio between AX J1749+684 and Kaz 163 from the GIS data shows that AX J1749+684 has a considerably harder X-ray spectrum (see Fig. 2). Results of a power-law fit to the two GIS spectra are shown in Table 1. Detection of excess absorption in the ASCA data alone is not statistically significant. The ROSAT PSPC spectrum is complicated by the presence of a detector support ring next to the image of the source. The source is very faint in the ROSAT soft-band image ( keV) however, suggesting the presence of an intrinsic absorbing column. The ASCA GIS spectrum gives cm-2 for . If we assume that the source does not vary and make a joint fit of the ROSAT and ASCA data we do obtain a statistically acceptable result (reduced ) for cm-2 and . The joint uncertainties on and are shown in Fig. 3. We note that a model dominated by X-ray reflection gives an equally good fit to the joint spectrum, but still requires a comparable level of neutral absorption. The GIS data does not place a useful constraint on the equivalent width of an iron K line, giving a 90 per cent upper limit of 1.7keV.
3 Optical data
| Object | /dof | EW(FeK) | ||||||
| cm-2 | erg cm-2 s-1 | erg s-1 | keV | |||||
| AX J1749+684 | 0.050 | 53.80/57 | 0.20 | 0.96 | 1.0 | |||
| — | 54.28/58 | |||||||
| Kaz 163 | 0.063 | 210.1/227 | 1.0 | 1.6 | 2.8 | |||


Following our X-ray detection, an optical spectrum of KUG 1750+683A (Fig. 4) was obtained by one of us (ACF) at the Isaac Newton Telescope using a slit of 1.35 arcsec width in 1.2 arcsec seeing. A 1000s exposure was obtained in 1996 December with the Intermediate Dispersion Spectrograph, using the 235mm camera and R150V grating. Major emission lines are detected with no significant broadening (FWHM km s-1), with the upper limit on the line widths arising because of the instrumental resolution. The redshift is determined to be . Using the excitation diagrams of Veilleux & Osterbrock (1987), the emission line ratios [SII]/H = 0.40, [NII]/H = 0.58 and [OIII]/H = 2.21, place this object in an intermediate region between LINERs and HII-type objects. Strong [OI], characteristic of LINERs, is not detected ([OI]/H). The integrated H flux in the slit is erg cm-2 s-1.
A large Balmer decrement, H/H, suggests relatively large reddening in the narrow emission-line region. This corresponds to a column of cm-2 if we assume case B recombination for the intrinsic line ratio and the Galactic dust-to-gas ratio (Bohlin, Savage & Drake 1978). This column density is comparable to that found from the joint ASCA/ROSAT spectral fitting (Fig. 3).
KUG 1750+683A thus appears to be a typical NLXG, distinguished only by its proximity and brightness. We note however that several of the emission lines are extended and the line ratios vary with position (Fig. 5). We have therefore extracted the important line ratios [NII]/H and [SII]/H as functions of position along the slit (Fig. 6). These ratios peak around cross-section 130, 1.8 arcsec (2.4 kpc) from the continuum peak of the galaxy, at values greater than those for the integrated spectrum. The line ratio behaviour is similar to that seen in the Seyfert 1 galaxy NGC 3227 (Delgado & Perez 1997) and is suggestive of photoionization by an active nucleus. It is therefore plausible that KUG 1750+683A is a moderately obscured AGN surrounded by an active starforming galaxy, giving intermediate line diagnostics when an integrated spectrum is considered.
We note that KUG 1750+683A is also a radio source (VLA 1749.8+6823) detected in the 1.5 GHz VLA NEP survey (Kollgaard et al. 1994) with a radio flux density 7.7 mJy. Such a radio flux could arise from either the AGN or starburst component.


4 DISCUSSION
As shown in Fig. 2, the X-ray spectrum of AX J1749+684 is unusually hard compared with typical Seyfert galaxies and quasars, and similar in shape to that of the XRB. The current ASCA data is insufficient to distinguish whether the X-ray spectrum is intrinsically flat or absorbed (see Table 1), but the lack of significant X-ray detection in the ROSAT soft band ( keV) suggests that an absorbed Seyfert-type source is a likely interpretation.
The spatial variations in the line ratios also suggest the presence of an active nucleus. Similar trends in line ratios have been noted in the starburst galaxy M82 (McCarthy et al. 1987), where the outer regions of the nebula show LINER-like behaviour (although with somewhat lower ionization than the peak in KUG 1750+683A). This was attributed to shock heating in outflowing winds. The X-ray emission from KUG 1750+683A is unlikely to be due to starburst activity however; to produce an X-ray luminosity of 1043erg s-1 would require starforming activity on an unprecedented scale. This should then lead to a massive far infra-red flux from the thermal re-radiation of dust heated by young stars. Griffiths & Padovani (1990) found a strong correlation between the X-ray and 60m luminosities in a large sample of star forming galaxies. Extrapolating this relationship to KUG 1750+683 would imply a 60m flux density of Jy. Assuming the same X-ray to infra-red ratio as M82 would require a 60m flux density of Jy for KUG 1750+683A. Both values are grossly inconsistent with the non-detection of this source by IRAS, with an upper limit of only Jy. Similar conclusions are reached when we compare with more recent ASCA observations of starburst galaxies (Kii et al. 1996). Thus the X-ray emission from AXJ1749+684 cannot be due to starburst activity.
If this is an obscured AGN, with an intrinsic photon index typical of QSOs (), then the X-ray spectrum implies an obscuring column of cm-2. Assuming standard gas-to-dust ratios, this corresponds to a visual extinction of (Bohlin, Savage & Drake 1978). In order to determine whether this could extinguish the broad line region, we use the relationship found by Ward et al. (1988) between the intensity in broad H and the 2–10 keV X-ray luminosity. This predicts an intrinsic broad H flux of erg cm-2 s-1. Once attenuated by 5 magnitudes of extinction it is clear that such a broad line component would be undetectable in the observed optical spectrum. It is worth noting that the narrow-line Balmer decrement implies , and hence only a further magnitudes of additional extinction are required to obliterate the broad-line region.
A similar hard X-ray spectrum was found in the spiral galaxy NGC3628, which also shows a starburst/LINER like optical spectrum (Yaqoob et al 1995) but with a significantly lower X-ray luminosity than AXJ1749+684. Whatever causes these hard X-ray spectra, the detection of weak X-ray sources like AX J1749+684 supports the hypothesis that the emission line galaxies emerging in deep ROSAT surveys could also provide a solution to the origin of the hard XRB. A puzzling feature of NLXGs is that they tend to populate the borderline between starburst and Seyfert 2 galaxies on the usual line ratio diagrams (Ward et al 1993, Boyle et al 1995, McHardy et al 1997). This ambiguity is explained if these are moderately obscured AGN embedded within active starforming galaxies, as seems to be the case for KUG 1750+683A. Although we require the presence of an obscured AGN to explain the large hard X-ray luminosity, as explained above, the extended narrow emission-line spectrum and the detection of this object in the Kiso Schmidt survey of UV excess galaxies must be due to a large scale starburst. Most of the NLXGs detected to date lie at intermediate redshifts (z) where the field galaxy population is well known to be undergoing significant starforming activity (eg. Tresse et al 1996). The narrow optical emission lines from an obscured AGN are then easily overwhelmed. Spatially-resolved optical spectra of NLXGs, such as presented here, should clarify the presence of any emission-line region photo-ionized by an active nucleus.
5 CONCLUSIONS
We have serendipitously detected a hard-spectrum X-ray source, AX J1749+684, which is identified with a spiral galaxy at a redshift of 0.05. This galaxy shows an integrated LINER/starburst-like optical spectrum but the X-ray luminosity is two orders of magnitude higher than any known starburst galaxy. Spatial variations in the optical emission lines suggest the presence of a more ionized component. In addition, the lack of significant far infra-red emission is inconsistent with a starburst origin for the huge X-ray flux. A plausible explanation is the presence of a moderately obscured active nucleus surrounded by a starforming galaxy. This would simultaneously explain the X-ray emission and the optical spectrum.
The flat X-ray spectrum below 5 keV, combined with the optical spectrum, suggest that this object may be a local counterpart to the faint NLXGs thought to be responsible for the origin of the hard XRB. This raises the intriguing possibility that many of these objects could also contain AGN, embedded within starforming host galaxies. The use of integrated optical spectra would then lead to an ambiguous classification. Many of the NLXGs currently classified as starburst galaxies could well be more distant counterparts to AX J1749+684. Hidden AGN, of which AX J1749+684 is a low redshift and low column density example, may therefore provide the origin of the hard XRB, as originally suggested by Setti & Woltjer (1989), and later modelled by Madau et al (1994) and Comastri et al (1995).
ACKNOWLEDGEMENTS
We thank all the members of the ASCA team who maintain the satellite and carry out operations. This research has made use of the NASA/IPAC Extragalactic Database (NED) which is operated by the Jet Propulsion Laboratory, California Institute of Technology, under contract with the National Aeronautics and Space Administration. The Digitized Sky Surveys were produced at the Space Telescope Science Institute under U.S. Government grant NAG W-2166. We thank R. Kollgaard and CDS at the University of Strasbourg for providing the catalogue of the VLA NEP survey, M. Tashiro and Y. Ishisaki for information about the GIS positional accuracy and S. Ettori for help with the optical observations. ACF, CSC thank the Royal Society, WNB thanks the Smithsonian Institution, and KI, OA thank the PPARC for support.
References
- [1] Almaini O., Shanks T., Boyle B.J., Griffiths R.E., Roche N., Stewart G.C. & Georgantopoulos I., 1996, MNRAS 282, 295
- [2] Bohlin R.C., Savage B.D., Drake J.F., 1978, ApJ, 224, 132
- [3] Boyle B.J., McMahon R.G., Wilkes B.J., Elvis M., 1995, MNRAS 272, 462
- [4] Carballo R. et al 1995, MNRAS 277, 1312
- [5] Chen L.W., Fabian A.C., Gendreau K.C., 1997, MNRAS, 285, 449
- [6] Comastri A., Setti G., Zamorani G. & Hasinger G., 1995, A&A, 296, 1
- [7] Delgado R.M.G., Perez E., 1997, MNRAS, 284,931
- [8] Gendreau K.C. et al., 1995, Publ. Astron. Soc. Japan, 47, L5-L9
- [9] Gotthelf E., 1996, ASCA News, 4, 31
- [10] Griffiths R.E. & Padovani P. 1990, ApJ 360, 483
- [11] Griffiths R.E., Della Ceca R., Georgantopoulos I., Boyle B.J., Stewart G.C., Shanks T., Fruscione A., 1996, MNRAS, 281, 71
- [12] Hasinger G., 1996, A&AS 120, 607
- [13] Iwasawa K., Brandt W.N., Fabian A.C., 1997, MNRAS, in press
- [14] Kii. T., Nakagawa T., Fujimoto R., Ogasaka T., Miyazaki T., Kawabe R. & Terashima Y., 1996, in X-ray Imaging and Spectroscopy of Cosmic Hot Plasmas, eds. F. Makino, K. Mitsuda, Universal Academy Press Inc., Tokyo, p161
- [15] Kollgaard R.I., Brinkmann W., Chester M.M., Feigelson E.D., Hertz P., Reich P., Wielebinski R., 1994, ApJS, 93, 145
- [16] Lawrence A., Elvis M., 1982, ApJ, 256, 410
- [17] Madau P., Ghisellini G., Fabian A.C., 1994, MNRAS, 270, 17
- [18] McCarthy P.J., Heckman T. & Van Breugel W., 1987, ApJ, 92, 264
- [19] McHardy I., et al, 1996, Spectrum, 6,11
- [20] McHardy I., et al, 1997, MNRAS, submitted
- [21] Piccinotti G., Mushotzky R.F., Boldt E.A., Holt S.S., Marshall F.E., Serlemitsos P.J., Shafer R.A., 1982, ApJ, 253, 484
- [22] Roche N., Shanks T., Georgantopoulos I., Stewart G.C., Boyle B.J., Griffiths R.E., 1995, MNRAS, 273, L15
- [23] Romero-Colmenero E., Branduardi-Raymont G., Carrera F.J., Jones L.R., Mason K.O., Mc Hardy I.M. & Mittaz J.P.D., 1996, MNRAS 282, 94
- [24] Setti G., Woltjer L., 1989, A&A, 224, 21
- [25] Takase B., Miyauchi-Isobe N., 1989, Pub. Nat. Ast. Soc. Japan, 1, 97
- [26] Tresse L.. Rola C., Hammer F., Stasinska G., Le Fevre O., Lilly S.J., Crampton D., 1996, MNRAS 281, 847
- [27] Veilleux S., Osterbrock D.E., 1987, ApJS, 63, 295
- [28] Ward M.J., Done C., Fabian A.C., Tennant A.F., Shafer R.A., 1988, ApJ, 324, 767
- [29] Ward M.J., Hughes D.H., Dunlop J.S., Appleton P.N., 1993 IAU Symposium No. 159, p. 31
- [30] Yaqoob T., Serlemitsos P.J., Ptak A., Mushotzky R.F., Kunieda H., Terashima Y., 1995, ApJ, 455, 508