12(02.16.1;09.07.1;10.06.1)
A. Postal 26 La Hechicera, Mérida 5251, Venezuela.
22institutetext: Institut National des Sciences Appliquées de Toulouse, France.
A. Parravano
Diffuse Gas Condensation Induced by Variations of the Ionizing Flux
Abstract
The variation of an ionizing flux as a mechanism to stimulate the condensation of a diffuse gas is considered. To illustrate this effect, two situations are examined: one on the context of pregalactic conditions, and the other on the context of the actual interstellar medium. We focus our attention on flash-like variations; that is, during a “short” period of time the ionizing flux is enhanced in comparison to the pre- and post-flash values. In both cases the cause of the induced phase change is the same: the enhancement of the cooling rate by the increase in the electron density caused by the momentary increase of ionizing flux. After the passing of the flash, the cooling rate remains enhanced due to the “inertia of the ionization”. In the first case (metal free gas) the cooling rate is enhanced due to the fact that the increase of the electron density makes possible the gas phase formation of by the creation of the intermediaries and . We show that after the passing of the photo-ionizing flash a cloud near thermo-chemical equilibrium at may be induced to increase its content by many orders of magnitude, causing a rapid decrease of its temperature to values as low as . In the second case (solar abundances gas) the dominant cooling mechanism of the warm neutral gas (the excitation of heavy ions by electron impacts) is proportional to the electron density. We show that, for the expected states of the warm interstellar gas, ionizing flashes may induce the phase transition from the warm to the cool phase. The results indicate that the mechanism of induced condensation studied here might play a relevant role in the gas evolution of the diffuse gas in both, the pregalactic and the actual interstellar medium conditions.
keywords:
Plasmas - Galaxy: formation - ISM: general1 Introduction
Thermal condensation of diffuse gas is a commonly invoked route for the formation of dense astrophysical structures. This thermal condensation may occur spontaneously or may be induced by variations of the external conditions. In the first situation (spontaneous condensation), the initially diffuse gas is in a state out of equilibrium in which the cooling dominates over the heating. Eventually, the gas reachs a thermo-chemical equilibrium in a dense and cool state. In the second situation (induced condensation), in absence of variation of external conditions the gas would reach (or be in) a state of thermo-chemical equilibrium in a diffuse and hot state, but in presence of appropriate variations of the external conditions, the gas evolves toward a cooler and denser state. Induced condensation of diffuse gas must play an important role in the large scale evolution of the medium; specially if the stimulating sources are able to induced condensation far away from them. The synchronization and the large scale patterns of star formation may be governed by this kind of stimulation. In fact, most of the models and numerical simulations of the star formation in disk galaxies include as a main process the so-called self-propagating star formation (Gerola & Seiden 1978; Seiden & Gerola 1982; Shore 1981, 1983; Palouŝ et al. 1990; Comins & Shore 1990; Cammerer & Shchekinov 1994). This kind of systems are part of the wider class of reaction-diffusion systems (Kapral 1993, and references therein). In particular, the so-called exitable media are appropriate to capture the main features of the pattern formation in disk galaxies (Smolin 1996).
Among the external conditions whose variations would induce phase
transitions are the external pressure and the ionizing flux.
We focus our attention on the effect of the variation of the ionizing flux,
keeping in mind that induced condensation by pressure variations may play a
relevant role
(Roberts 1969;
Shapiro & Kang 1987).
In particular, we focus our attention on flash-like variations; that is,
during a ”short” period of time, the ionizing flux is enhanced in
comparison to the pre- and post-flash values.
To illustrate this mechanism of induced condensation,
two examples are given here: one on the context of pregalactic conditions
(in a free metal cloud), and the other on the context of the actual
interstellar medium (in a gas with solar abundances).
In both cases the cause of the induced phase change is the same:
the increase in the electron density due to the momentary increase of
ionizing flux enhances the cooling rate.
After the passing of the flash, the cooling rate remains
enhanced due to the inertia of the ionization (i.e. the characteristic
recombination time is much larger than the cooling one).
Many scenarios in which a flash of radiation affects the evolution of
gas clouds can be imagined. For the metal free gas case, this kind of
induced condensation might be relevant at the epoch of galaxy formation.
In particular, the ionizing flash effect might be a key step in the
sequence of events that have conduced to the formation of globular
clusters. It has been stated by Cox (1985) that “such a rapid
fragmentation of the halo almost certainly requires inducement by
energy leaving the (primitive) disk”.
For the case of a gas with solar abundances, the evoked
mechanisms of induction are diverse but generally associated to compression
and convergent mass flows
(see review by Elmegreen 1992).
However, in addition to these mechanisms, the induced condensation by
ionizing flashes appears as an effect to be considered.
In Sec. 2 the basic equations to follow the thermal and chemical evolution of a gas subject to variations of the gas pressure and the ionizing flux are given. In Sec. 3 the evolution of a free metal gas cloud subject to a flash of ionizing and dissociating radiation is analyzed, whereas, in Sec. 4, the evolution of a solar abundance gas subject to a flash of cosmic ray flux is considered. Finally, the conclusions are given in Sec. 5.
2 Basic equations
The thermal and chemical evolution of a gas subjected to variable external conditions are calculated by solving the system of kinetic equations and the equation of energy conservation. The system of kinetic equations can be written in the general form
| (1) |
where is the total number density of hydrogen nuclei and is the relative number density of the -th species. In Eq. (1), and are, respectively, the formation and destruction rates of the -th species due to double collisions, whereas, and are, respectively, the production and destruction rates of the -th species due to the interaction of particles with radiation.
The equation of energy conservation equation can be expressed as
| (2) |
where U is the internal energy by unit mass, is the net cooling rate by unit mass ( ), is the pressure, is the mass density, and is the specific volume. Assuming that and , with R the gas constant, and the molar mass, eq. (2) can be written as
| (3) |
Two extreme situations that can be used to confine intermediate situations are the constant density and constant pressure approximations. In these approximations, the energy conservation equation can be expressed as
| (4) |
where, or in the constant density or in the constant pressure approximations, respectively.
Variations of the external ionizing sources flux produces direct variation on the rates and , and on the heating rate , whereas, variations of the presure affect density and temperature. Notice that variations of or provoke a variation of the chemical state of the gas, and therefore produce a variation of the cooling rate . In the following, we solve the basic equations (1) and (2) with the appropriate assumptions in order to model: a) the evolution of a metal free cloud subjected to a variation of the ionizing and dissociating flux (sec. 3), and b) the evolution of a solar abundance gas subjected to variations of the primary ionization rate due to cosmic rays (sec. 4).
3 Photo-ionizing radiation flash as trigger of efficient cooling in free metal gas clouds
In the context of formation of galaxies and globular clusters, the non-equilibrium formation of has been identified as a key process for achieving a rapid cooling bellow (Palla & Stahler 1983; Izotov & Kolesnik 1984; Shapiro & Kang 1987; Palla & Zinnecker 1987; Kang et al. 1990; Anninos et al. 1996; Padoan et al. 1996; Tegmark et al. 1996). On the other hand, the ionization and dissociation of primordial gas by UV background radiation have been taken into account as an important parameter in many studies of the thermo-chemical evolution of pregalactic and intergalactic structures (Kang et al. 1990; Donahue & Shull 1991; Ferrara & Giallongo 1996; Haardt & Madau 1996; Navarro & Steinmetz 1996; Mucket & Kates 1997). In general, the UV background radiation acts as an inhibitor of formation. However, there are exceptions to this rule. Recently Haiman et al. (1996) have shown that UV background radiation can enhance the formation of in primordial gas at high densities () and low temperatures (); but for densities lower than the above value, the effect of a constant UV background radiation is to inhibit the formation. As it will be shown in the present section, rapid variations of the UV background radiation can also enhance the non-equilibrium formation of . In particular, we focus our attention on flash like variations capable of heating and increasing the ionization fraction of an initially warm-neutral gas cloud near thermo-chemical equilibrium. After the passing of the radiation pulse, the enhanced ion fraction makes the gas phase formation of molecules possible by the creation of the intermediaries and . The presence of small quantities of molecules then makes possible further radiative cooling to temperatures as low as . The rapid cooling ( free-fall times) abruptly reduces the Jeans mass by a factor , permitting the fragmentation of clouds initially marginally stable. Izotov (1989) has considered the homogeneous contraction approach of a gravitational unstable cloud, but here we are interested in delimiting the necessary conditions that provoke the rapid cooling of the cloud without invoking the gravitational collapse. UV radiation pulses have similar effects than shock waves because the post-shock flow also recombines out of equilibrium.
The spectrum, amplitude and duration of the radiation pulse are free parameters in our model. However, it should be noticed that, in order to induce efficient cooling in the cloud, the detailed form of the flash is not important as long as that, during the flash, the ionization of the cloud increases appreciably and after this, the ionizing flux decreases to background values in a short time compared to the recombination time.
The initial conditions of the cloud and the characteristics of the hypothetic ionizing pulse depend on the chosen scenery. For example in the Fall and Rees (1985) scenery, during the proto-galactic collapse, if the gas is assumed to be lumpy, the overdense regions will cool more rapidly than the underdense regions producing a two-phase medium. But the developing rate of this overdense regions depends on the initial conditions (i.e. the denser regions develop faster; Murray and Lin 1990) and on their interaction with the system. Thus, a dependence of the density contrast and of the mean cloud masses on the galactocentric distance are expected. The assumption of an ionizing flash produced in the galactic nucleus implicitly assumes a radial increment of the delay in the evolution of the clouds relative to the center. The dilution and attenuation of the ionizing and dissociating radiation produced in the flash also introduce a radial dependence. In fact, the possibility that proto-galactic structures are exposed to UV radiation emitted by massive young stars or an active galactic nucleus has been considered previously (Kang et al. 1990). Therefore, it would be useful to know the dependence of the cloud evolution on the flash characteristics, and on the cloud initial state (i.e cloud mass (), temperature (), number density (), and the relative number density of the species ().
To follow the thermal and chemical evolution of a metal-free cloud in presence
of a variable radiation flux, we consider an idealized uniform cloud.
The gas model adopted for this application considers
the following 9 species:
, , , , , , , , and .
Assuming a mass fraction () of Helium relative to Hydrogen, then
, where is the ratio of the
number density of species to the total number density of Hydrogen nuclei .
The processes of formation and destruction of these nine species are assumed to be
the 24 reactions in Table I of Rosenzweig et al. 1994.
The adopted cooling rates, include:
1) the collisional ionization of by electron impact;
2) the free-free transitions of (Izotov (1989) and references
therein);
3) the collisional ionization by electron impact of and ;
4) the free-free transitions of and ;
5) the total dielectronic cooling rate of (Shapiro & Kang 1987);
6) the cooling rates due to rotational and vibrational transitions
excited by () and () collisions, calculated according
to Lepp and Shull (1983). These cooling rates must be multiplied
by a factor
and
to take into account the escape probability of the vibrational and rotational
photons, respectively.
Finally, 7) the excitation
of the vibrational levels () by low energy electron-impact
was taken into account (Klonover & Kaldor, 1979).
The external radiation flux affects the photoionization of the Hydrogen and Helium, and the photo-dissociation (and its associated heating rates; see Rosenzweig et al. 1994). The external photon flux is assumed to have the quasar-like distribution (Shapiro and Kang 1987)
| (5) |
where is the H Lyman-edge frequency. The function is introduced to represent the changes of the flux level outside the cloud, and is assumed to behave as in the Lyman continuum, and as for the photo-dissociating photons. Since a homogeneous cloud is assumed in this application, the optical depth at its center, for the ionizing radiation, can be written as:
| (6) |
where is the mass of the cloud in units of and are the absorption cross sections of species at frequency . As a first approximation, the attenuation of the external radiation field by the factor is adopted to schematize the opacity effects. For the dissociating radiation field a similar approximation is adopted (Rosenzweig et al. 1994). Obviously, by using this first approximation, the effect of the ionizing radiation is minimized, and the study of the internal structure of the cloud is not possible.
For the time dependence of the flux level we assume a flash like variation. More precisely, during a first period of integration the external radiation flux remains at the assumed background value (i.e. ). The duration of this initial period of integration is large enough (i.e. yr) to ensure that the cloud is near its thermo-chemical equilibrium state. After this first period of stabilization, it is assumed that both, and , increase linearly to the value in a time , and remains at this value during a time . Then, the flux level is assumed to decrease exponentially with a characteristic time to the background value for the ionizing flux, and to for the dissociating flux. This kind of flux variations are expected in the case when the radiation pulse is assumed to be produced by an intense but short event of stellar formation or by the radiation coming from a front shock. In a few million years after the end of the stellar formation process, the ionizing flux is expected to decrease to background values. On the other hand, due to the contribution of intermediate and low mass stars to the dissociating flux, it is expected that its level remain higher than the background value () long after the death of massive stars.
For a given initial state of the cloud, there is a critical background flux level , bellow which the cloud spontaneously cools because the self-shielding allows the formation of at relatively high concentrations. This critical background flux level is mainly sensible to the initial ion fraction due to its strong influence on the formation rate. In order to describe this initial state dependence, it is useful to look at the thermo-chemical equilibrium (TCE) curve (i.e. , and ). Figure (1.a) shows the TCE curves for two different values of the background flux level (lower curve , and upper curve ) when the mass of the cloud is .


Note the three phase structure characterized by the presence of three stable branches (solid lines) denoted in Fig. (1.a) as W-I (i.e. warm-Ionized; ), W-N (i.e. warm-Neutral; ), and C-N (i.e. cool-Neutral; ). Note also the qualitative difference of the TCE curve for low () and high () background flux level. That is, for the left-hand maximum (denoted as ) is over the right-hand maximum (denoted as ), whereas, for . This difference is important because if the cloud is initially in TCE in the W-I branch, and the pressure is progressively increased from to a transition to the W-N phase occurs in the case , but in the case the C-N phase is reached. For , Fig. (1.b) shows the typical isobaric evolution tracks for initially ionized states (arrows A, B, C and D) and for initially neutral states (arrows E, F and G). For cases A, B, and D, as expected the cloud evolves toward the stable branch W-I, W-N, and C-N, respectively. However, in case C, even when the track reaches the C-N branch transversing the W-N branch due to the inertia of the ionization fraction. More precisely, the excess of the ionization fraction shifts the maximum pressure of the corresponding thermal equilibrium curve to a value bellow the pressure corresponding to case C. On the other hand, for the initially neutral states the evolution is substantially different. In case E the track stops in the W-N branch; note the difference with case C. In case F the cooling rate is so small that in practice the cloud reaches a quasi-stationary state similar to that in the W-N branch. The small cooling efficiency is due to the very small formation rate for the low ion fraction in the quasi-stationary W-N state. Finally, for high enough gas pressure as in case G, the cloud reaches the C-N branch. The isobaric evolution tracks for a high background flux level (i.e. ) are similar to those in Fig (1.b) except that the W-N branch can not be reached from an ionized initial state as in case B in Fig. (1.b). It is interesting to note that when the cloud is in the quasi-stationary state schematized by track F, a large enough ionizing flash is able to increase formation rate and to stimulate the rapid condensation to reach the C-N branch.
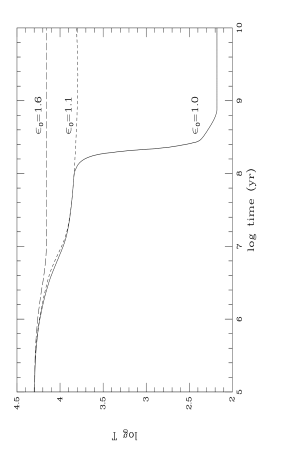
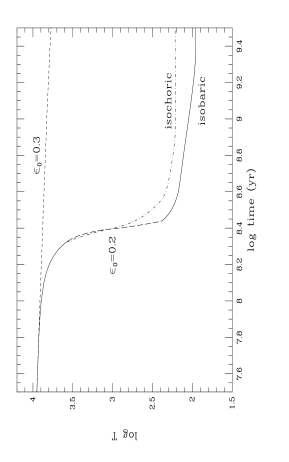
The analysis of the various evolution tracks in Fig. (1.b) have been made for a fixed background flux level. Taken into account that an increase of the background flux level shift the TCE curve upward, a similar analysis can be made for a fixed pressure but varying the background flux level. Figure (2.a) shows, in the constant pressure approximation, the time dependence of the gas temperature for a cloud subject to the three labeled values of the background flux level . The initial condition is the same in the three cases and corresponds to an out of equilibrium warm-ionized state at a gas pressure , and , , , , , , , , , , and . The temperature evolution in the three plotted cases differs because for the system stabilizes in the W-I branch (i.e. as in track A of Fig. (1.b)), for the system stabilizes in the W-N branch (i.e. as in track B of Fig. (1.b)), and for the system stabilizes in the C-N branch (i.e. as in track C of Fig. (1.b)). On the other hand, Fig. (2.b) shows the temperature evolution for the same pressure as in Fig. (2.a), but for an initially neutral warm state, (i.e. , , , , , , , , , , and ). In this case, the evolution for corresponds to the situation schematized by track F in Fig. (1.b); that is, the system enters in a quasi-stationary state characterized by a very slow decrease of the temperature. However, for the system evolves rapidly to the C-N branch, a situation that corresponds to that schematized by track G in Fig. (1.b). The results in Figs. (2.a) and (2.b) illustrate how the initial cloud state affects the critical value of bellow which the cloud evolves toward the C-N branch (i.e. the cloud condenses). In order to show the effect of the constant density approximation, Fig. (2.b) also shows the temperature evolution for when the constant pressure approximation is switched to the constant density approximation at the time when the rate of decrement of the cloud radius equals the sound speed.

For initially ionized states at pressure , the critical value roughly corresponds to the value of that produces a maximum in the TCE curve at pressure . For a high background flux level, the left-hand maximum (denoted as in Fig. (1.a)) is the higher maximum and must be equaled to . For a low background flux level, the right-hand maximum must be equaled to . On the other hand, for initially neutral states, the critical value must be calculated by finding the value of bellow which the evolution does not fall in the quasi-stationary warm-neutral state. The dependence of the critical value of on the initial cloud state is summarized in Fig. (3) for a cloud. The results are showed as function of the initial cloud column density (). The left-hand side curve corresponds to the critical background flux level for initially ionized states. The upper segment (labeled I-branch) corresponds to background flux levels for which , and therefore, the condition is used. The lower segment (labeled N-branch) corresponds to the case when the condition is used because for these values of . The initial column density is calculated assuming that initially the cloud is at and at a pressure ; the initial concentrations are assumed to be the used in Fig. (2.a). For values of () above the left-hand curve, the initially ionized cloud reaches TCE in the stable warm phase, but below this curve the cool-neutral branch is reached. On the other hand, the right-hand side curve corresponds to the critical background flux level for initially neutral states. In this case, the initial column density is calculated assuming that initially the cloud is at and the initial concentrations are assumed to be the used in Fig. (2.b); the initial density is varied in order to cover the plotted range of . For values of () above the right-hand curve, the initially neutral cloud attains a quasi-stationary warm-neutral state, but below this curve the cool-Neutral branch is reached. It is to be noticed that as the initial electron concentration increase, the right-hand curve approaches the left-hand curve. In any case, there exist a set of initial conditions for which the cloud reaches a quasi-stationary warm-neutral state. The point to be emphasized is that these quasi-stationary states are susceptible to be induced to condensate if the cloud is exposed to an intense enough ionizing flash.


In order to illustrate the effect of the ionizing flash on a cloud that has fallen in the quasi-stationary warm-neutral state, Figs. (4a,b,c) show respectively the time dependence of the temperature, the relative number density of electrons (), and of Hydrogen molecules (), for a cloud. The initial condition corresponds to an out of equilibrium warm-neutral state at a gas pressure (i.e. , , and the initial concentrations used in Fig. (2.a)). The curves labeled (a) in Figs. (4) are plotted for reference, and correspond to the case when the cloud is subjet to a constant background flux level of . As expected for , the cloud evolves toward a quasi-equilibrium warm neutral state. The curves labeled (b) and (c) in Figs. (4) correspond to the evolution of the cloud when it is subjected at yr to a flash. In case (b), the flash characteristics are: yr, yr, yr, , and . In case (c) the flash characteristics are the same as in case (b) but with . Notice in Figs. (4) that during the increase of the external radiation flux from to , the electron density and the temperature increase, whereas the and densities decrease. During the time when , the electron density and the temperature continue to increase because the variation of during the time is rapid enough to leave the gas far from equilibrium. At the end of the lapse of decrement of , if is short enough, the gas has an excess of electrons and thermal energy compared with the equilibrium values corresponding to and . After the lapse of UV flux decrement, recombination continues, but at a lower rate than the cooling. The excess of electrons at these relatively low temperatures results in an enhancement of the rate formation. Even when , the abundance of may reach a large enough value to produce considerable self-shielding. If the cloud reaches a critical value () for the optical depth at dissociating frequencies, the abundance grows very fast, allowing the cooling of the cloud to temperatures of the order of . This is the situation for case (b) in Figs. (4), where the flash induce rapid cooling even when . On the other hand, for case (c) a post flash dissociating level with is enough to inhibit the formation of , and then, the cloud remains warm.
A detailed study of the dependence of the cloud evolution on the phase space of free parameters (cloud mass, initial conditions, and flash characteristics) is out of the scope of this simple application. However, such detailed study may reveal that the stimulating condensation process studied here can be effective in a restricted region of the free parameters space, and therefore, may act as a selective effect that contributes to the formation of dense structures at certain scales.
4 Ionizing pulse as trigger of warm to cool phase transition in a gas with solar abundances
Among the various processes that determine the change of state of the ISM material, phase transitions are expected to play an important role. In particular, warm to cool phase transition has been indicated as a channel to transform diffuse gas () into denser states () (Field, Goldsmith & Habing 1969; Lepp et al. 1985; Parravano 1987; Lioure & Chièze 1990; Dickey & Brinks 1993). Moreover, it has been proposed (Parravano 1988, 1989) that the large scale star formation rate must be self-regulated because, on one hand the warm gas condensation is inhibited by high enough UV radiation (coming mainly from massive stars), and on the other hand, a gas supply from the diffuse phases is required to feed the large scale star formation process. In this way, the large scale star formation rate is limitated, and the warm gas tends to remains close the critical state for warm to cool phase transition. The fact that large quantities of ISM warm gas remain close to this critical state allows the trigger of condensation by relatively small variations of the ambient conditions. More precisely, the mean “distance” of the warm gas state to the critical state for spontaneous condensation is determined by the amplitude spectrum of the variations of the ambient conditions. In any case, the study of triggered condensation of warm gases close to the critical state can be justified by the self-regulatory hypothesis. It is to be noticed that the scale of the inhibitory process is expected to be much larger than the scale of the triggering processes: a fact that apparently is a common characteristic of many dynamical systems where spiral structures arise (Smolin 1996).
Triggering mechanisms of star formation are usually related to compression and pushing of the ISM gas by high pressure events associated to stars formed previously (reviews on this topic can be found in Elmegreen 1992, Franco 1992). Also, compression of the warm gas by the spiral density wave have been evocated as a main trigger of its condensation (Roberts 1969); however, stimulated condensation by ionizing flashes may also enter as an initiator of the chain of processes that finally results in the formation of stars. As it will be shown bellow, this stimulating mechanism is particularly efficient when the warm gas state is close to its marginal state for spontaneous phase transition. Moreover, variations of the ionizing flux are expected to precede pressure variations if both variations are associated to the same perturbing event. Large local variation of the ionizing rate are expected to be present in the interstellar medium. Sudden appearance and disappearance of ionizing sources occur continuously in the galactic plane. Also, “rapid” variation of the opacity to the ionizing radiation in a line of seeing is expected. Finally, variations of the cosmic ray flux are expected to be present due to variations of the sources (cosmic ray acceleration in shock fronts with oblique B-fields; Blandford and Ostriker 1978), and to variations of the magnetic field topology (i.e. focalization or dis-focalization of the cosmic ray stream in a region). It was also proposed (Ko & Parker 1989; Nozakura 1993) that star formation controls dynamo activities and hence large scale magnetic fields of disk galaxies.
The cooling of the diffuse warm interstellar gas is mainly due to electron collisional excitation of a) fine structure levels and metastable states of the positive ions , , , and , and b) excitation. Therefore, an increase of the ionizing flux (and the consequent increase of the electron density) tends to reduce the gas temperature if the increase of the cooling efficiency overcomes the associated increase of the heating. In general, this is the case for low equilibrium ionization fractions when the kinetic energy of the electrons that result from the ionization process is small. Depending on the value of the pressure and on the increase of the ionizing flux, the new thermal equilibrium state might be located in the cool neutral branch. That is: sufficiently large variations of the ionizing rate are expected to provoke the warm to cool phase transition. Moreover, if the ionizing flux variation has a flash-like variation, then, after the passing of the flash, the cooling rate remains enhanced due to the inertia of ionization.
In order to illustrate this effect, we consider variations of the primary ionization rate by cosmic rays which is the accepted main source of ionization of the interstellar warm gas far away from massive stars. Other mechanisms of ionization have been proposed (i.e. OB stars (Reinolds & Cox 1992), the neutrino decay theory (Sciama 1990, 1993)), but for the present analysis the exact mechanism of ionization is not relevant. What is important here is the variation of the ionizing and heating rates due to a change of the considered ionizing flux.

The main changes of the curve of thermo-chemical equilibrium (TCE) when is changed are summarized in Fig. (5), where the maximal () and the minimal () pressures of the TCE curve are plotted as a function of . All the results in this section correspond to the standard solar neighborhood far UV energy density and gas composition. The labels are used to remind that if (or ) then there is only one possible state of TCE in the diffuse and warm phase (or in the dense and cool phase). If then the gas may reach any of the two stable branches (the warm or the cool branch). If the gas is initially in TCE at the warm branch (for example with the external conditions () corresponding to the point (A) in Fig. (5), then, the gas could be forced to evolve toward the cool branch if the external conditions are changed, for example, to () corresponding to the point (B). The typical time for the transition from the warm to the cool branch is yr. Once the gas reaches the cool phase, the external conditions can change again to () but the gas will remain in the cool branch. To drive the gas to the warm phase again, the external conditions must be changed, for example, to () corresponding to the point (C) in Fig. (5). Now, the gas could return to the initial state if the external conditions changes to the initial condition ().
The phase transitions described above assume that the time between the consecutive changes of are long enough to reach TCE. If the variation of occurs before TCE is achieved, then, the phase transition does not necessarily occur. Here we will consider the effect of flash-like variations of at constant pressure. That is, at the beginning we assume that the gas is in the warm branch in the equilibrium state corresponding to the external conditions (). Then, is increased abruptly by a factor during a lapse of time , after which the primary ionization rate by cosmic rays returns to the initial value . As mentioned above, a fact that favors the phase transition is that the recombination time is much larger than the cooling time; then after the end of an ionizing pulse, the cooling rate remains enhanced due to the non-equilibrium excess of electrons.
In this simple analysis we neglect non-local processes as thermal conduction, cosmic ray attenuation, radiative transfer, and gas dynamics. Only local processes of radiative cooling, heating, H ionization and recombination are considered (Parravano 1986), assuming that the pressure remains constant during evolution. The neglected non-local processes may play an important role in the local evolution of the gas and in should determine the spatial variations of the physical variables. However, here we are interestested in showing that the inertia of ionization (after the passing of the ionizing pulse) can, in many cases, enhance sufficiently the cooling efficiency to produce a phase transition from the warm gas phase to the cool phase. The evolution of the temperature and the ionization degree is calculated by solving simultaneously the energy conservation equation (2), and the kinetic equation (1) restricted to the Hydrogen ionization-recombination processes.


In order to show the effect of ionizing pulses, Fig. (6) shows the evolution at constant pressure of a warm gas initially in thermo-chemical equilibrium close to the critical state for spontaneous condensation. The pressure is bellow by a factor , when the pre-flash primary ionization rate is . The three curves in Fig. (6) correspond to the evolution for three different values of the pulse duration , , and Myr, when the flash is initiated at yr and the factor of increment of is . Note in Fig. (6) that there is a critical value of bellow which condensation does not occur (in this case Myr). Note also that the time required to complete the phase transition decreases as increase, but the time required for the temperature drop from to is insensitive to . The kink at the bottom of the and curves, and the smooth dip in the curve are due to the inertia of the ionization fraction (the recombination time is much longer for the conditions corresponding to the upper curve).
In Fig. (7) the critical values of are plotted as function of for the three labeled values of . These curves divide the plane in two regions: above the curves the flash is capable of inducing phase transition, and bellow the curve the gas returns to its initial state after the passing of the flash. Note that a cosmic ray pulse with a factor of increment of the order of , and a duration of about one Myr can induce the condensation of the warm gas in TCE at .
5 Summary and Conclusions
The variation of the ionizing flux as a mechanism for stimulating the condensation of the diffuse gas was considered. To illustrate this effect, two situations were examined: one on the context of pregalactic conditions (a free metal cloud), and the other on the context of the actual interstellar medium (a gas with solar abundances). We have focused our attention on flash-like variations; that is, during a “short” period of time the ionizing flux is enhanced in comparison to the pre and post flash values. In both cases the cause of the induced phase change is the same: the enhancement of the cooling rate by the increase of the electron density caused by the momentary increase of ionizing flux. After the passing of the flash, the cooling rate remains enhanced due to the inertia of the ionization. In the first case (metal free gas) we show that after the lapse of UV flux decrement, recombination continues, but at a lower rate than the cooling. The excess of electrons at these relatively low temperatures results in an enhancement of the rate formation due to the enhanced abundance of the intermediary. Even when , the abundance of may reach a large enough value to produce considerable self-shielding. If the cloud reaches a critical value () for the optical depth at dissociating frequencies, the abundance grows very fast, allowing the cooling of the cloud to temperatures of the order of . The temperature drop occurs in a fraction () of the free fall time provoking a rapid decrease of the Jeans mass. However, if the post-flash dissociating level is large enough the formation can be inhibit and the cloud remains warm.
In the second case (solar abundances gas) the dominant cooling mechanism of the warm neutral gas (the excitation of heavy ions by electron impacts) is proportional to the electron density, and therefore, the ionizing flash increases the cooling efficiency. We considers flash-like variations of the primary ionization rate by cosmic rays and calculate the marginal flash characteristics to induce warm gas condensation. We show that, for the expected states of the warm interstellar gas, ionizing flashes may easily induce the phase transition from the warm to the cool phase. The phase transition is completed in about yr; however, the drop in the temperature from to occurs in about yr.
The results indicate that the mechanism of induced condensation studied here might play a relevant role in the gas evolution of the diffuse gas in both, the pregalactic and the actual interstellar medium conditions.
The above results include only local processes. However, non-local processes like thermal conduction impose restrictions on the size of the condensing structures. Thermal conduction tends to attenuate temperature gradients, and therefore, it imposes a minimal value for the mass of the condensing structures (Corbelli & Ferrara 1995; Ibáñez & Rosenzweig 1995; Steele & Ibáñez 1997). Critical masses of the order of galaxy masses are obtained in the case of a metal-free gas (Ibáñez & Parravano 1983) and in the case of an actual interstellar gas, masses of the order of one solar mass are obtained (Parravano 1986; Parravano, Ibáñez & Mendoza 1993). However, a wide range of critical masses are obtained depending on the initial gas state, and ambient conditions. Therefore, in addition to the restrictions on and to induce the warm gas condensation, the cosmic ray flash should cover a region greater than the critical value imposed by thermal conduction and other diffusive processes.
Acknowledgements.
We are very greatful to the referee A. Ferrara for his useful comments that motivated us to include Helium in the metal free model and to clarify the discussion by including the phase diagram. This work has been supported by CDCHT and calculations were performed at CECALCULA, both institutuons of the Universidad de Los Andes.References
- [1] Annimos P., Norman M.L., 1996, Apj 460, 556
- [2] Blandford R.D., Ostriker J.P., 1978, Apj 221, L29
- [3] Cammerer M., Shchekinov Yu., 1994, A&A 283, 845
- [4] Commins N.F., Shore S.N., 1990, A&A 237,345
- [5] Corbelli E., Ferrara A., 1995, Apj 447, 708
- [6] Cox D.P., 1985, Apj 288, 465
- [7] Dickey J.M., Brinks E., 1993, Apj 405, 163
- [8] Donahue M., Shull J.M., 1991, Apj 383, 511
- [9] Elmegreen B.G., 1992, in: Star formation in Stellar Systems, eds. G. Tenorio-Tagle, M. Prieto, F. Sanchez, Cambridge University Press, p. 381
- [10] Fall S.M., Rees M.J., 1985, Apj. 298, 18
- [11] Field G.B., Goldsmith D.W., Habing H.J., 1969, Apj 155, L149
- [12] Ferrara A., Giallongo E., 1996, MNRAS 282, 1165
- [13] Franco J., 1992, in: Star formation in Stellar Systems, eds. G. Tenorio-Tagle, M. Prieto, F. Sanchez, Cambridge University Press, p. 515
- [14] Gerola H., Seiden P.E., 1978, Apj 223, 129
- [15] Haardt F., Madau P., 1996, Apj 461, 20
- [16] Haiman Z., Rees M.J., Loeb A., 1996, Apj 467, 522
- [17] Ibáñez S.M.H., Parravano A., 1983, Apj 275, 181
- [18] Ibáñez S.M.H., Rosenzweig P., 1995, Phys. Plasmas 11, 4127
- [19] Izotov Yu.I., 1989, Kiev Inst. Teoret. Fiz. ITP-89-17E
- [20] Izotov Yu.I., Kolesnik I.G., 1984, Soviet Astr. 28, No 1, 15
- [21] Kang H., Shapiro P.R., Fall S.M., Rees M.J., 1990, Apj 363, 488
- [22] Kapral R., 1993, in: Theory and applications of coupled map lattices, ed. K. Kaneko, John Wiley & Sons Ltd, p. 135
- [23] Klonover A., Kaldor U., 1979, J. Phys. B 12, 3797
- [24] Ko C.M., Parker E.N., 1989, Apj 341, 828
- [25] Lepp S., McCray R., Shull J.M., Woods D.T., Kallman T., 1985, Apj 228, 58
- [26] Lepp S., Shull J.M., 1983, Apj 270, 578
- [27] Lioure A., Chièze J-P.,1990, A&A 235, 379
- [28] Mucket J.P., Kates R.E., 1997, submitted to A&A, preprint astro-ph/9702022.
- [29] Murray S.D., Lin D.N.C., 1990, Apj 363, 50
- [30] Navarro J.F., Steinmetz M., 1996, submitted to Apj, preprint astro-ph/9605043
- [31] Nozakura T., 1993, MNRAS 260, 861
- [32] Padoan P., Jimenez R., Jones B., 1996, submitted to MNRAS
- [33] Palla F., Stahler S.W., 1983, Apj 271,632
- [34] Palla, F., and Zinnecker, H. 1987, in: Starbursts and Galaxy evolution, ed. T.X. Thuan, T. Montmerle, and J. T. Thanh Van (Gif Sur Yvette: Editions Frontiéres),p. 533
- [35] Palouŝ J., Franco J., Tenorio-Tagle G., 1990, A&A 283,845
- [36] Parravano A., 1987, A&A 172, 280
- [37] ————- 1988, A&A 205, 71
- [38] Parravano A., Ibáñez S.M.H., Mendoza B.C.A., 1993, Apj 412, 625
- [39] Reinolds R.J., Cox D.P., 1992, Apj 400, L33
- [40] Roberts W.W., Jr., 1969, Apj 158, 123
- [41] Rosenzweig P., Parravano A., Ibáẽz S.M.H., Izotov Yu.I., 1994, Apj 432, 485
- [42] Sciama D.W., 1990, Apj 364, 549
- [43] ———— 1993, Apj 409, L25
- [44] Seiden P.E., Gerola H., 1982, Fund. Cosmic. Phys. 7, 241
- [45] Shapiro P.R., Kang H., 1987, Apj 318, 32
- [46] Shore S.N., 1981, Apj 249,93
- [47] ———– 1983, Apj 265, 202
- [48] Smolin L., 1996, astro-ph/9612033 preprint
- [49] Steele C.D.C., Ibáñez S.M.H., 1997, submitted to Phys. Plasmas
- [50] Tegmark M., Silk J., Rees M.J., Blanchard A., Abel A., Palla F., 1996, Apj 474, 1