HST, radio and infrared observations of 28 3CR radio galaxies at redshift — I. The observations
Abstract
Hubble Space Telescope images are presented of a sample of 28 3CR radio galaxies with redshifts in the range , together with maps at comparable angular resolution of their radio structure, taken using the Very Large Array. Infrared images of the fields, taken with the United Kingdom InfraRed Telescope, are also presented. The optical images display a spectacular range of structures. Many of the galaxies show highly elongated optical emission aligned along the directions of the radio axes, but this is not a universal effect; a small number of sources are either symmetrical or misaligned. Amongst those sources which do show an alignment effect, the morphology of the optical emission varies greatly, from a single bright elongated emission region to strings of optical knots stretching from one radio hotspot to the other. The infrared images display much less complexity. Although their significantly lower angular resolution would wash out some of the smaller structures seen in the HST images, it is clear that these galaxies are less aligned at infrared wavelengths than in the optical. In this paper, we discuss the galaxies individually, but defer a statistical analysis of the multi-waveband properties of the complete sample of sources to later papers in this series.
keywords:
galaxies: active — galaxies: evolution — radio continuum: galaxies — infrared: galaxies — galaxies: photometry1 Introduction
High redshift radio galaxies provide well–defined samples of objects for studies of the distant Universe, for investigating both the formation and evolution of their stellar populations and, as a result of the strong interactions of the radio components with their environment, the structure of the interstellar and intergalactic medium at cosmological redshifts. The 3CR sample of Laing, Riley and Longair [Laing et al. 1983] contains the brightest radio galaxies in the northern sky, selected at low radio frequency, and provides a well–defined sample of these objects out to redshifts . This sample provides the basis of the research presented in this paper.
In 1987, McCarthy et al. and Chambers et al. discovered that the optical emission of high redshift radio galaxies has a strong tendency to be elongated and aligned along the radio axis. Many different models have been proposed to explain the alignment, but none are entirely satisfactory (see McCarthy 1993 for a general review). The most popular models for this alignment are: (i) massive star formation induced by shocks associated with the passage of the radio jets [McCarthy et al. 1987, Chambers et al. 1987, Rees 1989, Begelman & Cioffi 1989, De Young 1989, Daly 1990]; (ii) scattering of light from an obscured active galactic nucleus by electrons or dust [di Serego Alighieri et al. 1989, Fabian 1989, Cimatti et al. 1993, di Serego Alighieri et al. 1994, di Serego Alighieri et al. 1996, Cimatti et al. 1996, Dey & Spinrad 1996]; (iii) nebular continuum emission from thermal gas [Dickson et al. 1995]. It seems likely that some combination of all three proposals will be required to explain all of the properties of these active galaxies.
The high–redshift 3CR radio sources are of particular importance for many reasons. It has been known since the 1960’s that the sources in the 3CR sample exhibit strong cosmological evolution, of exactly the same form as found for the more populous radio quiet quasars and the faint X–ray sources (eg. Dunlop 1994). Therefore the objects in the 3CR sample must contain clues to the origin of these evolutionary effects. In addition, the 3CR radio galaxies in the complete sample display a very well defined infrared apparent magnitude vs redshift relation which shows evidence for passive evolution of the stellar populations (Lilly and Longair 1984; Best, Longair and Röttgering 1997b, submitted — hereafter Paper II).
Guaranteed–time observations with the Hubble Space Telescope (HST) were awarded to a programme of imaging the large redshift 3CR radio galaxies, and the sample was selected in the following way. From the revised 3CR sample of Laing et al. [Laing et al. 1983], a complete subsample of 113 sources was selected which satisfied the selection criteria , , and . Of these sources, 24 are quasars and 89 are radio galaxies. The radio galaxies can be further subdivided into FR I and FR II classes on the basis of their radio structures [Fanaroff & Riley 1974], the FR II class being the classical double radio sources with hotspots towards the leading edges of the diffuse radio lobes.
For our programme, the FR II radio galaxies in the redshift range were initially selected for observation. In fact, 5 radio galaxies of the 33 in this redshift range were not observed. Two sources (3C55 and 3C263.1) had originally been wrongly identified with galaxies at lower redshifts; the redshifts of the revised identifications indicate that they should have been included in the sample. In the other three cases (3C175.1, 3C294 and 3C318) the galaxies were omitted at random from the programme because of the constraints of observing time. As a result, the sample selected is not quite complete, but the omission of these 5 galaxies should not introduce any serious selection effects. The redshift distribution for the complete subsample of 79 3CR FR II radio galaxies is shown in Figure 1, the 28 radio galaxies which constitute this programme being indicated by filled boxes.

In the present paper, observations of the 28 radio galaxies are presented at various wavelengths. In addition to the HST observations, all the radio galaxies have been imaged at radio frequencies using the Very Large Array interferometer (VLA) at 8.4 GHz, and in the near infrared using the United Kingdom InfraRed Telescope (UKIRT). The first results of this programme were presented by Longair et al. [Longair et al. 1995], and a detailed analysis of the optical morphologies of the 8 galaxies in the redshift range was presented by Best et al. [Best et al. 1996]. The interesting case of a jet–cloud interaction in the source 3C34 has also been presented [Best et al. 1997a].
In Section 2 we provide details of the observing techniques and the data reduction. In Section 3 the main observational results of the programme are presented in the form of images and radio maps of the galaxies in the sample. The most important features of each source are noted, together with a short discussion of the implications of these observations for our understanding of that source. In Section 4 we briefly discuss the significance of these results for understanding the astrophysics of powerful radio galaxies, but defer most of the discussion to Papers II and III of this series. In Paper II [Best et al. 1997b] we investigate the old stellar populations of these galaxies: we compare their radial intensity profiles with de Vaucouleurs’ law, investigate the evolution of the environments, luminosities and characteristic sizes of the galaxies with cosmic epoch, and discuss the significance of our observations for the use of these galaxies as cosmological probes. In Paper III (Best et al., in preparation) we investigate the multi–wavelength properties of the sources, and discuss the alignment effect.
Throughout this paper, all positions are given in equinox J2000 coordinates, and we assume km s-1 Mpc-1 and .
2 Observations and data reduction
2.1 Hubble Space Telescope observations
| Source | z | Obs. | Filter | Cent. | Exp. | Ap. | WFPC | Error | Emission | % flux | Refs3 |
|---|---|---|---|---|---|---|---|---|---|---|---|
| Date | Wave. | Time | Diam | Mag.1 | Lines 2 | in lines | |||||
| [Å] | [s] | [′′] | |||||||||
| (1) | (2) | (3) | (4) | (5) | (6) | (7) | (8) | (9) | (10) | (11) | (12) |
| 3C13 | 1.351 | 03/06/94 | f785LP | 8620 | 1700 | 5 | 20.02 | 0.05 | [NeV], [OII], [NeIII] | A | |
| 20/09/95 | f814W | 7880 | 2800 | 5 | 20.42 | 0.04 | [NeV], [OII], [NeIII] | A | |||
| 3C22 | 0.938 | 07/09/94 | f622W | 6160 | 1700 | 9 | 20.19 | 0.15 | MgII, [NeV] | B | |
| 03/09/95 | f814W | 7880 | 1400 | 9 | 18.95 | 0.03 | [OII], [NeIII], H, [OIII] | B | |||
| 3C34 | 0.690 | 10/06/94 | f555W | 5400 | 1700 | 5 | 21.92 | 0.09 | MgII, [NeV], [OII], [NeIII] | C | |
| 10/06/94 | f785LP | 8620 | 1700 | 5 | 19.10 | 0.07 | H, [OIII] | C | |||
| 3C41 | 0.795 | 29/07/94 | f555W | 5400 | 1700 | 9 | 21.68 | 0.09 | MgII, [NeV], [OII] | D | |
| 29/07/94 | f785LP | 8620 | 1700 | 9 | 19.00 | 0.04 | H, [OIII] | D | |||
| 3C49 | 0.621 | 31/10/95 | f555W | 5400 | 1400 | 9 | 20.92 | 0.06 | MgII, [NeV], [OII] | E | |
| 31/10/95 | f814W | 7880 | 1400 | 9 | 19.07 | 0.04 | H, [OIII] | E | |||
| 3C65 | 1.176 | 02/02/95 | f675W | 6700 | 1700 | 9 | 21.88 | 0.17 | MgII, [NeV] | F,G | |
| 02/02/95 | f814W | 7880 | 1760 | 9 | 20.60 | 0.11 | [NeV], [OII], [NeIII] | F,G | |||
| 3C68.2 | 1.575 | 15/07/94 | f785LP | 8620 | 3400 | 9 | 21.05 | 0.11 | [NeV], [OII], [NeIII] | ||
| 3C217 | 0.897 | 26/02/95 | f622W | 6160 | 1700 | 9 | 21.45 | 0.08 | [NeV] | E | |
| 26/02/95 | f814W | 7880 | 1700 | 9 | 20.01 | 0.06 | [OII], [NeIII], H, [OIII] | E | |||
| 3C226 | 0.820 | 04/05/94 | f555W | 5400 | 1700 | 9 | 21.44 | 0.10 | MgII, [NeV],[OII] | H,I | |
| 04/05/94 | f785LP | 8620 | 1700 | 9 | 19.00 | 0.06 | H, [OIII] | H | |||
| 3C239 | 1.781 | 21/05/94 | f785LP | 8620 | 1700 | 5 | 20.67 | 0.08 | MgII, [NeV], [OII] | J | |
| 14/02/96 | f814W | 7880 | 2200 | 5 | 21.00 | 0.05 | MgII, [NeV] | J | |||
| 3C241 | 1.617 | 02/06/94 | f785LP | 8620 | 1700 | 9 | 21.25 | 0.24 | [NeV], [OII], Ne[III] | A | |
| 29/04/96 | f814W | 7880 | 2400 | 9 | 21.38 | 0.09 | MgII, [NeV] | A | |||
| 3C247 | 0.749 | 29/03/96 | f555W | 5400 | 2400 | 5 | 21.48 | 0.03 | MgII, [NeV], [OII], [NeIII] | H | |
| 29/03/96 | f814W | 7880 | 2400 | 5 | 19.27 | 0.03 | H, [OIII] | H | |||
| 3C252 | 1.105 | 27/11/94 | f622W | 6160 | 1700 | 9 | 21.14 | 0.07 | MgII | H | |
| 27/11/94 | f814W | 7880 | 1700 | 9 | 20.13 | 0.07 | [NeV], [OII], [NeIII] | H | |||
| 3C265 | 0.811 | 29/05/94 | f555W | 5400 | 1700 | 9 | 19.92 | 0.05 | MgII, [NeV], [OII] | K,L | |
| 29/05/94 | f785LP | 8620 | 1700 | 9 | 17.86 | 0.03 | H, [OIII] | K,L | |||
| 3C266 | 1.272 | 15/03/95 | f555W | 5400 | 1800 | 9 | 21.53 | 0.06 | CII], [NeIV], MgII | H | |
| 15/03/95 | f702W | 6860 | 1700 | 9 | 20.81 | 0.07 | MgII, [NeV], [OII] | H | |||
| 15/03/95 | f814W | 7880 | 1800 | 9 | 20.26 | 0.03 | [NeV], [OII], [NeIII] | H | |||
| 3C267 | 1.144 | 11/06/94 | f702W | 6860 | 1700 | 9 | 21.06 | 0.09 | MgII, [NeV], [OII], [NeIII] | H | |
| 11/06/94 | f791W | 7790 | 1800 | 9 | 20.59 | 0.06 | [NeV], [OII], [NeIII] | H | |||
| 3C277.2 | 0.766 | 20/06/96 | f555W | 5400 | 2400 | 9 | 21.28 | 0.04 | MgII, [NeV], [OII] | I | |
| 20/06/96 | f814W | 7880 | 2400 | 9 | 19.51 | 0.03 | H, [OIII] | I | |||
| 3C280 | 0.996 | 23/08/94 | f622W | 6160 | 1700 | 9 | 20.80 | 0.05 | MgII, [NeV] | M | |
| 25/03/96 | f814W | 7880 | 2200 | 9 | 19.78 | 0.04 | [OII], [NeIII] | M | |||
| 3C289 | 0.967 | 19/03/95 | f622W | 6160 | 1700 | 9 | 21.45 | 0.10 | MgII, [NeV] | E | |
| 19/03/95 | f814W | 7880 | 1800 | 9 | 20.01 | 0.13 | [OII], [NeIII] | E | |||
| 3C324 | 1.206 | 27/04/94 | f702W | 6860 | 1700 | 9 | 21.24 | 0.07 | MgII, [NeV], [OII] | I,N | |
| 27/04/94 | f791W | 7790 | 1800 | 9 | 20.39 | 0.08 | [NeV], [OII], [NeIII] | I | |||
| 3C337 | 0.635 | 24/08/95 | f555W | 5400 | 1400 | 9 | 22.05 | 0.13 | MgII, [NeV], [OII], [NeIII] | E | |
| 24/08/95 | f814W | 7880 | 1400 | 9 | 19.57 | 0.04 | H, [OIII] | E | |||
| 3C340 | 0.775 | 25/04/94 | f555W | 5400 | 1700 | 9 | 21.71 | 0.07 | MgII, [NeV], [OII] | H | |
| 25/04/94 | f785LP | 8620 | 1700 | 9 | 19.37 | 0.09 | H, [OIII] | H | |||
| 3C352 | 0.806 | 22/02/95 | f555W | 5400 | 1700 | 5 | 21.79 | 0.10 | MgII, [NeV], [OII] | L,O | |
| 22/02/95 | f814W | 7880 | 1800 | 5 | 19.95 | 0.04 | H, [OIII] | O | |||
| 3C356 | 1.079 | 06/03/95 | f622W | 6160 | 1700 | 5 | 21.549 | 0.08 | MgII | P | |
| 06/03/95 | f814W | 7880 | 1700 | 5 | 20.439 | 0.07 | [NeV], [OII], [NeIII] | P | |||
| 3C368 | 1.132 | 18/06/94 | f702W | 6860 | 1700 | 9 | 19.9610 | 0.10 | MgII, [NeV], [OII], [NeIII] | Q,R | |
| 18/06/94 | f791W | 7790 | 1800 | 9 | 19.3410 | 0.10 | [NeV], [OII], [NeIII] | Q,R | |||
| 3C437 | 1.480 | 25/04/94 | f785LP | 8620 | 3400 | 9 | 21.26 | 0.28 | [NeV], [OII], [NeIII] | H | |
| 3C441 | 0.708 | 30/05/94 | f555W | 5400 | 1700 | 5 | 21.53 | 0.07 | MgII, [NeV], [OII], [NeIII] | D | |
| 30/05/94 | f785LP | 8620 | 1700 | 5 | 19.00 | 0.04 | H, [OIII] | D | |||
| 3C470 | 1.653 | 19/10/94 | f785LP | 8620 | 3500 | 5 | 21.69 | 0.38 | [NeV], [OII] | H |
During cycle 4, 24 of the galaxies were imaged with the Wide–Field Planetary Camera II (WFPC2) of the HST for one orbit, approximately 30 minutes, generally in each of two wavebands. During cycle 5, the remaining four galaxies were observed, and longer observations were made of three of the highest redshift () galaxies, to achieve comparable signal–to–noise ratios as for those at lower redshift. Details of the filters and exposures times are given in Table 1.
Each orbit’s observation was split into two exposures, and the first calibration steps were carried out separately on each, according to the standard Space Telescope Science Institute (STScI) calibration pipeline [Lauer 1989]. The two calibrated images were combined using the STSDAS task gcombine, removing well over 95% of the cosmic rays. The remainder of the cosmic ray events were distinguished from stars and galaxies by their radial profiles and by comparison of the images in the two filters. These were then removed individually, replacing each affected pixel with the mean value of those surrounding it.
The galaxy fluxes were, in general, obtained through a circular aperture of 9 arcsec diameter, although the presence of a companion galaxy within this aperture in a minority of sources led to a 5 arcsec diameter being adopted instead. The 9 arcsec diameter is sufficiently large as to enclose virtually all of the galaxy light. Subtraction of the background flux was performed using the average flux contained within four or more apertures of the same size placed on blank areas of the sky, rather than through an annulus surrounding the object, since the latter was often contaminated by companion objects. These sky apertures were placed as close as possible to the source, at different position angles relative to it, to avoid introducing any errors from residual gradients in the background flux. Conversion of the counts to WFPC2 magnitudes was carried out according to the prescription of Holtzman et al. [Holtzman et al. 1995]. These were then corrected for galactic extinction using the extinction maps of Burstein and Heiles [Burstein & Heiles 1982], and the results are presented in Table 1.
A number of effects contribute to the errors in the photometric magnitudes: (i) the Poisson noise of the detected counts; (ii) accurate determination of the mean sky background by measurement through different blank apertures; (iii) sky noise within the source aperture; (iv) uncertainties in the charge transfer efficiency of the WFPC2 CCD’s (, Holtzman et al. 1995); (v) uncertainties in the gain ratios of the WFPC2 chips (, Holtzman et al. 1995); (vi) errors in the photometry due to aperture extrapolation from the 0.5 arcsec diameter aperture used by Holtzman et al. to the apertures used in this paper. Of these, it is found that the sky noise and the sky subtraction are usually the dominant errors.
Throughout this paper where reference is made to colour differences between components within a radio galaxy, these are quoted as the difference between the two WFPC2 magnitudes. Conversion to ground–based magnitudes would introduce uncertainties which are greater than the differential colours under discussion. Readers who wish to make accurate conversions to ground–based magnitudes are referred to the tables in the paper by Holtzman et al. [Holtzman et al. 1995]. As a rough guide to these conversions, for a typical 3CR galaxy at redshift one the colour differential f555Wf814W is approximately equivalent to , f555Wf785LP to , f622Wf814W to , f555WK to , and f702WK to , although in each case the exact conversion depends upon the spectral energy distribution of the component being studied.
2.2 Radio observations
To complement the HST observations, the structures of the radio sources were mapped using the A–array configuration of the VLA at a frequency of 8.4 GHz, providing an angular resolution of 0.18 arcsec, comparable to that of the HST observations. The sources smaller than 40 arcsec were observed for 22–minutes using a bandwidth of 50 MHz, whilst the larger sources were observed for 44–minutes using a narrower bandwidth of 25 MHz, to avoid chromatic aberration problems. These data were taken on 27th February, 1994, shortly after the conversion from D to A array. The data from four of the antenna along the northern arm of the array were unusable due to pointing / baseline errors. The rms noise was typically of order Jy.
Radio sources larger than 10 arcsec in extent were also observed using the B–array of the VLA, so that their extended radio structures could be mapped; these exposures were for between 25 and 30 minutes, and were taken on the 11th and 14th July, 1994. Similarly, sources over 25 arcsec in size were observed in C–array configuration on 5th and 7th December, 1994. Sources were not observed using a particular array configuration if another observer had already mapped them at 8.4 GHz in that configuration, with an exposure time in excess of twenty minutes. Details are provided in Table 2.
The observations were made using standard VLA procedures. The bright sources 3C286 and 3C48 were used for primary flux calibration, whilst accurate phase calibration was achieved by frequent short observations of secondary calibrator sources within a few degrees of the target. The data were reduced using the aips software [Perley 1989] provided by the National Radio Astronomy Observatory (NRAO). The data from each different array were individually cleaned using the aips task mx, and then phase self–calibration was used to improve further the map quality. Care was taken that only real features were included in the self–calibration model. This self–calibrated dataset was once again cleaned, producing an improved map, and in a number of cases self–calibration was then repeated. One side–effect of self–calibration is that the position of the peak flux may be displaced by up to a pixel; this effect was minimised by oversampling the resolution by a factor of four, and by comparing the position of the self–calibrated peak with that of the original data. Discrepancies were corrected by shifting the self–calibrated data by hand, although none were greater than 0.2 arcsec.
| Source | Radio | VLA | Exp. | Flux dens. | Core |
| Size | Configs. | Time | 8.4 GHz | Flux | |
| [kpc] | [min] | [mJy] | [mJy] | ||
| (1) | (2) | (3) | (4) | (5) | (6) |
| 3C13 | 246 | A,B | 22,29 | 212 | 0.18 |
| 3C22 | 208 | A | 22 | 339 | 7.02 |
| 3C34 | 372 | A,C | 44,30 | 208 | 1.20 |
| 3C41 | 197 | A,B | 22,25 | 975 | 0.57 |
| 3C49 | 7 | A | 22 | 493 | |
| 3C65 | 155 | A,B | 22,25 | 427 | 0.52 |
| 3C68.2 | 203 | A,B | 22,29 | 84 | 0.13 |
| 3C217 | 110 | A,B | 22,27 | 247 | |
| 3C226 | 263 | A,C | 22,19 | 288 | 2.83 |
| 3C239 | 102 | A,B | 22,27 | 160 | 0.44 |
| 3C241 | 7 | A | 22 | 164 | |
| 3C247 | 113 | A,B | 22,27 | 492 | 4.21 |
| 3C252 | 488 | A | 44 | 76 | 1.79 |
| 3C265 | 646 | A | 44 | 358 | 1.68 |
| 3C266 | 39 | A | 22 | 150 | |
| 3C267 | 329 | A,B,C | 22,27,19 | 435 | 1.41 |
| 3C277.2 | 432 | A | 44 | 148 | 0.36 |
| 3C280 | 117 | B | 27 | 968 | |
| 3C289 | 89 | A,B | 22,27 | 356 | 1.37 |
| 3C324 | 96 | A | 22 | 228 | |
| 3C337 | 342 | A,B,C | 44,27,30 | 767 | |
| 3C340 | 371 | A,B,C | 44,27,30 | 811 | 0.83 |
| 3C352 | 102 | B | 25 | 295 | 3.18 |
| 3C356 | 624 | B,C | 25,30 | 204 | 0.22 |
| 3C368 | 73 | A | 22 | 80 | |
| 3C437 | 318 | A,B,C | 22,25,30 | 543 | |
| 3C441 | 266 | A,C | 22,30 | 380 | |
| 3C470 | 211 | A,B | 22,29 | 276 | 1.20 |
The uv data from the different array configurations were then merged by self–calibrating the lower resolution uv data with that of the highest resolution array. A combined map was produced and the data were once again self–calibrated. The final map was then made using a hybrid combination of the aips tasks mx and the maximum entropy technique, vtess [Leahy & Perley 1991]. Whilst the clean method is very good for deconvolving point sources, or sources which can reasonably be described as a combination of point sources, it is not particularly effective at cleaning diffuse extended structure. On the other hand, vtess uses a maximum entropy technique and tends to produce much smoother maps than mx. It struggles to deal with bright point–like sources of emission such as the cores and the hot–spots. The technique used was therefore to clean the map to remove the brighter point–like emission, then to use vtess for the remaining diffuse emission, and finally to add back the clean components to produce a final map of the source.
2.3 Infrared observations
Infrared imaging of the galaxies was carried out using IRCAM3 of UKIRT on the 6th to 8th August 1994 and the 2nd to 4th February 1995. IRCAM3 is an infrared camera for the 1 to 5 m waveband, and incorporates a SBRC InSb array, with 0.286 arcsec pixels. All the galaxies were observed in the K–band (m), generally for 54 minutes, and the majority were also observed at m through the J waveband (see Table 3). For the August 1994 run, the first two nights and half of the final night were photometric, and the seeing was typically about 1 arcsec. Short service observations were later taken of those sources observed during the non–photometric conditions of the third night, to provide photometric magnitudes. Conditions were photometric throughout the February 1995 run, but the observations were hampered by high wind speeds. The seeing therefore varied from about 0.8 to 1.3 arcsec, depending upon the orientation of the telescope, and was frequently elliptical with its long axis aligned roughly east–west. A proportion of this ellipticity may be attributable to RA judder of the telescope. Those images which were affected by elliptical seeing are indicated in Table 3.
The observations were made using a 9 point jittering technique, with offsets of 15 arcseconds between each 1 minute exposure. After subtraction of a dark frame, and removal of known bad pixels, the images were median filtered to construct an accurate sky flat–field. The nine flat–fielded images were then accurately registered using the peak positions of two or more bright unresolved objects visible on all images, and were summed. This provided a mosaiced image of approximately 100 100 arcsec2, although the highest signal–to–noise ratio is only available in the central 45 45 arcsec2. In general six such mosaiced images were made, enabling accurate removal of cosmic ray events before these were registered and summed. These images were aligned with the HST data by using several unresolved sources visible on both images. In most cases this was possible to an accuracy significantly better than one pixel size, 0.286 arcsec.
Flux calibration was achieved by frequent observations of the UKIRT Faint Standards. Photometry was performed through either a 9 arcsec or 5 arcsec diameter aperture, matching the apertures adopted for the HST data in Table 1. As with the HST observations, the background flux was measured using apertures placed in empty regions of sky, within the central 45 arcsec square. Accurate subtraction of the background flux is the main source of the quoted errors in the photometric magnitudes, presented in Table 3. The extinction maps of Burstein and Heiles (1982) were used to correct for galactic extinction.
| Source | K–Band | J–Band | |||||||||
| Observ. | Exp. | Ap. | Mag.1 | Error | Seeing | Observ. | Exp. | Mag.1 | Error | Seeing | |
| Date | Time | Diam | Date | Time | |||||||
| [min] | [′′] | [min] | |||||||||
| (1) | (2) | (3) | (4) | (5) | (6) | (7) | (8) | (9) | (10) | (11) | (12) |
| 3C13 | 06/08/94 | 54 | 5 | 17.52 | 0.06 | o | 07/08/94 | 54 | 18.53 | 0.06 | o |
| 3C22 | 08/08/94 | 27 | 9 | 15.40 | 0.15 | e | 08/08/94 | 27 | 16.01 | 0.20 | e |
| 3C34 | 06/08/94 | 54 | 5 | 16.43 | 0.05 | o | 07/08/94 | 54 | 18.15 | 0.06 | o |
| 3C41 | 07/08/94 | 36 | 9 | 15.68 | 0.04 | o | 08/08/94 | 27 | 18.47 | 0.25 | o |
| 3C49 | 08/08/94 | 27 | 9 | 16.15 | 0.15 | o | — | — | — | — | — |
| 3C65 | Service | 54 | 9 | 16.59 | 0.07 | o | 04/02/95 | 54 | 18.41 | 0.06 | o |
| 3C68.2 | 07/08/94 | 54 | 9 | 17.49 | 0.12 | se | 04/02/95 | 54 | 19.15 | 0.18 | o |
| 3C217 | 02/02/95 | 54 | 9 | 17.52 | 0.08 | o | 04/02/95 | 45 | 18.65 | 0.06 | se |
| 3C226 | 03/02/95 | 54 | 9 | 16.52 | 0.05 | o | 04/02/95 | 45 | 18.05 | 0.05 | o |
| 3C239 | 02/02/95 | 54 | 5 | 17.83 | 0.06 | o | 04/02/95 | 27 | 18.96 | 0.08 | o |
| 3C241 | 03/02/95 | 54 | 9 | 17.45 | 0.08 | o | 04/02/95 | 27 | 18.86 | 0.10 | o |
| 3C247 | 04/02/95 | 54 | 5 | 15.96 | 0.02 | se | — | — | — | — | — |
| 3C252 | 02/02/95 | 54 | 9 | 17.32 | 0.07 | o | — | — | — | — | — |
| 3C265 | 02/02/95 | 54 | 9 | 16.03 | 0.04 | se | 03/02/95 | 45 | 17.20 | 0.05 | se |
| 3C266 | 04/02/95 | 54 | 9 | 17.65 | 0.09 | o | — | — | — | — | — |
| 3C267 | 03/02/95 | 54 | 9 | 17.21 | 0.05 | o | 04/02/95 | 45 | 18.74 | 0.06 | o |
| 3C277.2 | 03/02/95 | 54 | 9 | 16.96 | 0.05 | e | 04/02/95 | 18 | 18.32 | 0.07 | e |
| 3C280 | 02/02/95 | 54 | 9 | 16.70 | 0.04 | o | 04/02/95 | 45 | 18.07 | 0.05 | o |
| 3C289 | 02/02/95 | 54 | 9 | 16.66 | 0.07 | o | 04/02/95 | 18 | 18.19 | 0.06 | o |
| 3C324 | 06/08/94 | 54 | 9 | 16.99 | 0.06 | o | 07/08/94 | 63 | 18.58 | 0.11 | o |
| 3C337 | 03/02/95 | 45 | 9 | 16.57 | 0.05 | se | 03/02/95 | 27 | 18.08 | 0.05 | o |
| 3C340 | 06/08/94 | 54 | 9 | 16.91 | 0.08 | e | 07/08/94 | 45 | 18.30 | 0.09 | se |
| 3C352 | 08/08/94 | 45 | 5 | 16.92 | 0.05 | se | — | — | — | — | — |
| 3C356 | 08/08/94 | 54 | 5 | 17.502 | 0.06 | o | — | — | — | — | — |
| 3C368 | 06/08/94 | 54 | 9 | 17.033 | 0.15 | se | 07/08/94 | 54 | 18.433 | 0.15 | e |
| 3C437 | 08/08/94 | 54 | 9 | 17.74 | 0.20 | se | — | — | — | — | — |
| 3C441 | 06/08/94 | 54 | 5 | 16.42 | 0.04 | e | 07/08/94 | 54 | 18.00 | 0.06 | se |
| 3C470 | 08/08/94 | 45 | 5 | 18.02 | 0.15 | o | — | — | — | — | — |
3 Images of the radio galaxies
In this section we present images of the galaxies at optical, infrared and radio wavebands. Unless extra information is provided by displaying the galaxy as observed through both HST filters separately, we have combined the two images. Overlaid upon these HST images are contours of the radio emission, as observed in our VLA observations. Adjacent to the HST images, and displayed at the same scale, are the infrared images: in cases where the infrared J and K–band morphologies are similar we display only the K–band image.
Registering the radio and optical images could not be carried out with high accuracy because of uncertainties in the alignment of the radio and optical reference frames. For sources in which there was a detection of a radio core, the frames were aligned by assuming that the centre of the infrared images lay directly over the radio core. Unlike the optical images, which could not be used for this procedure because of the possibility of dust extinction affecting the central peak, the infrared images are sharply peaked towards the centre of the galaxy. For the sources without a radio core, the absolute positioning of the HST and UKIRT frames was found using one or more unsaturated stars which were present on the frames, and also present in the APM database [Maddox et al. 1990]; in general at least four such objects were available. Then, the optical and radio images were overlaid assuming that the two reference frames were accurately registered. The astrometric errors introduced in this procedure are estimated to be less than about 1 arcsecond. The forthcoming release of the Hipparcos data should enable this problem to be somewhat alleviated in the future.
The sources are presented in numerical (right ascension) order, and important details about each source are provided. As a guide to interpreting the HST images, it is a useful rule of thumb that a standard elliptical galaxy at a redshift of one possesses a very red colour, and will have a low-surface brightness in optical (rest–frame ultraviolet) images. Only regions of high surface brightness will stand out prominently in the images [Giavalisco et al. 1996, Dickinson et al. 1996]. As a result, if the 3CR radio galaxies are standard elliptical galaxies, little structure would be observed in the HST images; a good example of this is the case of 3C34 (see below) at redshift , which shows very little optical activity, is diffuse, and is barely visible in the bluer of the HST images. By contrast, the majority of the HST images of the 3CR galaxies show a wealth of bright structures.
3C13
![[Uncaptioned image]](/html/astro-ph/9707337/assets/x3.png)
![[Uncaptioned image]](/html/astro-ph/9707337/assets/x4.png)
![[Uncaptioned image]](/html/astro-ph/9707337/assets/x5.png)
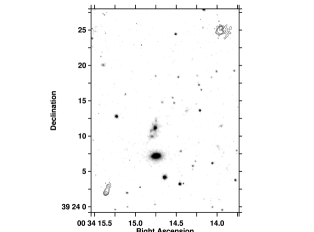
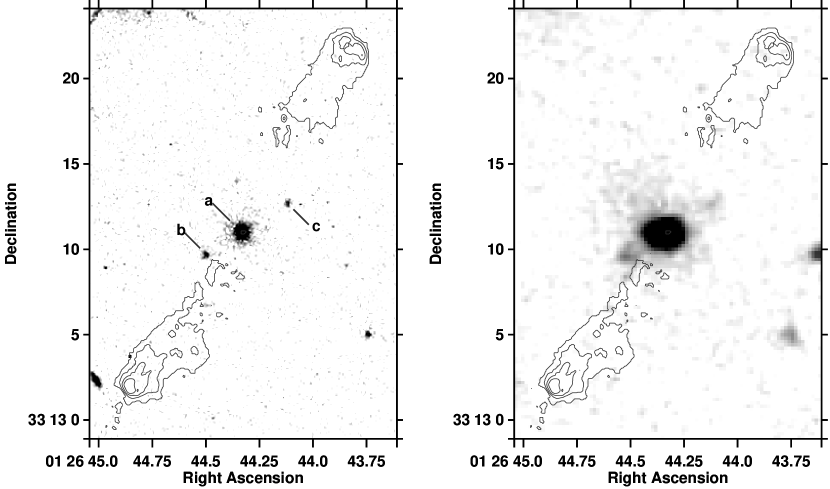
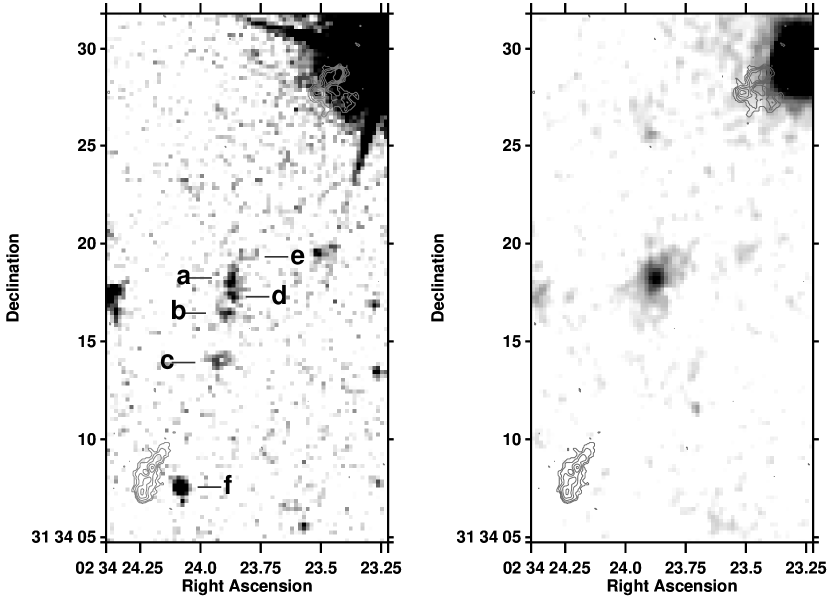
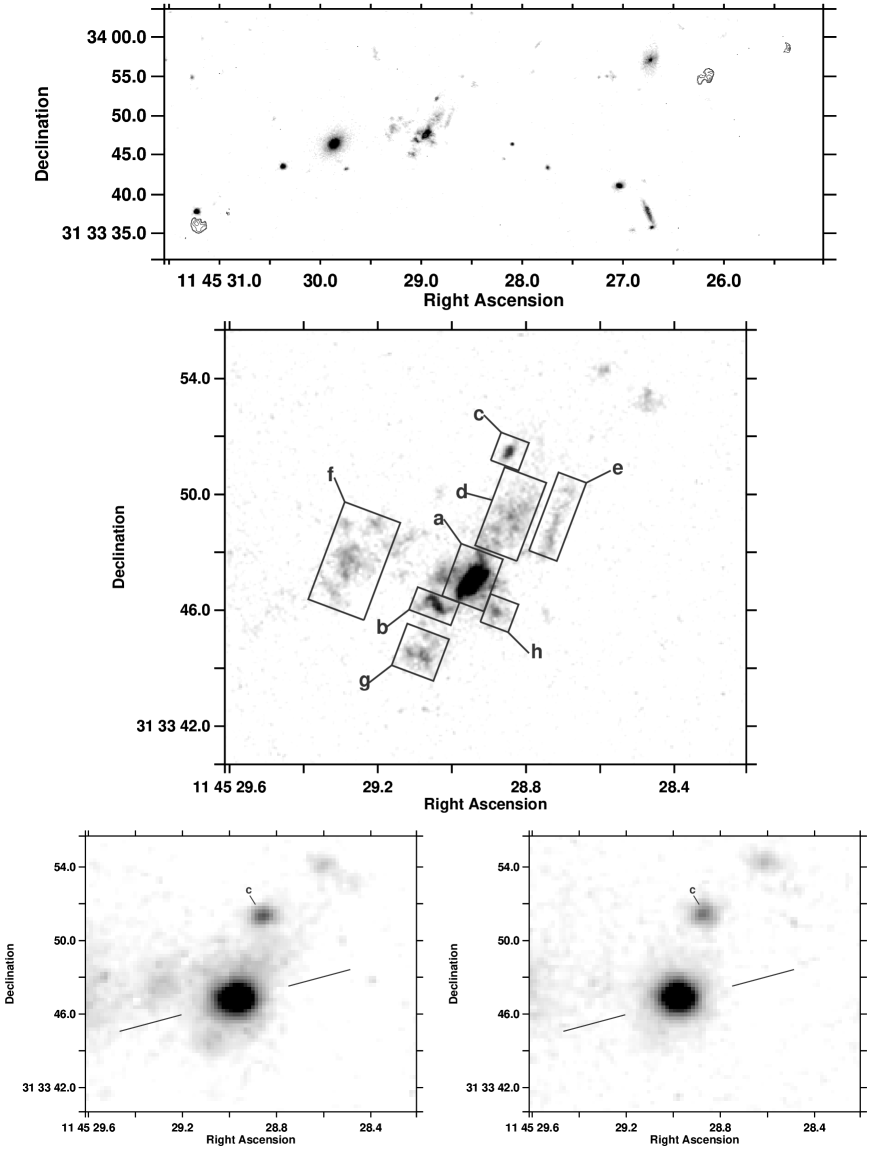
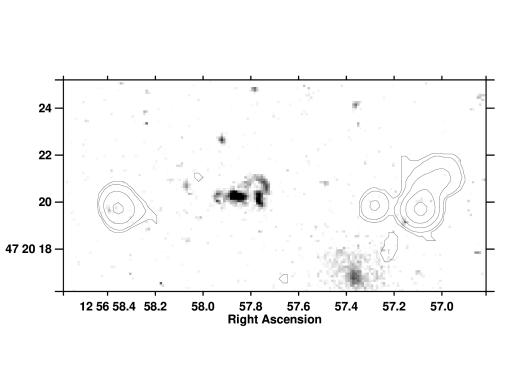
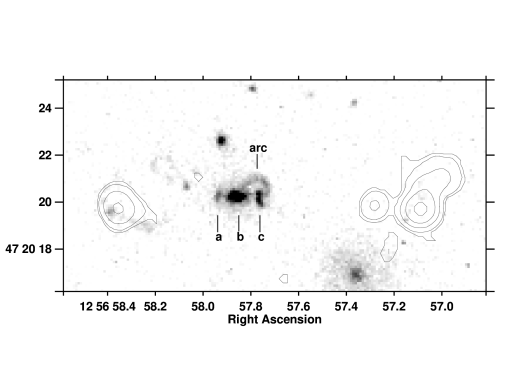
The HST image of the host galaxy associated with 3C13 (Figure 2a,b), at redshift , consists of a bright central component (‘a’) overlying diffuse emission elongated along the radio axis. A second, fainter, component (‘b’) lies just over an arcsec to the south, with a fainter component (‘e’) just to the north of it. A fourth component (‘c’) lies 0.5 arcsec to the north of ‘a’. [NB. For consistency we have labelled the components following Le Fèvre et al. [Le Fèvre et al. 1988b]. We do not detect anything corresponding to their putative component ‘d’. Our component ‘e’ was not detected by them]. The galaxy lying 4 arcsec to the south is a foreground elliptical galaxy at . Le Fèvre et al [Le Fèvre et al. 1988b] noted that 3C13 is optically three magnitudes more luminous than a brightest cluster galaxy redshifted to that distance, and suggested that this may be due to two factors: firstly, the foreground elliptical galaxy may gravitationally amplify 3C13 by more than a magnitude; secondly, they suggested that component ‘a’ may be a foreground companion of this elliptical galaxy, and the surrounding components ‘b’ and ‘c’ could be gravitationally lensed images of the host radio galaxy at redshift . Comparison of the morphology of these regions as seen with the HST, together with the smooth, barely elongated, emission in the infrared images makes the second possibility unlikely. In addition, the fact that the K–magnitude of 3C13 is typical of the other 3CR galaxies at that redshift suggests that the optical brightening is instead due to a flat spectrum aligned component.
Using Keck spectro-polarimetry, Cimatti et al. [Cimatti et al. 1997] have shown that the optical continuum of 3C13 is polarised, with the orientation of the polarisation being roughly perpendicular to the axis of the ultraviolet continuum. The fractional polarisation remains roughly constant, at the 5 to 10% level, from observed wavelengths of 4000 to 9000Å. This polarised emission, associated with light scattered from an obscured quasar nucleus, effective rules out a gravitational lensing hypothesis for the morphology of this source.
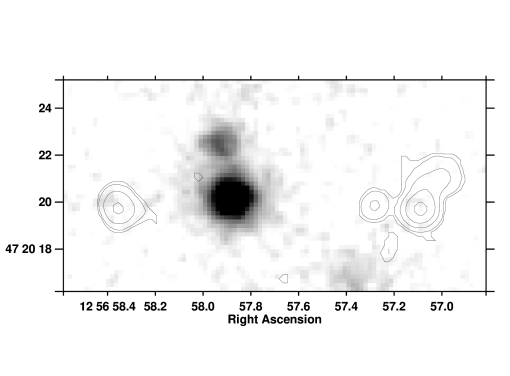
The UKIRT J–band image (Figure 2c) shows a slight extension along the radio axis and a faint emission region corresponding to the southern component ‘b’, although this is much less pronounced than in the optical image, and is not detected at all in the K–band image (Figure 2d). It is interesting that the elongation of the J–band image is more precisely aligned along the radio axis direction than is the optical emission. Near–infrared spectrophotometry by Rawlings et al. [Rawlings et al. 1991] has shown that the [OIII] 5007 line is strong in this source ( W m-2), and contributes a significant fraction () of the total J–band flux. This line emission may be partially responsible for the J–band alignment.
3C22
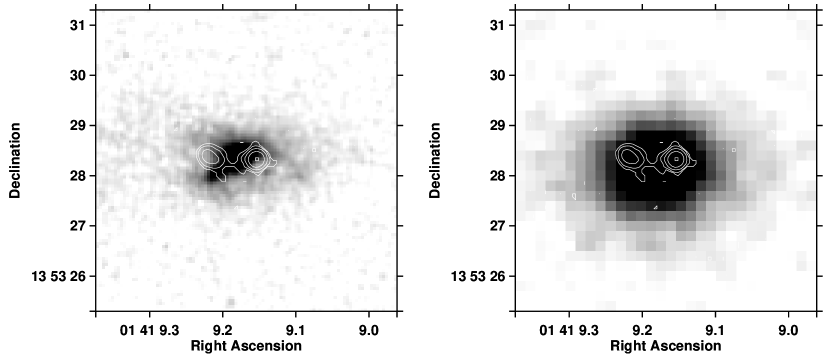
According to orientation–based unification schemes for 3CR radio sources [Barthel 1989], radio galaxies and quasars could represent the same class of object viewed at different angles to the line of sight. In these schemes, quasars have their radio axis orientated within of the line of sight, enabling the central active galactic nucleus and broad–line regions to be seen, whilst radio galaxies are orientated within of the plane of the sky, and have their central regions obscured by a torus of material. Dust obscuration of these central regions will be less severe at infrared wavelengths and so, assuming that the unification model is correct, any broad emission lines or compact central objects may be visible in the radio galaxies at these wavelengths.
Recently, broad H emission has been detected from 3C22 with FWHM km s-1 [Economou et al. 1995, Rawlings et al. 1995]. Coupled with the nucleated appearance of the K–band image of this source, and the fact that its K–band magnitude is magnitudes brighter than the mean K– relation, this has led to suggestions that this source contains a reddened quasar nucleus, perhaps observed close to the radio galaxy — quasar divide [Dunlop & Peacock 1993, Economou et al. 1995, Rawlings et al. 1995]. The radio structure of the source supports this hypothesis: the radio core is brighter than that of any other source in our sample (see Table 2), and it is one of the few radio galaxies at this redshift for which a radio jet has been detected [Fernini et al. 1993]; detection of bright cores and jets is common in quasars even at high redshift.
Our K–band image (Figure 3b) also shows 3C22 to be compact, although it is not totally unresolved. Unlike the other galaxies in the sample, 3C22 is not well fitted by a de Vaucouleurs profile, , , but can be fitted using the combination of a de Vaucouleurs profile and a point source (see Paper II). Even in the HST image (Figure 3a), the galaxy is much more nucleated than other galaxies in the sample, but it does show two deviations from circular symmetry. The first is a slight extension of the central bright component, just to the south of west and misaligned by about 30 degrees from radio emission extending from the core towards the western hot–spot [Fernini et al. 1993]. The second is what appears to be a small companion just to the south of the host galaxy and, again, misaligned relative to the radio axis. If 3C22 is indeed a reddened quasar, the nature of these two components is of great interest. The f622Wf814W colours of the western and southern extensions are and respectively, as compared to the central bright component which has f622Wf814W. The western extension therefore seems slightly bluer than the host galaxy/quasar, and the southern extension slightly redder, although at low significance.
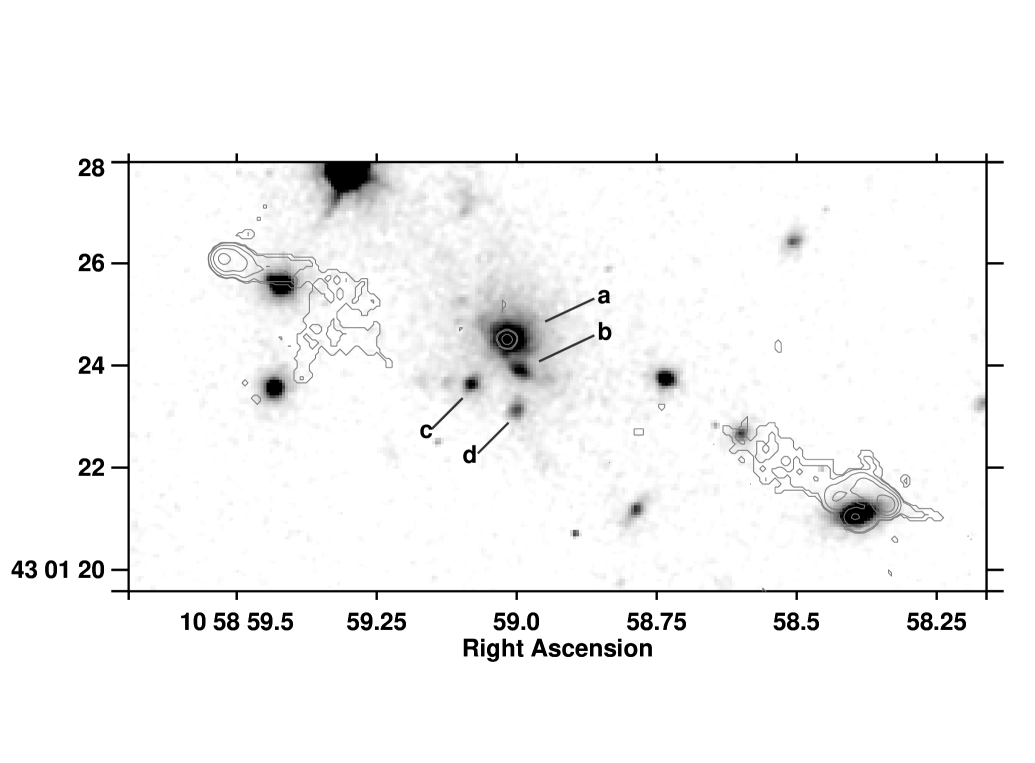
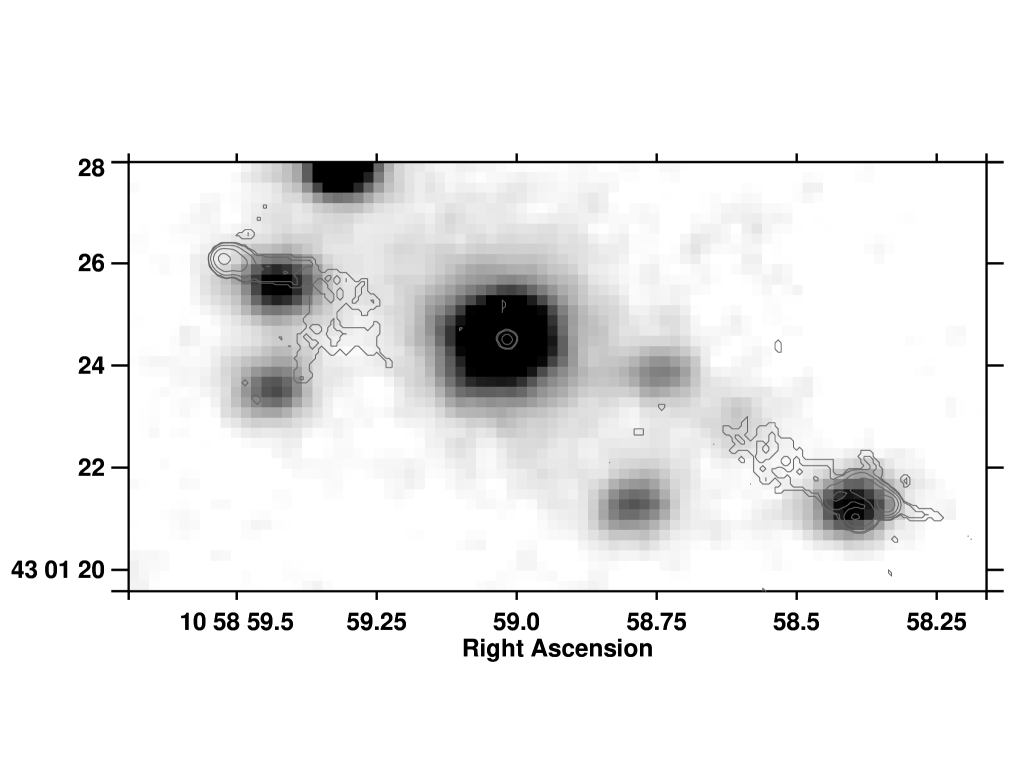
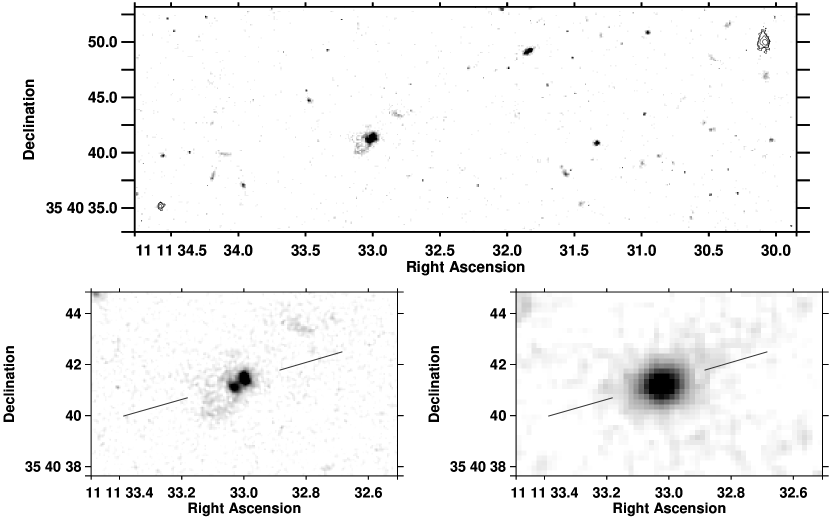
3C34
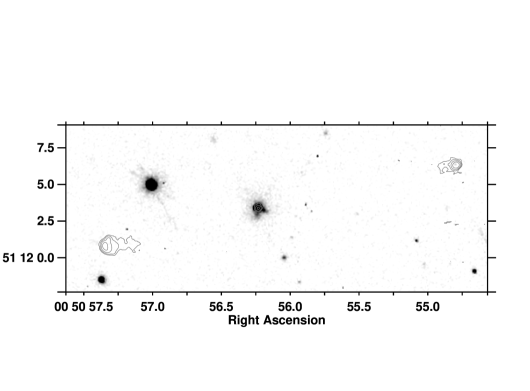
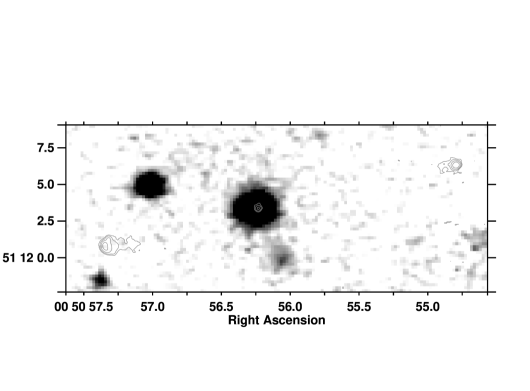
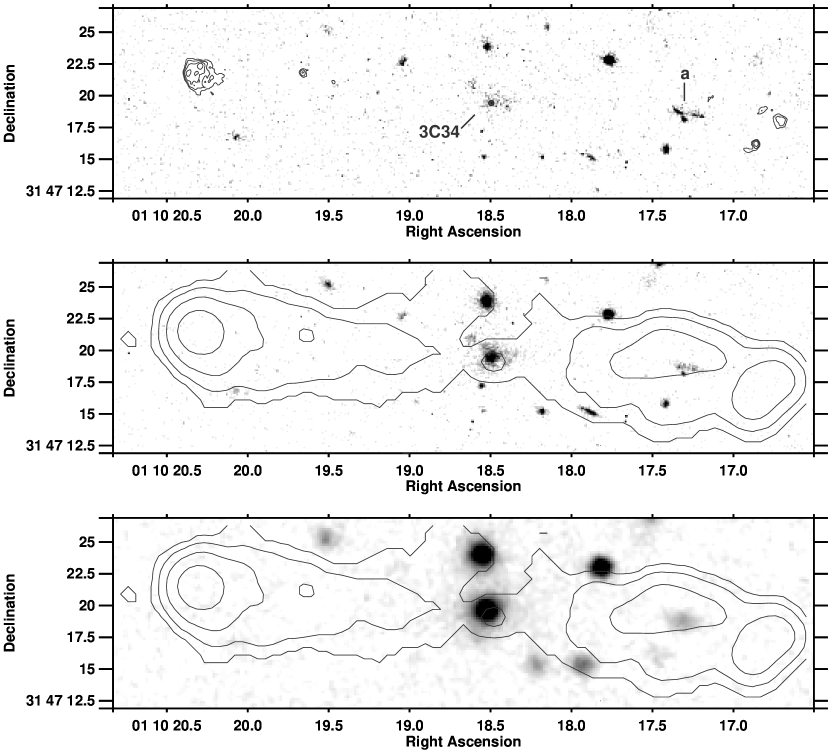
This galaxy lies near the centre of a compact cluster [McCarthy 1988] at redshift . The galaxy is one of the reddest in the sample, and is barely visible in the HST image obtained through the f555W filter (Figure 4a). In the f785LP filter image (Figure 4b) it appears as a bright central galaxy with an extensive halo and faint companions.
Of particular interest in this field is the emission region at RA: 01 10 17.25, Dec: 31 47 18 (J2000), labelled object ‘a’. The f555W filter image clearly shows the presence of two very long, narrow regions of optical emission along the radio axis, with a ‘blob’ of emission just to the south of them. This image has been overlaid with the A–array VLA data so as not to obscure this region, and to make it clear that these point towards the northern component of a double hotspot in the western lobe of this source. The other two images are overlaid with the C–array map to show the more extended radio structure.
These knots are significantly bluer than the central radio galaxy: their combined f555WK colour is , compared with f555WK for 3C34. The cause of the elongation and blue colour of this region has been discussed in detail by Best et al. [Best et al. 1997a], who concluded that the most likely scenario is that it is due to a massive burst of star formation induced by the passage of the radio jet through a galaxy in the cluster surrounding 3C34.
Support for this object being a cluster galaxy in which the radio jet has induced activity of some kind comes from a number of observations. Firstly, we can use the infrared JK colour as an indicator of the redshift of the galaxy, since this colour index is dominated by the old stellar population (eg. Best et al. 1997a,b) and is a fairly strong function of redshift out to . In Figure 5 we plot the redshift dependence of this colour, obtained by redshifting the spectral energy distribution of a present–day elliptical galaxy with no evolution (dashed line), and with passive evolution (solid line), by which we mean that it is assumed that the elliptical galaxy formed at and that the stellar population has been passively evolving since then. Note that although the radio galaxies themselves do not follow this plot beyond a redshift , instead becoming bluer than the expected passive evolution line, this is due to the contribution of the aligned ultraviolet emission and the H and [OIII] 5007 emission lines to the J–band flux density at these redshifts: for ‘ordinary’ cluster galaxies, these effects will be small, and so the JK colour remains dominated by the old stellar population. Object ‘a’ has a JK colour of , which is consistent with it lying at the same redshift as 3C34 (see Figure 5).
Further evidence in support of this hypothesis comes from the radio structure of the source. The enhanced region of radio emission lying to the north of object ‘a’ (Figure 4b, Johnson et al. 1995) has a radio spectral index less steep than that of the rest of the radio lobe, and which increases away from the hotspot, indicating a region of rapid backflow from the hotspot [Blundell 1994]. This backflow loops around to the north of object ‘a’ rather than passing though it, consistent with object ‘a’ lying within the radio lobe, and the relativistic electrons flowing out from the hotspot avoiding this region of higher gas density. A map of the radio depolarisation properties of 3C34 between 6cm and 21cm shows that galaxy ‘a’ corresponds precisely to the position and morphology of a ‘depolarisation silhouette’, that is, a region in which the radio depolarisation, due to Faraday depolarisation, is significantly higher than in the surrounding lobe [Johnson et al. 1995]. Johnson et al. concluded that the most likely cause of the depolarisation was that it was due to Faraday depolarisation by the gas within a cluster galaxy lying in front of the lobe, but it would also be consistent with the galaxy lying within the lobe.
A combination of an old stellar population together with a short–lived starburst induced by the radio jet provide an excellent fit to the spectral energy distribution of this source, whilst other alignment mechanisms can be shown to be of little importance. The reader is referred to Best et al. [Best et al. 1997a] for a much fuller discussion of 3C34.

3C41
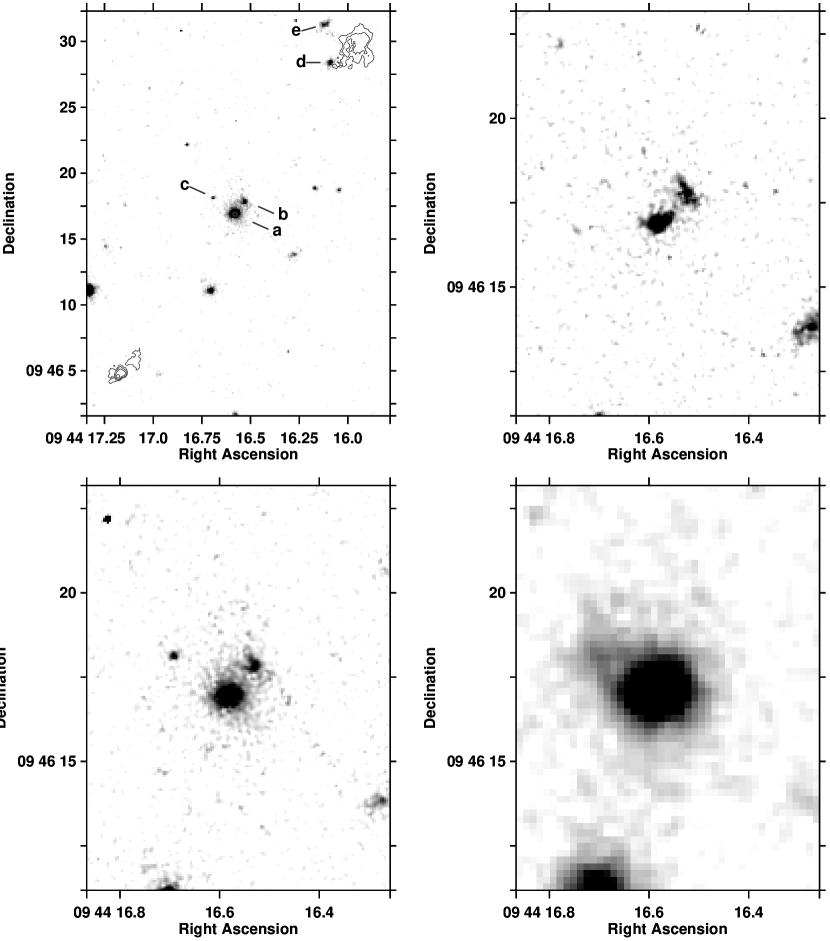
The galaxy 3C41, at redshift , appears to be almost totally symmetrical in the HST image (Figure 6a, galaxy ‘a’). Emission is also seen from two components, one on either side of the galaxy to the ESE (‘b’) and the WNW (‘c’), approximately 2.5 arcsec away. Whether or not these are associated with the radio galaxy is unclear. They do not appear in an image of the source centred on the rest–frame [OII] 3727 line [McCarthy 1988], but they are faint and so this does not exclude them from being at the same redshift. The two components ‘b’ and ‘c’ are also visible in the K–band image (Figure 6b), and have f555WK colours of and respectively, over a magnitude bluer than the host radio galaxy which has f555WK. This suggests that, if they are associated with the radio source, they may be optically active in some way, although they are misaligned by about 25∘ from the radio axis. Apart from these two companions, the optical emission is unremarkable.
The K–band image shows a bright central nucleus, and the K–magnitude of 3C41 is significantly brighter than the mean K relation of the 3CR galaxies. The infrared radial intensity profile suggests the presence of an unresolved quasar component (see Paper II). There is also, however, some evidence for a faint halo in the K–band, particularly to the north–east. Eisenhardt and Chokshi [Eisenhardt & Chokshi 1990] also found significant emission out to a radius of at least in their K–band image of this galaxy.
The radio contours indicate the presence of a weak radio jet pointing towards the south–eastern hot–spot, a feature which is rare amongst these high redshift radio galaxies.
3C49
3C49, at redshift , has a radio size of only 7 kpc, and is one of two compact steep spectrum radio sources in the sample. The HST image, shown in Figure 7a, shows only a single bright component, plus diffuse emission extending beyond the radio lobes. The bright central emission is misaligned from the radio axis by about 20 degrees, but the more extended fainter emission is orientated within five degrees of the axis of the radio emission. The infrared image (Figure 7b) shows that the radio emission lies well within the envelope of the host galaxy. In the infrared waveband, the galaxy shows a slight elongation along the radio axis.
This radio source has been mapped at high angular resolution by a number of authors. Fanti et al. [Fanti et al. 1989] detected a weak central component, positioned approximately two–thirds of the way from the eastern to the western hotspot. This has a flux density of about 5 mJy at a wavelength of 6 cm, and possesses a flat spectrum. Its identification as the radio core was confirmed by later observations [van Breugel et al. 1992, Sanghera et al. 1995]. Fanti et al. [Fanti et al. 1989] also derived an age for the source of years, with a corresponding hotspot advance speed of 0.05 to , based on radio spectral ageing. For radio spectral ageing, the radio spectrum is interpreted in terms of an ageing population of electrons, and the break frequency of the synchrotron radiation can be used to estimate the time elapsed since the electrons were last accelerated [Pacholczyk 1970, Liu et al. 1992]. This time lapse is generally found to be shortest at the hotspots, and increases along the lobe towards the central regions of the source. The spectral age of the electrons in the oldest regions of the lobe provides an estimate of the age of the radio source. The age estimate for this source is consistent with the source being young, rather than its small size being due to a slower advance speed caused by a denser surrounding medium.
The western hotspot is brighter, more compact, and closer to the nucleus than its eastern counterpart, which Fanti et al. [Fanti et al. 1989] ascribe to the interaction of this component with denser material, requiring a clumpy interstellar medium. Van Breugel et al. [van Breugel et al. 1992] note that both lobes are almost totally depolarised at 15 GHz, consistent with Faraday depolarisation by the interstellar medium of the galaxy.
3C65
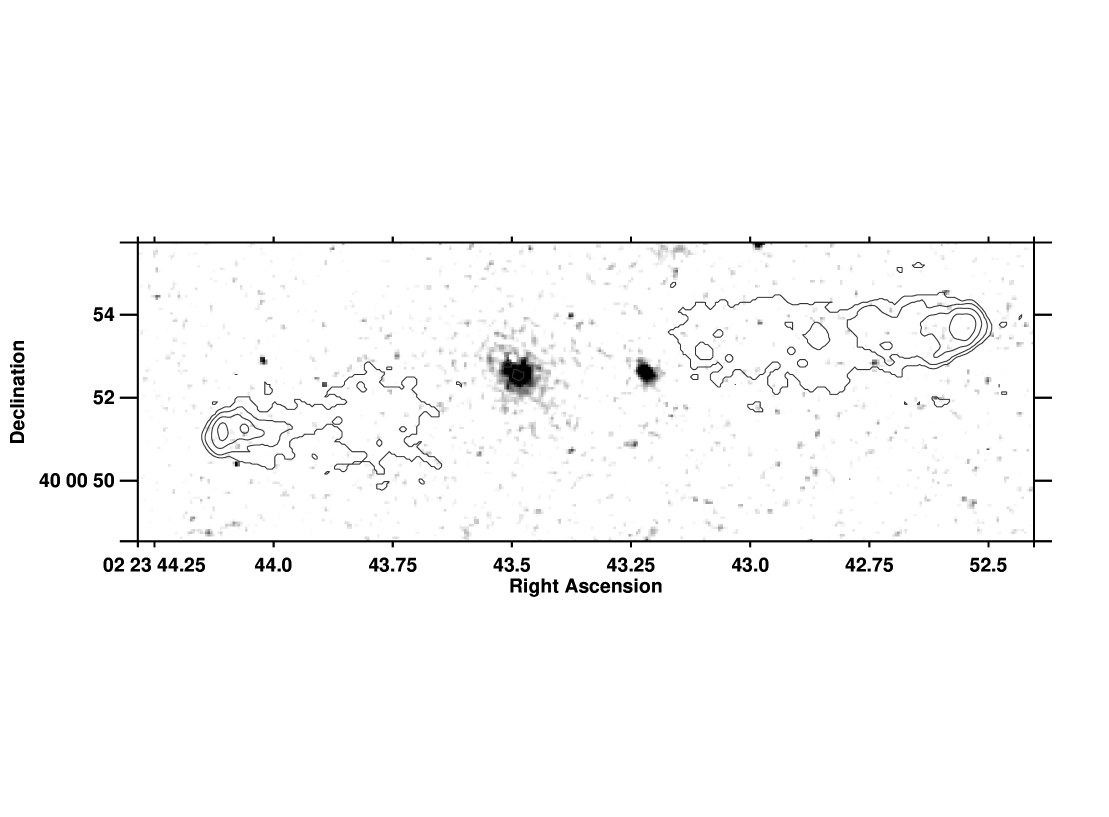
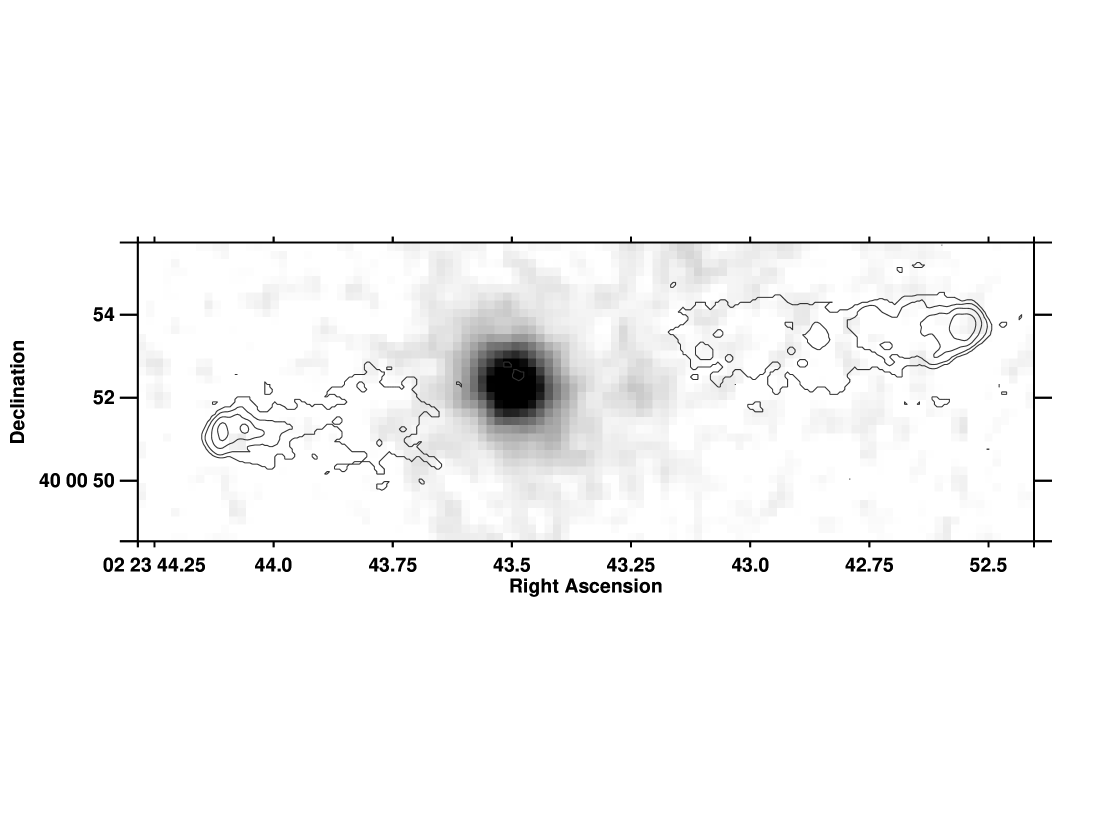
3C65 (, RA: 02 23 43.47, Dec: 40 00 52.2, Figure 8) is one of the most passive galaxies in the sample. The host galaxy is redder than most of the 3CR sample (; f555Wf814W = ) and, apart from the presence of a bluer (f555Wf814W = ) companion galaxy 3 arcsec to the west along the radio axis, it shows little evidence of any optical activity associated with the radio phenomenon. This western companion appeared as two components, separated north–south, in the ground–based image of Le Fèvre and Hammer [Le Fèvre & Hammer 1988]; the HST image does not show multiple components, but does show a NE–SW extension.
Recently, Lacy et al. [Lacy et al. 1995] have claimed the presence of a point–like emission source at the centre of the infrared image, which they have associated with an obscured quasar nucleus. Rigler and Lilly [Rigler & Lilly 1994] compared the infrared profile of the galaxy with a de Vaucouleurs law taking into account the effects of seeing, and found a satisfactory fit without the need for an unresolved emission source. They concluded that any unresolved component would make only a small contribution to the total infrared flux from the galaxy.
Since the HST image of this galaxy does not appear to be dominated by active blue emission, and does not suffer from the effects of seeing, it can be used to test whether or not the light profile of the underlying galaxy follows a de Vaucouleurs profile. In Figure 9a, the radial intensity profile of 3C65 as seen in the HST image is compared with a de Vaucouleurs distribution. A very good match is obtained, consistent both with the presence of a giant elliptical galaxy and with the suggestion that there is little optical activity.


We can use this fit to provide a more accurate estimate of the contribution any point source might make to the infrared image of 3C65. In Figure 9b we plot the radial intensity profile of the K–band image of the galaxy. The predicted de Vaucouleurs fit for a standard spherically symmetrical giant elliptical galaxy with the characteristic radius calculated above (solid line), and the profile of a point source (dashed line), taking into account the effects of 1.3 arcsec seeing, are also plotted. It can be seen that the galaxy profile is in reasonable agreement with the de Vaucouleurs law; the excess of emission at large radii may be associated with an extended halo around the galaxy, visible in Figure 8b, and characteristic of that seen around cD galaxies (see Paper II for a further discussion of this). The addition of a point source would not improve the fit. We agree with Rigler & Lilly (1994) that there is little evidence of a nuclear contribution to the K–band emission of 3C65.
Detection of a 4000Å break in the off-nuclear spectrum by Lacy et al. [Lacy et al. 1995] and by Stockton et al. [Stockton et al. 1995] indicates the presence of an old (3–4 Gyr) stellar population in this galaxy, corresponding to a formation redshift of . This old stellar population is seen relatively uncontaminated in the HST image. Note that the fit of the de Vaucouleurs profile is generally not very good for the HST images of the galaxies in our sample. The infrared images, however, can be well fitted using a de Vaucouleurs profile (see Paper II). This suggests that the old stellar population is present in most, if not all, of the galaxies in the sample, but that in the HST images it is generally swamped by emission induced by the radio activity. We discuss these results in more detail in Paper II.
3C68.2
At redshift , 3C68.2 is one of the most distant galaxies in the sample. To improve the signal–to–noise ratio of the HST data, the pixels have been summed in blocks and then smoothed with a 0.2 arcsec Gaussian; consequently the resolution of the image shown in Figure 10a, is slightly lower than that of most of the HST images, but is still sufficient to show that 3C68.2 is composed of a string of 4 or 5 bright components, misaligned with respect to the radio axis by slightly over 10 degrees, and extending over 50 kpc. Components ‘a’, ‘b’ and ‘c’ correspond to those detected by Le Fèvre et al. [Le Fèvre & Hammer 1988]; in addition to these, we note the presence of an emission knot, ‘d’, between ‘a’ and ‘b’, and a low signal–to–noise detection of emission to the north of ‘a’ — component ‘e’. We see no evidence of emission to the south of knot ‘c’, as seen by Le Fèrve et al., although this may be due to the lower signal–to–noise in our image.
The UKIRT images show none of this complexity. The K–band image (Figure 10b) is also somewhat extended and aligned along the radio axis (even more closely than the optical image), but component ‘c’, in particular, is not detected in either the J or K–band. It is unclear whether the brightest two emission regions in the HST image (‘a’ and ‘d’), which lie towards the centre of the infrared emission, are separate components or whether they are a single emission region with an obscuring dust lane running across the centre.
Another component, ‘f’, lies close to the southern radio hotspot. This object appears bright on the HST image (f785LP), but is not detected at all in the K–band (K ). Its f785LPK colour is therefore , which when compared to the central galaxy (f785LPK ) indicates that object ‘f’ must be very blue. It is quite conceivable that this object lies at the same redshift as 3C68.2, its blue colour being due to scattering of light from an obscured active nucleus, or to line emission, or to star formation induced by shocks associated with the nearby radio hotspot. In the last case, an interesting comparison could be made with the galaxy in the lobe of 3C34 discussed earlier, since component ‘f’ would be expected to be a young, on–going starburst, rather that an older decaying one.
3C217
One of the bluest and most active galaxies in the sample, 3C217 (, Figure 11), is also one of the most misaligned. The bright central emission region (‘a’) is elongated and misaligned from the radio axis by nearly . Just to the east of this, a string of knots (‘b’) lie in a curve, arcing round towards the eastern radio lobe, and possibly tracking the path of the radio jet. These knots possess an f622Wf814W colour of , which is significantly bluer than that of the central emission region (f622Wf814W = ). Further components lie some 3 arcsec away to the south–west (‘c’) and to the north–east (‘d’). Component ‘d’ possesses a similar colour to the central regions, but ‘c’ is much bluer with f622Wf814W = .
This galaxy also possesses one of the most distorted infrared images, showing the central galaxy, another bright component, and extended diffuse emission to the north–east probably associated with component ‘d’ (Figure 11b). As noted by Rigler et al. [Rigler et al. 1992] and Dunlop and Peacock [Dunlop & Peacock 1993], the galaxy appears as extended in the infrared as in the optical images. Their image through a narrow–band filter centred on [OII] 3727 shows that the line emission is roughly symmetrical and confined mainly to the central object, and so this cannot be the cause of the observed elongation.
3C226
3C226, at redshift (Figure 12), displays a double morphology, with a bright central emission region (‘a’) corresponding to the position of the radio core, and a companion (‘b’) 10 to 15 kpc to the NW along the radio axis. This companion is significantly bluer than the central galaxy, with an f555Wf785LP colour of as compared to for the latter. The f555W image (enlarged in Figure 12b) shows this companion itself to be extended perpendicular to the radio axis. This component is not visible in our K–band image (Figure 12d), although it is marginally detected in that of Rigler et al. [Rigler et al. 1992]; in both of these infrared images, there is an extension to the north–east (perpendicular to the radio axis), corresponding to a very red companion (‘c’), visible in the f785LP observation (Figure 12a,c), but barely detected at 555 nm. There are also two emission regions close to the north-western radio lobe (‘d’ and ‘e’), the more northerly being particularly blue (f555Wf785LP), although it is unclear whether these are connected with the radio source.
If we use JK colour as an indicator of the redshift of a source, since at this is relatively unaffected by any flat–spectrum UV component, then 3C226 has a colour of JK, consistent with that expected a standard giant elliptical galaxy at (see Figure 5), whilst components ‘d’ and ‘e’ have colours of JK and JK respectively. This indicates that, if these objects contain old stars, ‘d’ may well be at the same redshift at 3C226 , whilst the bluer object ‘e’ is likely to be foreground.
Di Serego Alighieri et al. [di Serego Alighieri et al. 1994] detected polarised continuum emission from this source in three different wavebands. They measured polarisation percentages of , and , for the B, V and i bands respectively. To account for the decrease in polarisation between the V and i bands, they note that the i band lies at longer wavelengths than rest–frame 4000Å, and associate the decrease with dilution of the scattered component by an underlying old stellar population. The amplitude of the 4000Å break required in the old stellar population to produce the observed decrease in polarisation implies an age of Gyr, corresponding to a formation redshift of . These authors have also detected broad MgII 2798 emission from the host galaxy of this source and, although the narrow lines are all unpolarised, the broad MgII line is polarised at the same percentage as the continuum. This is presumed to be due to scattered light from the broad line region close to the active nucleus. If scattering by hot electrons associated with the cluster gas ( K) were responsible, spectral features such as this would be smeared by Doppler effects, and so dust scattering or scattering by electrons associated with the warm ( K) emission line gas are favoured.
3C239
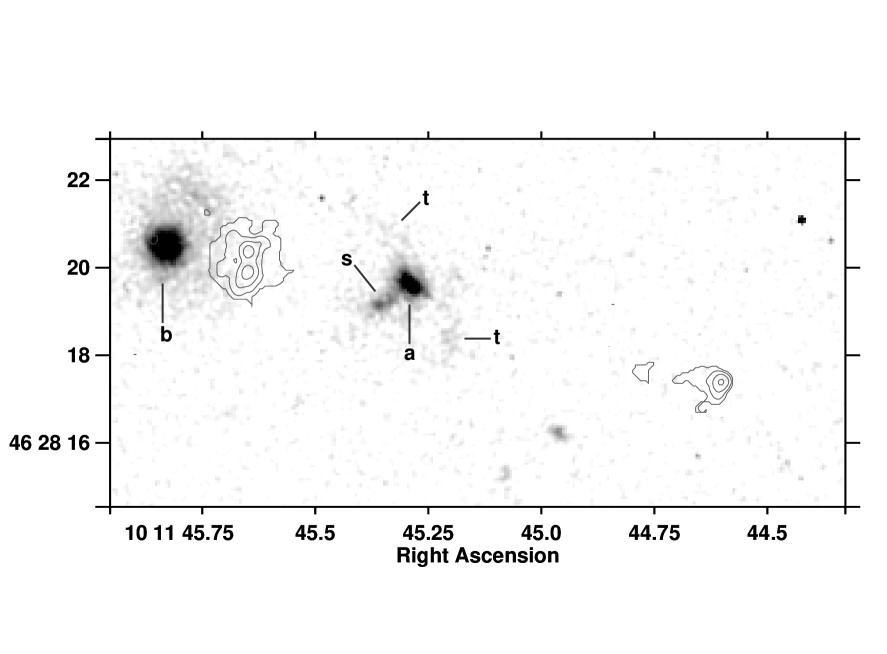
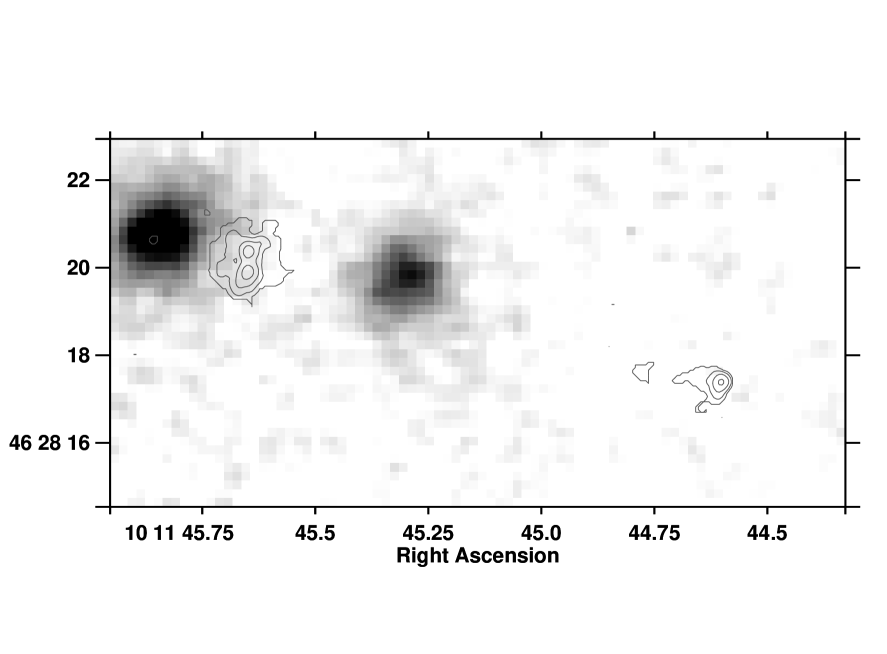
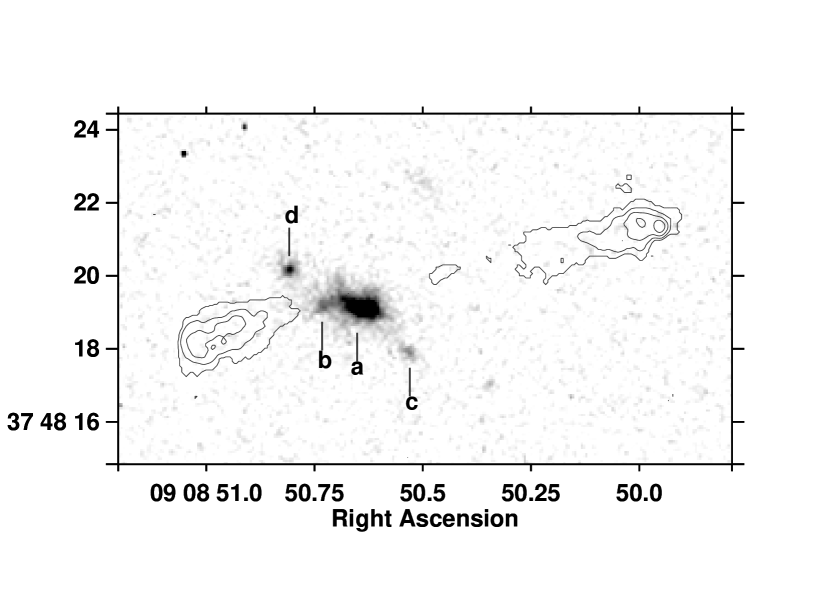
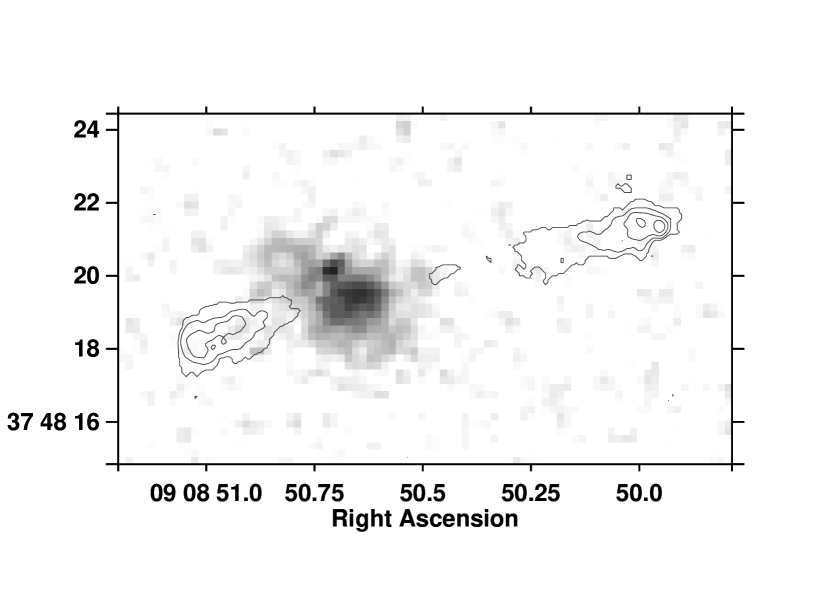
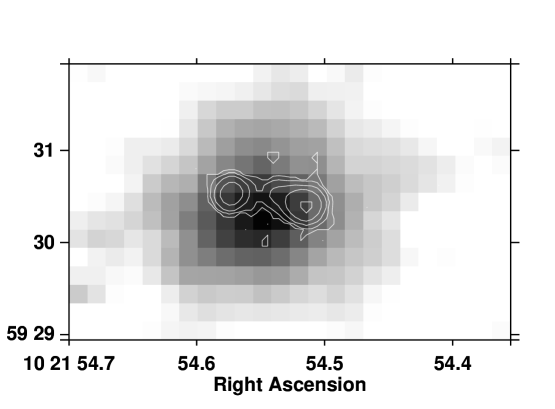
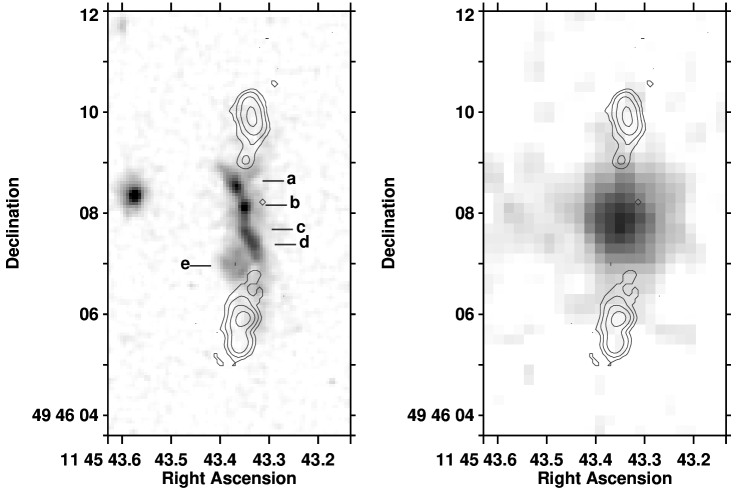
At redshift , 3C239 is the most distant galaxy in our sample, and is correspondingly the most powerful radio source. The HST image (Figure 13a) shows a bright central galaxy (‘a’) which consists of two distinct emission regions aligned within 25 degrees of the radio axis. These are shown more clearly in the contour plot in Figure 14. In addition, a string of components (‘s’) extends from the south–east of the galaxy, misaligned from the radio axis by some 45∘. The field also displays two large faint ‘tails’ (‘t’) stretching to the north and the west of the galaxy, extending 5 arcsec in length ( kpc). The infrared image (Figure 13b) shows no evidence of these tails of emission, but has a marginal extension corresponding to the string of components to the south–east.
These structures are reminiscent of the aftermath of galaxy collisions observed in the local universe. In this picture, the two bright central regions would represent the two merging galaxies, whilst tidal interactions would induce the formation of structures ‘s’ and ‘t’. Such a collision would be a prime candidate for the fuelling of a quiescent black hole, and inducing radio source activity in this source.
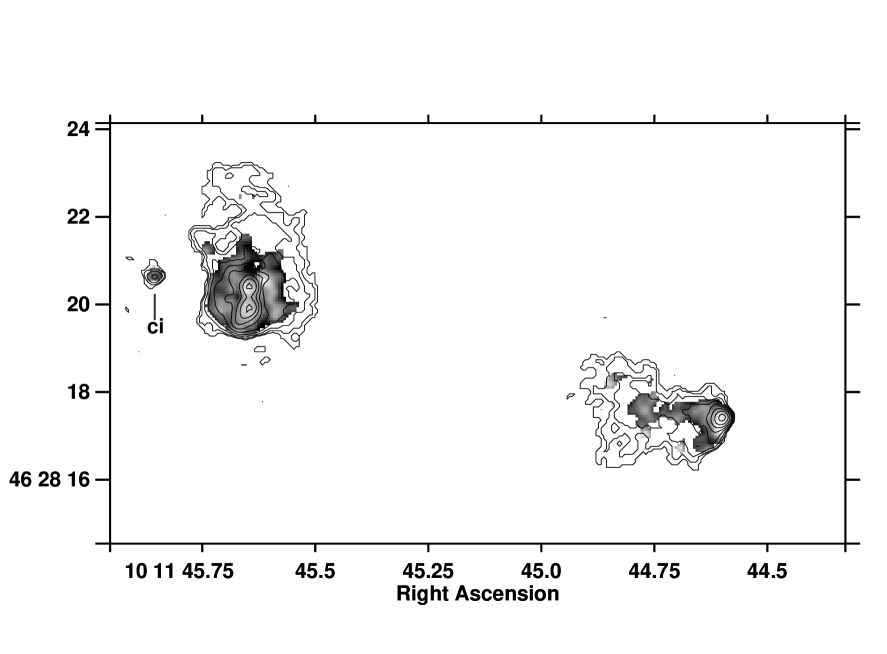
As reported by Hammer and Le Fèvre [Hammer & Le Fèvre 1990], 3C239 lies in a crowded field in which the colours of the galaxies appear bimodal. They suggest the presence of two populations of galaxies, one at the redshift of 3C239, perhaps forming one of the most distant known clusters, and the other at lower redshift. This second population includes galaxy ‘b’, which lies some 5 arcsec to the east of 3C239, close to the eastern radio lobe. Our VLA image shows this lobe to contain a double hot–spot. More interesting is the 1.4 GHz MERLIN image taken by Law–Green (Figure 13c) which, in addition to the double hot–spot, shows arc–like structures within the radio lobe; both the eastern edge of the lobe and the more diffuse northern emission are strikingly curved. There is also radio emission from just to the east of galaxy ‘b’ (labelled ‘ci’), which possesses a similar spectral index () as the mean of the radio lobe.
This may be an example of a gravitationally lensed system, with a foreground galaxy ‘b’ causing a distortion of the eastern radio lobe to produce a double hot–spot, a set of radio arcs, and a counter–image lying just to the east of the lensing galaxy. Lens system modelling confirms that such a scenario is possible, with plausible parameters for the lensing galaxy [Law-Green et al. 1997]. The alternatives are that the ‘counter–image’ is either radio emission associated with galaxy ‘b’, or a secondary hot–spot of 3C239, but neither of these possibilities seems likely (see Law–Green et al. 1997).
Spectral ageing analysis of the radio emission indicates that the lobe – hotspot separation velocity of this source is , suggesting that the age of the radio source is of order a few million years [Liu et al. 1992].

3C241
3C241, at redshift , is one of two compact steep spectrum sources in our sample, having radio size just under 7 kpc. The HST image (Figure 15a) resolves the ‘elongation’ seen in ground–based imaging of this galaxy [Le Fèvre et al. 1988a], showing it to consist of two separate emission regions aligned along the radio axis, on a scale similar to the size of the radio source. The radio emission is shown overlaid on the K–band image (Figure 15b) — due to the small size of this source, and the errors in the relative positioning of the optical and radio frames, the precise position of the radio lobes with respect to the optical emission is uncertain and the radio contours have therefore been omitted from the HST plot to enable the image to be seen more clearly. The infrared image shows that the radio source is completely contained within the host galaxy.
A high resolution, deep MERLIN image at 5 GHz taken by Sanghera et al. [Sanghera et al. 1995], and a combined EVN–MERLIN image at 1.6 GHz by Fanti et al. [Fanti et al. 1985] give more detailed pictures of the radio source. The western lobe is double, with two marginally separated components connected by a bridge of radio emission, and a flat spectrum radio core has been detected, positioned nearly symmetrically between the two lobes seen in Figure 15b. Both radio lobes are highly depolarised, consistent with them lying within the host galaxy and Faraday depolarisation having taken place within the interstellar medium.
3C247
The galaxy associated with the radio source 3C247, at redshift , lies in a very crowded field. The HST image of this galaxy (Figure 16a) shows a symmetrical central galaxy (‘a’), with a close companion, ‘b’, lying about 0.8 arcsec to the south. Two other galaxies, ‘c’ and ‘d’, lie within the envelope of the infrared emission, which is displayed in Figure 16b. The f555Wf814W colours of these four galaxies are, respectively: , , and . Components ‘a’, ‘b’ and ‘c’ are therefore red, inactive objects, whilst component ‘d’ is much bluer.
McCarthy [McCarthy 1988] showed that the [OII] 3727 emission of this source is extended towards the north–east. Our HST images clearly show extended diffuse emission in this direction, which may be entirely due to line emission, or may also contain continuum emission. McCarthy’s [OII] 3727 image also shows an extension to the south–west, with emission from regions close to the galaxies seen near the radio lobe in Figure 16, indicating the possible presence of a cluster surrounding 3C247. This extended emission line gas may be the cause of the high radio depolarisation observed throughout the regions of the radio lobes close to the nucleus [Liu & Pooley 1991], and possibly also for the distorted nature of the radio emission.
Radio spectral ageing analysis of this source has yielded an age of 3-5 million years, corresponding to a hotspot advance velocity of about [Liu et al. 1992].
3C252
The HST image of 3C252 (Figures 17a,b), at redshift shows two bright knots aligned along the radio axis. The close separation of these knots makes it unclear whether they represent distinct emission regions or whether a dust lane runs through the central regions of the galaxy, as has been suggested for 3C324 [Longair et al. 1995]. The f622Wf814W colours of the two knots are and for the western and eastern components respectively. Although these colours may suggest that they are two distinct emission regions, this difference could also be caused by differential reddening in a putative dust lane. In this case the eastern component, being redder, would be seen through a greater optical depth of dust and would therefore be the lobe orientated away from us. This is consistent with this lobe being the shorter lobe in a relativistic hotspot advance model (eg. Best et al. 1995).
The UKIRT K–band image (Figure 17c) shows a giant elliptical galaxy, with no evidence for the double optical components, although the poorer resolution of this image would make these difficult to detect. It does show a slight elongation along the radio axis, as does the image of Rigler et al. [Rigler et al. 1992], although that of Dunlop and Peacock [Dunlop & Peacock 1993] does not.
To the south–east of the central galaxy, the HST image shows a diffuse emission region, of triangular morphology similar to that expected of an ionisation cone of light scattered from an obscured nucleus. Surprisingly, however, this region appears redder than the central emission regions (f622Wf814W = ), although not at high significance. Another region of diffuse emission lies 3 arcsec to the north–west. Hammer and Le Fèvre [Hammer & Le Fèvre 1990] suggested that this object may have an arc–like structure characteristic of gravitational lensing, but the HST image suggests instead that it is part of a more diffuse structure.
3C265
The largest radio source in the sample, 3C265 (), possesses perhaps the most bizarre optical morphology of all the galaxies in the sample (Figures 18a,b). The unusually bright central region is completely surrounded by emission regions or companion galaxies, extending nearly 50 kpc from the centre. This source was discussed by Longair et al. [Longair et al. 1995] who considered that the optical structures may either be the aftermath of a galaxy merger or alternatively be associated with large clouds of gas, possibly cooling out of intracluster gas due to compression by the passage of the radio beams. The second possibility is consistent with the detection of X–ray gas surrounding a number of these powerful radio galaxies (Crawford and Fabian 1996b, and references therein) which suggests that cooling flows of up to may be infalling onto some central radio galaxies. This process would be particularly important in this, the largest and hence one of the oldest radio sources.
Tadhunter [Tadhunter 1991] reported the presence of high velocity gas in the extended emission line regions of this source. To the SE of the nucleus he detected three components of emission–line gas, at , and with respect to the velocity at the continuum centroid. These velocities are detectable in many lines, and cannot be caused by gravitational effects from a single galaxy, nor probably from a cluster. Tadhunter’s preferred explanation is that these emission line regions are associated with cocoons of material expanding around the radio jets, perhaps remnants of the bow–shocks associated with the passage of the radio jet. This supports the hypothesis of a cooling flow stimulated by the radio jets. Although the contribution of line emission may be high in the f785LP filter and the narrow–band [OII] 3727 image of Rigler et al. [Rigler et al. 1992] shows that the line emission extends over the entire area of the source, the f555W image contains little line emission and displays a similar morphology. Therefore the extended structures cannot be solely due to line emission.
Jannuzi et al. [Jannuzi & Elston 1991] have shown that this galaxy is polarised at the 8 – 9% level, with the position angle of the electric field vector orientated perpendicular to the extended UV emission of the host galaxy rather than to the radio axis. Hammer et al. [Hammer et al. 1993] presented a spectrum of the galaxy and argued that there is no evidence of a 4000Å break, although Cimatti et al. [Cimatti et al. 1994] argued that the presence of emission lines close to 4000Å, and dilution by a UV component make it difficult to quantify this result. Dey and Spinrad [Dey & Spinrad 1996] have detected a weak stellar absorption feature (the CaII 3933 K–line) in their spectrum, indicating that the system does contain stars. They also observed broad MgII 2798 emission, both from the nuclear region and from the spatially extended galaxian light, indicating the presence of an obscured quasar nucleus towards the centre of this source. Di Serego Alighieri et al. [di Serego Alighieri et al. 1996] have observed the source using spectropolarimetry. They confirm the level of continuum polarisation measured by Jannuzi et al. [Jannuzi & Elston 1991], and also detect broad MgII 2798 line emission in polarised light.
In contrast to the bizarre optical morphology, the K–band image (Figure 18d) shows only a bright central galaxy, together with a red companion, galaxy ‘c’, 4 arcsec to the NNW. In the J–band (Figure 18c) some of the diffuse emission is also visible. In Table 4 we list the optical colours of the various components of this source. The companion galaxy ‘c’ is significantly redder than the extended diffuse emission, whilst the two most southerly components are both much bluer. There is no immediately obvious explanation for these colour variations. In most models of the alignment effect the extended aligned emission should be bluer than the central emission, but comparing, for example, components ‘a’ and ‘f’, this is clearly not the case in 3C265. This might suggest that the optical morphology is influenced by dust extinction; for example, this might be the cause of the dark strip between components ‘d’ and ‘e’. Reddening by this same dust might then account for the colour differentials throughout the source. As a test, we split object ‘d’ into three strips of 3 arcsec by 0.5 arcsec and calculated the colours in each of these regions; the values are given in Table 4. Again we see very strong colour gradients, in this case even within a single emission region. This is characteristic of differential reddening by dust but, surprisingly, the westernmost regions of component ‘d’ are the bluest, whereas if the gap between ‘d’ and ‘e’ were due to dust extinction then this ought to be the reddest region. Also, were dust extinction responsible for the morphology and colours of this source, then the intrinsic ‘un–extincted’ flux density must be far higher than that observed, and already we observe this source to be by far the brightest 3CR galaxy in the sample (eg. see Table 1).
This source remains a mystery. Both its optical luminosity and its bizarre morphology make it unique amongst the 3CR radio galaxies, whilst the fact that it has a very high optical activity despite being the largest radio source in the sample is also somewhat different from the general trend of the other galaxies (eg. Best et al. 1996a). This might indicate that only for the very largest sources has there been sufficient time for gas compressed by the radio bow shocks to cool; the diffuse emission regions near the centre of the other large radio sources such as 3C252, 3C277.2 and 3C356 may represent the start of this process in those sources.
| Component | f555Wf785LP | Error |
|---|---|---|
| a | 1.91 | 0.03 |
| b | 1.89 | 0.09 |
| c | 2.57 | 0.20 |
| d | 2.15 | 0.07 |
| e | 2.00 | 0.13 |
| f | 2.22 | 0.09 |
| g | 1.59 | 0.11 |
| h | 1.05 | 0.19 |
| d (east) | 2.45 | 0.15 |
| d (centre) | 2.29 | 0.14 |
| d (west) | 1.79 | 0.13 |
3C266
3C266, at redshift , is one of the smaller double radio sources in the sample, extending just under 40 kpc. Misaligned only from the radio axis, a string of optically bright knots extends 15 kpc in length from the inner edge of one radio lobe to the other (Figure 19a). Underlying these, and even more closely aligned with the radio structures is highly elongated diffuse emission. Relative to these optical features, the K–band emission is much more compact and circularly symmetric showing only a slight north–south extension (Figure 19b, Rigler et al. 1992, Dunlop and Peacock 1993). Images taken through a narrow–band filter centred on [OII] 3727 show that the line emission associated with 3C266 is as extended along the radio axis as the continuum [Rigler et al. 1992, Hammer & Le Fèvre 1990]; Jackson and Rawlings [Jackson & Rawlings 1997] have recently detected extended [OIII] 5007 line emission as well.
A companion galaxy lies 3 arcsec to the east, although this is not visible in the narrow band [OII] 3727 images, and so could possibly be a foreground object. Hammer et al. [Hammer et al. 1986] suggested that the extended morphology of 3C266 could be a result of gravitational lensing either by this companion, or by the rich cluster A1374 (), the centre of which lies only 3 arcmins away from 3C266. The HST image does not support a multiple–image lensing interpretation; whilst some brightening by gravitational amplification cannot be ruled out, the fact that the K–magnitude of this galaxy is fainter than the mean K relationship means that this is unlikely to be significant.
| Component | f555Wf814W | Error |
|---|---|---|
| a | 1.32 | 0.11 |
| b | 1.54 | 0.12 |
| c | 1.46 | 0.17 |
| d | 1.41 | 0.11 |
| e | 1.27 | 0.14 |
In Table 5 we list the colours of the various knots in 3C266. Although the results are not highly significant, it is interesting that the further a knot is from the central regions of the galaxy, the bluer it appears to be. There are a number of possible reasons why this might be the case: (i) if the alignment is due to star–formation induced by the passage of the radio jet, then the knots closest to the radio hotspots will represent the most recent regions of star formation and therefore will be bluest; (ii) the two filters contain different amounts of line emission — if the line emission is not evenly distributed throughout the source, this could lead to apparent colour differences; (iii) differential reddening by dust intrinsic to the source can affect the observed colours — in particular if the source contains a central dust lane this could redden the two central knots; (iv) dilution of the central regions of the active ultraviolet emission by a an underlying red old stellar population. High resolution observations in the ultraviolet and infrared wavebands would provide further colour information and, together with mapping of the emission line structures of these sources, would help to distinguish between these alternatives.
Spectral ageing of the radio structures suggests that the lobe–hotspot separation velocity in this source is of order [Liu et al. 1992] which would suggest an age for the radio source of 1–2 million years. Liu et al. also report the possible detection of a radio core, of flux density 0.4 mJy at 5 GHz, located symmetrically between the radio hotspots.
3C267
The HST image of 3C267, overlaid on the A–array VLA radio map, is presented in Figure 20a. An enlarged image of the central galaxy is shown in Figure 20b. This galaxy, at redshift , consists of three knots of emission separated by over 10 kpc, and these are misaligned from the radio axis by about . Faint diffuse emission stretches between the knots, and there is also an arc–like structure, reaching from the north of the western knot back towards the central knot. Best et al. [Best et al. 1996] suggested that this could plausibly be due to relaxation of a star–forming region within the gravitational potential of the host galaxy. This arc structure and the south–western emission region have an f555WK colour of , a magnitude bluer than the rest of the galaxy (), and are barely visible in the K–band image (Figure 20c). The K–band emission is more nucleated that the optical emission but, as in the infrared images of Rigler et al. [Rigler et al. 1992] and Dunlop and Peacock [Dunlop & Peacock 1993], does show an elongation in the same direction as the optical image.
A narrow band image of this field taken by McCarthy [McCarthy 1988] through a filter centred on the [OII] 3727 emission line, showed that three galaxies to the south–west of 3C267 have excess emission through this filter. This suggests that they may be at the same redshift, meaning that 3C267 may be a member of a distant cluster.
3C277.2
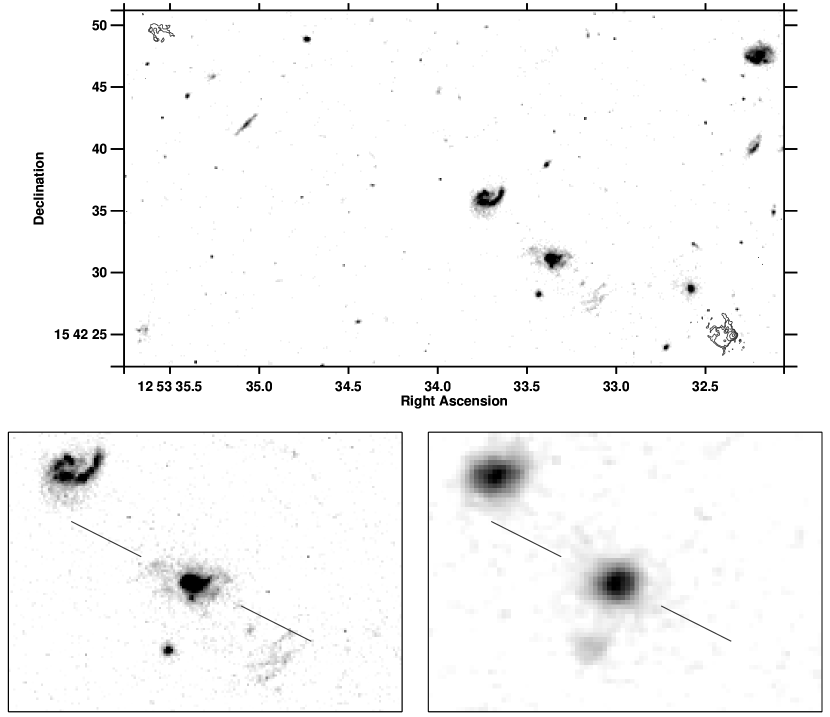
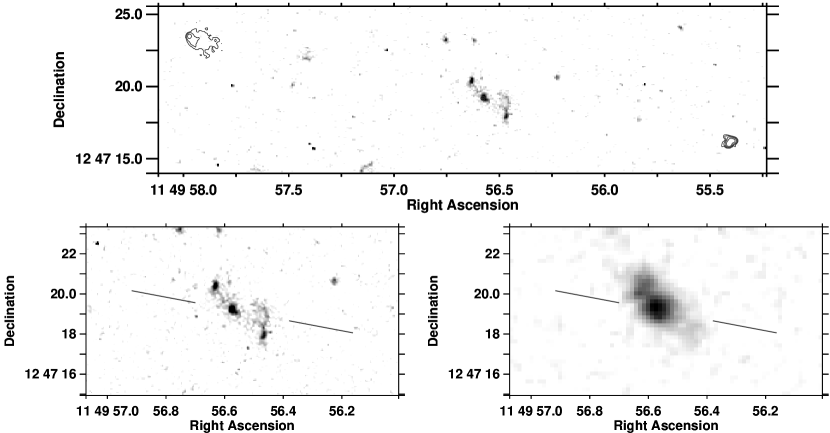
The HST images of 3C277.2 (, RA: 12 53 33.4, Dec: 15 42 31), with VLA contours overlaid, is shown in Figure 21a, and an enlargement of the central regions in Figure 21b. The radio galaxy shows a small elongation along the radio axis, and a region of diffuse emission to the south–west. This emission coincides with the peak flux density from a region of extended [OII] 3727 emission [McCarthy 1988], stretching over 30 arcseconds from the central radio galaxy. This emission line gas causes strong depolarisation of the radio emission from the western lobe, whilst the eastern lobe has no significant depolarisation [Pedelty et al. 1989a]. The western hotspot lies much closer to the radio core than that on the other side, perhaps due to strong interaction of the radio jet with the emission line gas on this side of the source. The emission from this region in the HST images lies roughly along the inner edge of the radio lobe, as defined by lower resolution radio maps, and is somewhat extended along the lobe boundary, providing further evidence for such an interaction.
Emission from these regions is barely visible in the J–band image, and not seen at all in the K–band image (Figure 21c). Instead the infrared images show a fairly symmetrical galaxy, together with a companion to the south–east. This companion is redder than the central radio galaxy, with an f814WK colour of as compared to . It is clearly present on McCarthy’s [McCarthy 1988] narrow band [OII] image, and so is likely to lie at the same redshift. Other objects in the field, predominantly to the south–west, also show excess [OII] emission, suggesting the presence of a cluster associated with 3C277.2. The strange galaxy to the north–east of the radio galaxy is not seen in the [OII] image, and so is likely to be a foreground object.
The optical emission from the radio galaxy is quite highly polarised in the B–band, at about the 20% level, suggesting that a significant proportion of the ultraviolet emission from this source is non–stellar in origin [di Serego Alighieri et al. 1989]. The position angle of the polarisation is degrees, nearly perpendicular to the radio axis. A dust mass of about is required to produce sufficient scattered light. At longer wavelengths, however, the polarisation falls sharply, being % in the i band [di Serego Alighieri et al. 1994]. This band lies longward of 4000Å in the rest–frame of the source, and so this result can be explained by dilution of a flat spectrum scattered component by emission from an old stellar population of age at least 2 Gyr. This is consistent with the smooth morphology of the infrared images.
In an X–ray observation of this field, the source was detected with a signal–to–noise ratio of only 3, and an X–ray luminosity of erg s-1 found in the ROSAT X–ray band [Crawford & Fabian 1995]. This emission is likely to be predominately due to the hot intracluster gas.
3C280
The most striking feature of the HST image of 3C280 (, Figures 22a,b) is the bright arc of emission stretching back from the western–most emission region towards the bright central emission of the galaxy. As in the case of 3C267, Best et al. [Best et al. 1996] suggested that this could plausibly be relaxation of a star–forming region within the gravitational potential of the host galaxy. This arc–like structure lies at the extremity of the K–band emission from the host galaxy (Figure 22c), not corresponding to any structure in that image, and so must represent very blue material.
In Table 6 we present the f622Wf814W colours of the various regions comprising 3C280. The central region, ‘b’, is the reddest, whilst the western component, ‘c’, and the arc produce the bluest emission. We divided the arc into two regions, the half nearest the western emission and the half nearest the centre of the radio galaxy; the western region of the arc is significantly bluer. This proves that the emission from the arc cannot be due to gravitational lensing of component ‘b’ by a foreground component ‘c’ or indeed by any other object. It is consistent with relaxation of a star forming region, with the youngest stars having been formed close to the western knot, and the oldest stars having fallen back towards the central galaxy under gravity. It would also be consistent with some reddening of the inner regions of the arc by dust extinction, or by ‘dilution’ of the ultraviolet emission by the underlying red old stellar population.
The K–band image itself, shows a single galaxy, elongated slightly in the east–west direction, plus a second galaxy to the north (see also Dunlop and Peacock 1993). This red companion can also be seen on the HST image. It is not certain that this galaxy lies at the same redshift at 3C280, but its JK colour is , consistent with it being at that redshift (see Figure 5).
| Component | f622Wf814W | Error |
|---|---|---|
| a | 0.86 | 0.15 |
| b | 1.03 | 0.05 |
| c | 0.72 | 0.10 |
| arc | 0.62 | 0.13 |
| arc (west) | 0.44 | 0.16 |
| arc (cent.) | 0.79 | 0.19 |
3C280 possess strong aligned [OII] 3727 emission, which extends 5 arcsec to the east of the host galaxy and surrounds the eastern radio lobe [Rigler et al. 1992]. The [OII] emission from this region has a systemic velocity of over 500 kms-1 with respect to that of the host galaxy. Emission from this region of the source is detected in the f814W HST image (Figure 22b); this filter contains the [OII] 3727 emission line at the redshift of 3C280, and so the emission seen from this region is almost certainly dominated by line emission. The radio emission from the eastern lobe is highly depolarised, probably due to Faraday depolarisation by the emission line gas, whilst the western lobe is less depolarised [Liu & Pooley 1991]. A lobe – hotspot separation velocity of is derived by Liu et al. (1992) from radio spectral ageing fits, indicating an age of a few million years.
Worrall et al. [Worrall et al. 1994] have detected 3C280 in the X–ray waveband using ROSAT observations. They detected both unresolved and extended emission, and argue that the extended emission is produced by hot plasma of insufficient density for a cooling flow to have begun. Crawford and Fabian [Crawford & Fabian 1995] argue that the unresolved X–ray emission could be associated with a cooling flow in the central regions.
3C289
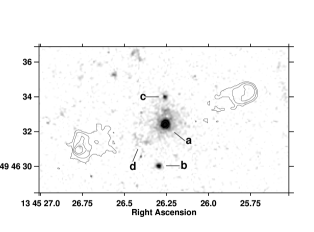
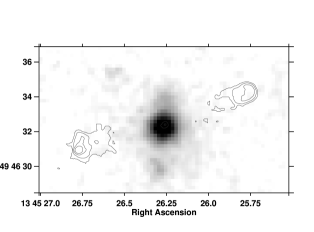
3C289 () does not show much optical activity, although it is not entirely passive. The HST image, displayed in Figure 23a, consists of a central bright region (‘a’) surrounded by diffuse emission. Two compact components lie 2.5 arcsec to the south (‘b’) and 1.5 arcsec to the north (‘c’), and there is also a region of diffuse aligned emission (‘d’) to the south–east of the galaxy, close to the radio axis. The K–band image is presented in Figure 23b; component ‘b’ can be seen as a southern extension of this image (demonstrating that the north–south extension of Dunlop and Peacock’s [Dunlop & Peacock 1993] image is no artefact) but component ‘c’ is barely visible and there is little evidence for the emission from ‘d’. The f622Wf814W colours of these objects are: ‘a’ — ; ‘b’ — ; ‘c’ — ; and ‘d’ — .
The radio emission is highly symmetrical, with the hot–spots lying at the extremities of two equally bright radio lobes, at the same distance from the nucleus. Liu et al. [Liu et al. 1992] have derived a lobe–hotspot separation velocity of from a radio spectral ageing analysis.
3C324
3C324 lies towards the centre of a fairly rich cluster of galaxies at redshift [Dickinson 1997]. The HST image in Figure 24a shows a number of components, misaligned with respect to the axis defined by the radio hotspots by 30∘ (see also the ground–based images of Hammer and Le Fèvre 1990 and Rigler et al. 1992). Lower resolution VLA images by Fernini et al. [Fernini et al. 1993] show radio emission extending towards the radio galaxy from the southern end of the eastern lobe and the northern end of the western lobe and, if this is the axis along which the relativistic material is being transported, the optical structures follow it reasonably well. Dickinson et al. [Dickinson et al. 1996] have suggested that the apparent anti–clockwise rotation of the radio and ultraviolet structures with decreasing distance from the active nucleus may represent precession of the AGN emission axis.
The HST image of this galaxy was discussed by Longair et al. [Longair et al. 1995], who showed that the morphology was consistent with a dust lane passing through the central regions of the galaxy between the emission peaks labelled ‘a’ and ‘b’, obscuring the optical emission from this region. Dickinson et al. [Dickinson et al. 1996] redshifted a relatively nearby brightest cluster galaxy to a redshift , and calculated that extinction with E(BV) is required to obscure the central regions of the galaxy. No significant obscuration occurs at infrared wavelengths, and the UKIRT K–band image is sharply peaked at the centre of the galaxy (Figure 24b). It is slightly elongated to the north–east, due to the presence of a faint red companion, just visible in the HST image (‘e’). Dunlop and Peacock [Dunlop & Peacock 1993] used cleaning and maximum entropy methods to deconvolve a deep K–band image, and suggested that the result was not smooth, but clumpy. Their predicted structure bears a vague resemblance to the morphology seen in our optical HST image.
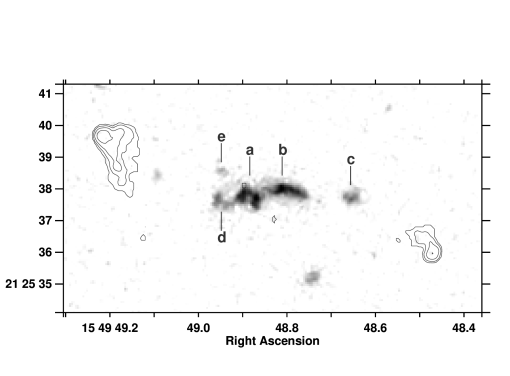
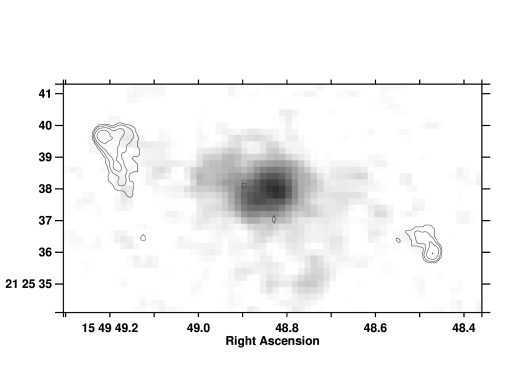
Di Serego Alighieri et al. [di Serego Alighieri et al. 1993] and Cimatti et al. [Cimatti et al. 1996] have measured an optical polarisation of between and from this galaxy, the percentage polarisation being roughly constant with wavelength. The polarisation is extended and increases in the outer regions of the source, suggesting the presence of diluting ultraviolet emission which decreases with distance from the nucleus. Using spectropolarimetry these authors have detected a broad component to the MgII 2798 line, and showed this line to be polarised, although not at the same level as the continuum emission. The narrow emission lines have little or no polarisation. Although the ultraviolet emission of 3C324 is relatively red (; Dickinson et al. 1996), Cimatti et al. (1996) suggest that this can be due to scattering by dust particles, the scattered light being reddened by passing through further dust clouds outside of the scattering regions.
Only small colour differences are observed between the knots in this source (see Table 7), but the two filters used were not widely separated in wavelength and so any differences would be expected to be small. In addition, both filters are strongly influenced by line emission and, if distributed non-uniformly, this could swamp any colour gradients in the source. Cimatti et al. [Cimatti et al. 1996] suggest that the eastern emission (‘a’ and ‘d’) is redder than the western (‘b’), but that the line luminosities are higher in the west; this second effect is likely to be the more important of the two in our observations, leading to the western component appearing to be redder.
| Component | f702Wf791W | Error |
|---|---|---|
| a | 0.64 | 0.08 |
| b | 0.86 | 0.08 |
| c | 0.56 | 0.20 |
| d | 0.77 | 0.15 |
| e | 0.94 | 0.38 |
Interestingly, Cimatti et al. [Cimatti et al. 1996] find that the companion 2 arcsec to the west of 3C324 (galaxy ‘c’) is significantly bluer than the host radio galaxy (our HST colours also show it to be bluer, although at low significance). This companion galaxy is unpolarised. They have modelled the stellar population within this galaxy and find that it is consistent with a star–formation rate of up to yr-1. If star formation is indeed occurring in galaxy ‘c’, and has been induced by the passage of the radio jet through a galaxy in the cluster surrounding 3C324, then it would seem natural to assume that such star formation would also have been induced by the radio jets as they passed through the host galaxy of 3C324 itself. Therefore, the dilution of the scattered light by ultraviolet emission could well be due to young stars. These stars would also provide a natural explanation for the origin of some or all of the dust involved in the scattering process. It is interesting to compare this result for galaxy ‘c’ with that of galaxy ‘a’ in 3C34 [Best et al. 1997a].
Di Serego Alighieri et al. [di Serego Alighieri et al. 1993] find no evidence in their spectra for a system at redshift , which had been previously suggested by Le Fèvre et al. [Le Fèvre et al. 1987]. They note that all the features quoted by Le Fèvre et al. coincide with strong sky features. This, together with the high resolution image, makes it unlikely that the morphology of this source is determined by gravitational lensing.
3C337
The host galaxy associated with the radio source 3C337 lies towards the centre of a cluster of galaxies [McCarthy 1988] at a redshift of . The HST image of the galaxy (‘a’), shown in Figure 25a, shows very little structure with just a single small companion (‘b’) lying 1 to 2 arcsec to the NW of the host galaxy. This knot has an f555Wf814W colour of , bluer than the colour of the central region. In the infrared image, the galaxy shows no extensions, resembling a standard giant elliptical galaxy (Figure 25b).
This source shows strong nuclear and extended [OII] 3727 line emission, the latter stretching over 100 kpc from the central galaxy and extending around the south of the eastern lobe [McCarthy 1988]. The radio structure of 3C337 is asymmetric, with the eastern hotspots being only half as far from the nucleus as the western hotspot, and the eastern lobe being much more depolarised [Pedelty et al. 1989b]. Each of these two effects is likely to be due to the presence of this emission line gas near the eastern lobe.
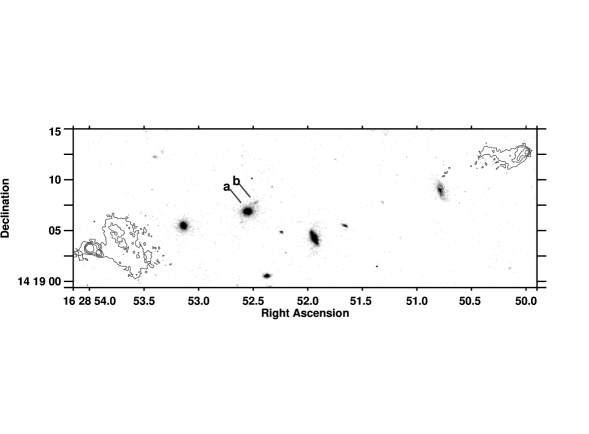
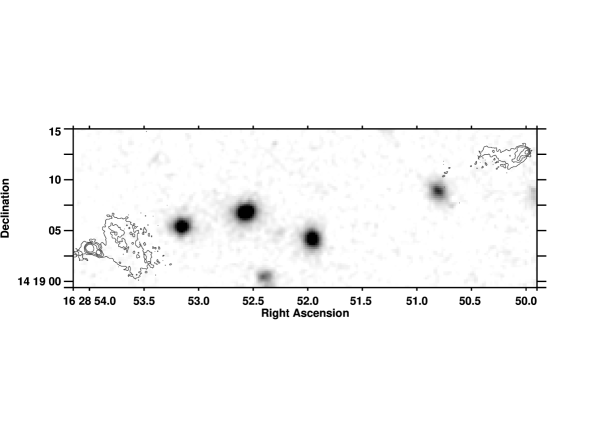
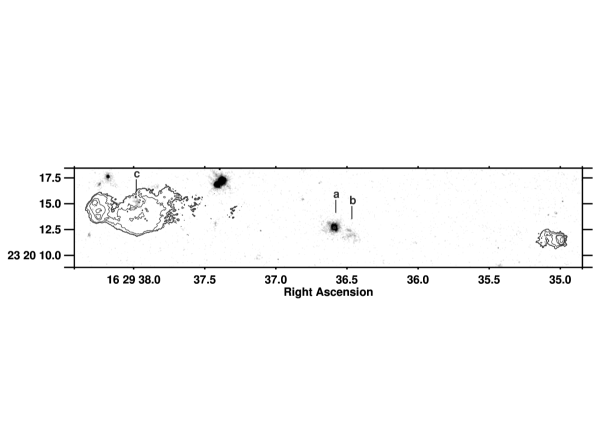
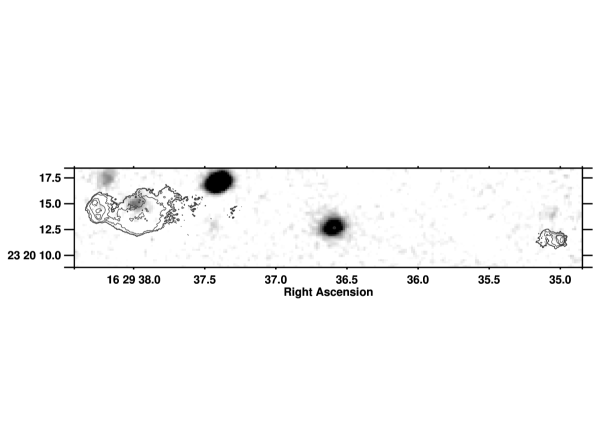
The eastern hotspot is double, the more southerly of the pair being more compact and having polarisation properties consistent with it being the current primary hotspot. The two hotspots protrude from a curved boundary at the end of the eastern lobe. Radio spectral ageing estimates suggest that the hotspots in this source are advancing at a speed of , giving an age for the radio source of about years [Pedelty et al. 1989b].
3C340
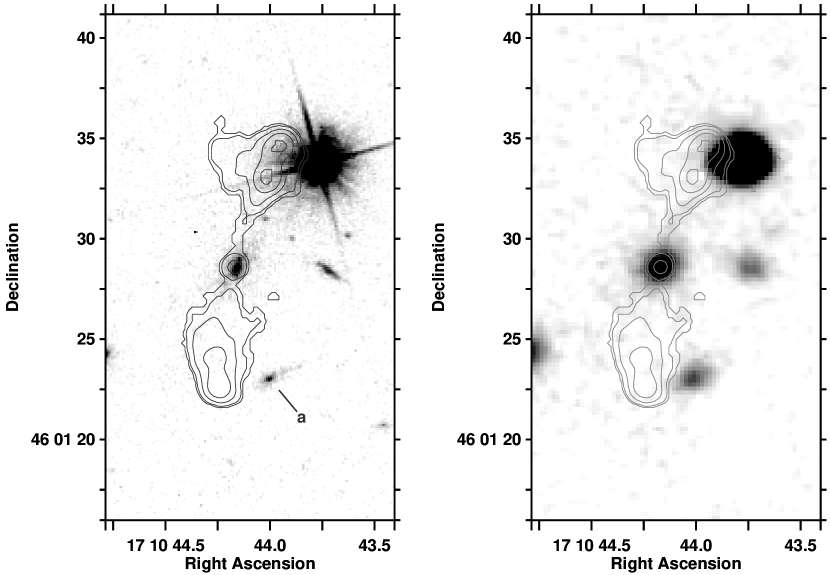
The HST image of 3C340, galaxy ‘a’, at redshift , is displayed in Figure 26a and shows a marginally aligned central galaxy together with fainter emission (marked as ‘b’) about 2 arcsec to the WSW. The central galaxy has an f555Wf785LP colour of , whilst knot ‘b’ is bluer with f555Wf785LP. The knot can also be seen quite strongly in the narrow–band [OII] 3727 image taken by McCarthy [McCarthy 1988], but it is not visible in our infrared image (Figure 26b). Johnson et al. [Johnson et al. 1995] have detected a weak radio jet candidate extending from the core towards the western lobe, coincident with this emission line region.
The bright radio emission in the eastern lobe seems to pass around the emission region at RA: 16 29 37.97, Dec: 23 20 15 (J2000), visible on both the infrared and HST images and labelled ‘c’. This corresponds to the region in which Johnson et al. [Johnson et al. 1995] have detected a ‘depolarisation silhouette’ in their deeper radio maps; that is, a point where the depolarisation of the radio emission between 21 cm and 6 cm is significantly higher than the rest of the lobe. This is attributed to Faraday depolarisation by gas either within the lobe or in front of it. They also note that this galaxy appears to be interacting with the larger galaxy 3 arcsec to the north–east, with evidence (from ground based–images) of a tidal tail of material from the latter, suggesting that the gas involved in this interaction may be responsible for the depolarisation.
If galaxy ‘c’ is at the same redshift as 3C340, then backflowing material within the radio lobe may be channelled round it by the higher density of material. If this is the case then the host galaxy of 3C340 could be a member of a group or cluster of galaxies. However, the depolarisation throughout the rest of the lobes of 3C340 is remarkably low, indicating that if this is the case then it must be a relatively poor cluster with little cluster gas. Also, there is no evidence for emission from either of the two galaxies in a narrow band [OII] 3727 image [McCarthy 1988].
3C352
With a relatively bright star lying only 7 arcsec to the north–west, 3C352 at redshift is one of the most awkward sources to observe from the ground, but the high angular resolution of the HST distinguishes the galaxy clearly. The optical emission, shown in Figure 27a, is elongated, although not nearly as much as the [OII] 3727 emission line region which extends over 8 arcsec [McCarthy 1988, Rigler et al. 1992]. The most extended diffuse emission in the HST image is misaligned from the radio axis by about 20 degrees, which is comparable to the misalignment of the [OII] line emission. However, the bright central regions of the HST image, although much less extended, are aligned almost exactly along the radio axis. The infrared K–band image is more compact and symmetrical, but does show a slight extension along the radio axis (see Figure 27b, and also Dunlop and Peacock 1993).
Using Fabry–Perot interferometry, Hippelein and Meisenheimer [Hippelein & Meisenheimer 1992] mapped the spatial and spectral distribution of the line emission from this source, and attempted to remove it from an R–band image of the galaxy. They suggested that the residual continuum emission showed no significant elongation along the radio axis. A continuum image taken just longward of the 4000Å break shows marginal elongation, but significantly less than that of the line emission [Rigler et al. 1992].
Hippelein and Meisenheimer [Hippelein & Meisenheimer 1992] explained the velocity profiles of the extended emission line region in terms of a bow–shock associated with the radio jet. The bow–shock alone cannot supply sufficient energy to excite the emission line regions, and so much of the excitation is likely to be due to violent interactions of the gas with the supersonic flow in the jet. In the central regions a proportion of the excitation may be associated with ultraviolet emission from an AGN.
Several other objects in the field of 3C352 show [OII] 3727 emission, indicating that the galaxy is likely to be a member of a cluster. One such cluster member is the galaxy 5 arcsec SSW of 3C352, labelled galaxy ‘a’ in Figure 27a. The [OII] emission from this object extends for about 7 by 11 arcsec indicating a large gas mass. It is blue–shifted with respect to 3C352 by 500 km s-1, with only small velocity fluctuations and velocity widths within the cloud itself [Hippelein & Meisenheimer 1992]. These authors suggested that this cloud may be excited by an interaction of the gaseous halo surrounding the central galaxy with accreting intracluster material. The HST image shows that this galaxy possesses a peculiar morphology. The f555Wf814W colour of galaxy ‘a’ () is redder than that of the central galaxy (), indicating that the central galaxy may be more active than galaxy ‘a’, although this effect may be due to differing levels of line emission in the two objects.
3C356
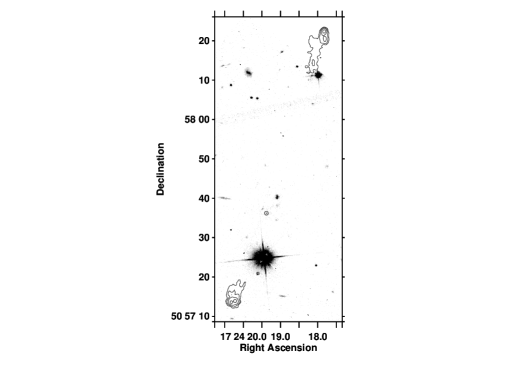
Figure 28 shows the HST image of 3C356, with radio contours overlaid. An enlarged picture of the central regions of this radio source (Figure 29), shows two unresolved radio ‘cores’, separated by only 5 arcsec and aligned approximately along the radio axis. Each of these cores is associated with equally bright infrared galaxies at redshift , and this has led to a dispute about which of the two galaxies is the host galaxy of the radio source.
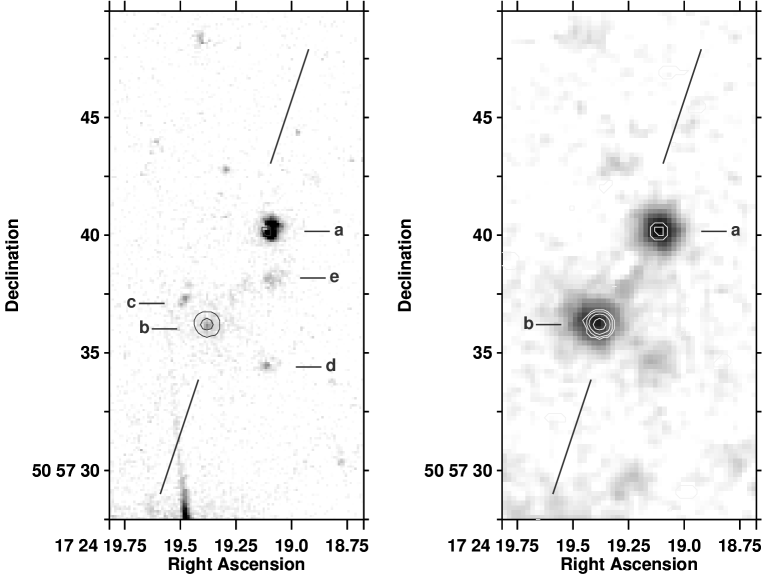
At 8.4 GHz (see Figure 29), the radio emission associated with the southern galaxy, ‘b’, is brighter, with a flux density of 0.95 mJy, whilst that from the northern galaxy, ‘a’, is only 0.22 mJy (both of our values are about 10% smaller than the values quoted by Fernini et al. 1993). The emission from ‘b’ has a flat radio spectrum between 8.4 GHz and 5 GHz, , typical of the compact cores of extended radio sources. The spectral index of ‘a’ is steeper, , more in line with that of a compact steep spectrum source.
Ground–based optical observations have shown galaxy ‘a’ to be extremely compact, whilst ‘b’ is much larger with a very flat surface brightness distribution [Le Fèvre et al. 1988a, Rigler et al. 1992]. Intrinsically, galaxy ‘b’ is extended perpendicular to the radio axis (Figure 29, Rigler et al. 1992, Dunlop and Peacock 1993). Both objects show strong [OII] 3727 emission, with the line emission from ‘a’ again being much more centrally condensed [McCarthy 1988, Eisenhardt & Chokshi 1990, Rigler et al. 1992]. Jackson and Rawlings [Jackson & Rawlings 1997] detect [OIII] 5007 emission from object ‘a’, and marginally from ‘b’. The detection of a 4000Å break in both components [Lacy & Rawlings 1994] indicates that they both contain stars and must be at least years old.
Rigler et al. [Rigler et al. 1992] suggest that the southern galaxy may have wandered into the path of the radio beam from galaxy ‘a’. In contrast, Lacy and Rawlings [Lacy & Rawlings 1994] presented a model in which galaxy ‘b’ is the nucleus, and galaxy ‘a’, which possesses ultra–high ionisation narrow lines, is photoionised by hot gas generated in shocks driven into the galaxy by interaction with the radio jet. They suggest that the population of stars in galaxy ‘a’ is only a few times years old, and was formed when the jet originally pointed at the galaxy, but then precessed away to point at the current hot–spot position, and has now precessed back again. They cite the low carbon–to–oxygen ratio and the low levels of dust in the galaxy as evidence of its young age.
Two aspects of the HST image suggest that this is not the case. Firstly, galaxy ‘a’ has been resolved by the HST, showing it to display a ‘dumbbell’–shaped optical morphology. This double structure is characteristic of a number of the galaxies in the sample, eg. 3C226, 3C241 and 3C252. Secondly, the optical emission from the southern galaxy ‘a’ is barely visible on the HST image, consisting of a set of three unresolved emission regions orientated perpendicular to the radio axis: one lies at the position of the infrared emission (‘b’), a second 1 arcsec to the NE (‘c’), and the third nearly 3 arcsec to the WSW (‘d’). Further emission (‘e’) lies 2 arcsec to the south of the northern galaxy. This collection of isolated emission regions bears no resemblance to any other galaxy in our sample, and most of the emission lies outside the envelope of the infrared emission from the southern component. It seems likely that ‘a’ is the host galaxy, and the disturbed structure seen around the southern galaxy is associated with the aftermath of the passage of the radio jet close to or through this galaxy.
Galaxy ‘a’ shows a high continuum polarisation, rising from about 3% at restframe 4200Å up to 15% at 2000Å [Cimatti et al. 1997]. Broad MgII 2798 line emission is observed, and is polarised at the % level. The narrow emission lines show little of no polarisation. The polarisation of the southern galaxy ‘b’ is much lower, reaching only % at 2000Å. Based upon the assumption that the broad MgII 2798 line emission and the scattered continuum emission should have the same fractional polarisation, Cimatti et al. [Cimatti et al. 1997] estimate that of the total emission at 2800Å is associated with scattered light in galaxy ‘a’. Following the prescription of Dickson et al. [Dickson et al. 1995], they also calculate that as much as 25% of the ultraviolet emission may be associated with nebular continuum emission. On the basis of energetics, these authors agree that the northern galaxy ‘a’ is more likely to harbour the hidden quasar nucleus.
In Table 8 we present the f622Wf814W colours of the five different components labelled in Figure 29a. These data show that galaxy ‘b’ is significantly redder than the northern galaxy ‘a’, but also shows that the other diffuse emission regions around this galaxy are as blue as galaxy ‘a’. This would be consistent with these representing regions which have been disrupted by the passage of the radio beam, and are currently optically active. Alternatively these may be associated with gas cooling after being compressed by the expanding radio lobes, as has been suggested for 3C265.
| Component | f622Wf814W | Error |
|---|---|---|
| a | 1.06 | 0.05 |
| b | 1.92 | 0.24 |
| c | 0.95 | 0.23 |
| d | 1.43 | 0.29 |
| e | 1.03 | 0.21 |
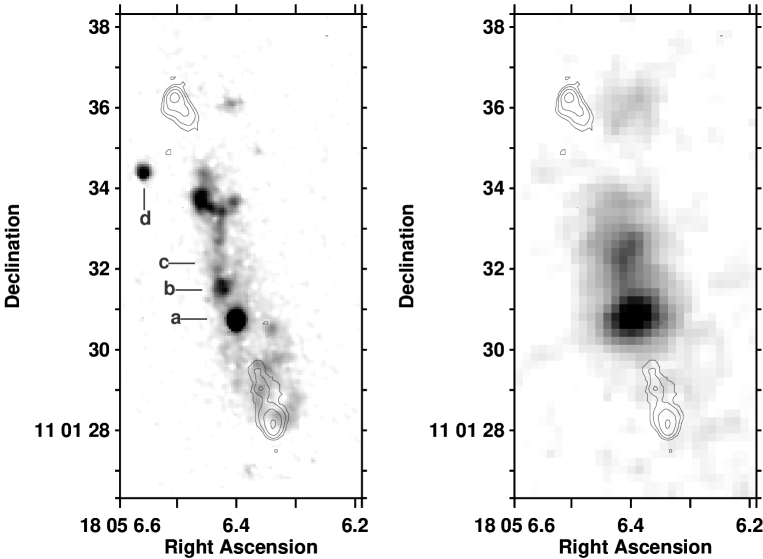
X–ray emission has been detected from the vicinity of this source by Crawford and Fabian [Crawford & Fabian 1993], with an X–ray luminosity of . A further observation using the ROSAT HRI has shown that this X–ray emission is extended [Crawford & Fabian 1996a], and not associated with a point source, as would be expected in the jet–cloud interaction model [Lacy & Rawlings 1994]. Crawford and Fabian [Crawford & Fabian 1996a] associate these X–rays with emission from a dense halo of hot gas cooling at a rate of 500 to 1500 yr-1; this is sufficiently high that it may account for the origin of the emission regions ‘c’, ‘d’ and ‘e’. There is marginal evidence that the X–ray emission is elongated in the direction of the radio axis.
Rawlings et al. [Rawlings et al. 1991] have detected the emission line [SIII] 9532, with a flux of , in the northern galaxy using near infrared spectroscopy. This will contribute about 15% of the K–band flux, but line emission alone is not sufficient to account for the large difference in colour between the two galaxies.
3C368
3C368, at redshift , is the best studied radio galaxy in this sample, and perhaps of all galaxies at high redshift. The HST image of this source, presented in Figure 30a, has been discussed in detail in a previous paper [Longair et al. 1995]. The main points of note were the following: (i) the bright object towards the centre of the galaxy (labelled ‘a’) is a galactic M–dwarf star [Hammer et al. 1991] — a spectrum of this object taken by Stockton et al. [Stockton et al. 1996] confirms this identification; (ii) the most promising candidate for the nucleus of the galaxy was the emission region 1 arcsec to the north of the M–star (‘b’); (iii) a bright string of knots stretches from this emission region towards the northern hot–spot; (iv) the southern radio lobe lies within an edge–brightened elliptical emission region, possibly associated with a bow–shock phenomenon (see also Meisenheimer and Hippelein 1992).
Interestingly, there are no significant ‘colour’ differences between the central emission region ‘b’ (f702Wf791W), the northern knots (f702Wf791W) and the southern diffuse emission (f702Wf791W). As the two filters include significant line emission, any non-uniformity in the line emission would produce noticeable ‘colour’ gradients, and so this result suggests that the line emission has very similar morphology to the continuum in this source (see also the [OII] 3727 image of Meisenheimer and Hippelein 1992). Any variation in line emission must be matched by corresponding variations in the intrinsic colours.
The infrared emission from 3C368 shows none of this complexity. The M–star is clearly visible in the infrared K–band image (Figure 30b), and to the north of this the emission from the galaxy itself can be seen. The lack of complexity of the infrared image is not simply due to lower angular resolution: a 0.3 arcsec resolution K–band image has been obtained by Stockton et al. [Stockton et al. 1996], and it also shows only these simple structures. In their image, the centre of the infrared galaxy lies fractionally north of the emission region ‘b’ which we previously suggested as a candidate for the nucleus, and is coincident instead with the dip in the optical emission (‘c’). We agree with their interpretation that this is the position of the galaxy nucleus; this suggests that, as in the case of 3C324, there may be dust obscuration of the nucleus.
There is only a slight hint of emission from the southern region in the K–band image. Also only faintly detected in the infrared images is emission from object ‘d’ at RA: 18 05 6.55, Dec: 11 01 34.5 in the HST image. A colour–colour plot shows this object to lie in a region occupied by galactic stars [Rigler et al. 1992], and this hypothesis is supported by its unresolved appearance on the HST image. 3C368 lies at low galactic latitude, and many stars lie within an arcminute of the source.
Di Serego Alighieri et al. [di Serego Alighieri et al. 1989] measured the polarisation of the optical emission to be and in the V and R wavebands respectively. Scarrott et al. [Scarrott et al. 1990] carried out imaging polarimetry, showing that that the extended regions were polarised, with the electric field vector perpendicular to the radio axis, and that the scattering percentage decreased with increasing wavelength. They attributed the latter observation to dilution of the scattered component, possibly by an underlying old stellar population.
Van Breugel (private communication) has recently made HST and Keck observations of this source and found no extended polarisation with either telescope. The contradiction between these and the previous observations has yet to be resolved; the time-scale between observations is clearly too short for it to be due to variability. Van Breugel’s Keck spectrum of 3C368 shows little evidence for stellar absorption lines.
The contribution to the spectrum of this source by nebular emission mechanisms, that is, the free–free, free–bound and 2–photon continua and Balmer continuum emission, has recently been calculated using photoionisation models, based upon the line flux of the [OIII] 5007 line [Dickson et al. 1995]. They show that up to 60% of the ultraviolet emission from 3C368 may be associated with thermal emission from the nebular gas. Stockton et al. [Stockton et al. 1996] suggest that this may rise to as much as 80% in the northern emission knots. Rawlings et al. [Rawlings et al. 1991] have cast doubt on whether photoionisation models are appropriate for this source, since they detect a low [SIII] / [OII] ratio, suggesting low ionisation, but also strong high ionisation NeIII lines in the optical spectrum. The use of different ionisation models would not, however, affect the result that nebular continuum emission from this source is highly significant.
X–ray emission from the vicinity of the radio source has been detected with an X–ray luminosity [Crawford & Fabian 1995].
3C437
The radio source 3C437, at redshift , is displayed with radio contours overlaid in Figure 31, and an enlargement of the central regions of the source is shown in Figure 32. As with 3C68.2, the HST data have been averaged in blocks on 2 by 2 pixels and smoothed with a 0.2 arcsecond Gaussian profile to improve the signal–to–noise ratio. The optical emission from the host galaxy is highly elongated but misaligned with respect to the axis of the radio source by about 35 degrees (Figure 32a). Le Fèvre et al. [Le Fèvre & Hammer 1988] suggest that the optical emission arises from five components in two groups. The north–western group of three (‘a’, ‘b’ and ‘c’) is detected in the HST image, consisting of two small emission regions plus diffuse emission to the north–west. Approximately 2 arcsec to the south–east of these lies a further emission region (‘d’ and ‘e?’), associated with the pair suggested by Le Fèvre et al., but the low signal–to–noise ratio makes these difficult to detect. There is another emission region (‘f’), 7 arcsec away in the same direction; this is probably too far from the radio axis to be considered part of the radio source, but may be at the same redshift as the other components.
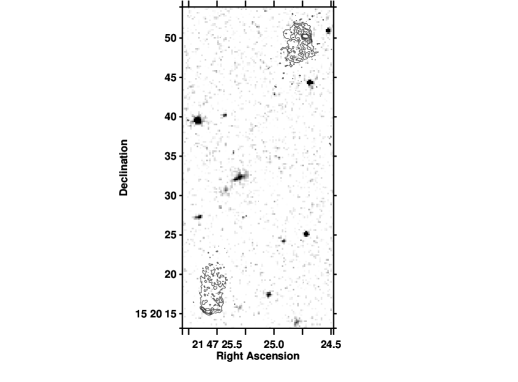
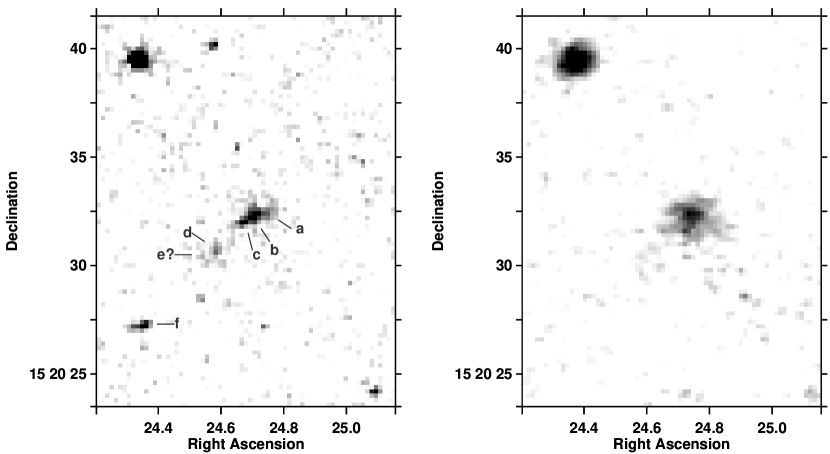
The J–band image of this galaxy presented by Eisenhardt and Chokshi [Eisenhardt & Chokshi 1990] shows a similar morphology to the optical image for the north–western three emission regions, whilst the south–eastern pair weren’t detected. Our K–band image (Figure 32b) shows emission from the region of the north–western components on the HST image; this has a slight east–west extension but does not resolve individual emission regions. There is a marginal detection of emission from the south–eastern pair, whilst the possible companion, ‘f’, is not detected. A narrow–band [OII] 3727 image similarly shows only the north–western emission region, again with a slight east–west extension [McCarthy 1988].
3C441
3C441 (, RA: 22 06 5.0, Dec: 29 29 22, Figures 33, 34) lies in a rather crowded field and, although a narrow band [OII] 3727 image shows none of these [McCarthy 1988], the infrared JK colours of all but two of the galaxies seen in Figure 33 lie in the range JK , consistent with them belonging to a cluster at redshift 0.7 (see Figure 5). The only strong [OII] emission other than that of the radio galaxy arises from a region 12 arcsec north and 8 arcsec west of the host galaxy, slightly beyond the northern radio lobe. A galaxy (RA: 22 06 04.3, Dec: 29 29 39) can be seen just beyond this point in Figure 33, and has the same infrared colour as the host radio galaxy. It is plausible that the [OII] emission is produced by an interaction of the radio jet with this cluster galaxy (deeper radio maps do show a distortion of the radio structures here) but further observations would be needed to confirm this.
The HST image of the host galaxy itself (shown with contours of the radio emission overlaid in Figure 33, and shown enlarged in Figure 34a) reveals a small companion galaxy (‘a’) just to the south–east of the central bright emission. This companion is bluer than the host galaxy, with an f555Wf785LP colour of as compared to . There is also diffuse emission, slightly elongated along the radio axis. The infrared image (Figure 34b) is nearly symmetrical, with a slight extension to the south–west, corresponding to the position of galaxy ‘a’. The galaxy has a very low optical polarisation, measured with no filter [Tadhunter et al. 1992].
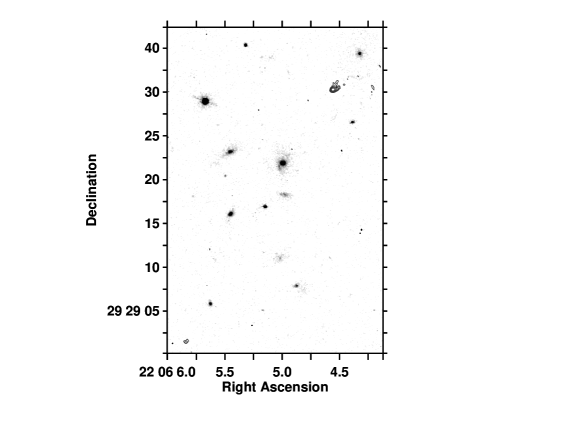
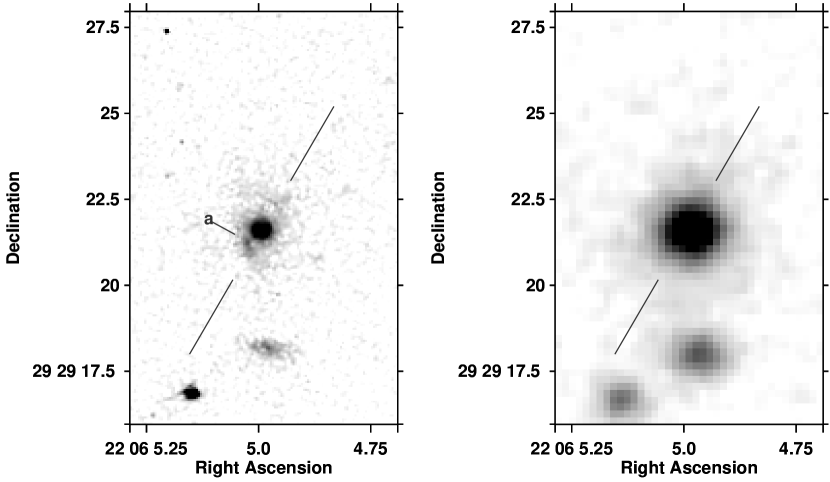
3C470
3C470 (, Figure 35, RA: 23 58 35.9, Dec: 44 04 45.5) is the faintest galaxy in the sample. To make matters worse, a bright star lies 40 arcsecs north–east of 3C470 which results in an enhanced background covering the entire upper–left portion of the image. The HST data have been averaged in blocks of 2 by 2 pixels and smoothed with a 0.2 arcsec Gaussian profile to improve the signal–to–noise ratio. The signal–to–noise ratio in the convolved image is still low, but the galaxy is detected and is seen to consist of two separate components, ‘a’ and ‘b’, which lie on either side of the position of the radio core. Previous ground–based imaging [Le Fèvre & Hammer 1988] had only shown the galaxy to be slightly extended in this direction. The K–band observation shows a similar morphology to the HST image, with an elongation equally misaligned from the radio axis (Figure 35b). This elongation is misaligned from the radio axis by 80 degrees, making this the most misaligned galaxy in the sample.
Being at high redshift, this source is one of the most powerful in the sample. It possesses a reasonably bright radio core (1.2 mJy). The south–western radio lobe is long and thin, and elongated along the radio axis.
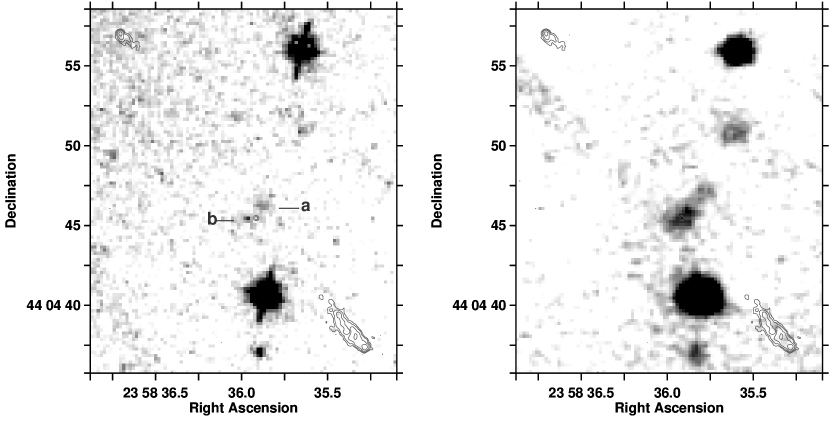
4 Discussion
We shall defer detailed analysis of the multi–wavelength properties of the combined sample of sources to later papers in this series. Here, we make only a few qualitative comments concerning the data presented.
The high resolution of the HST images has provided an unprecedented opportunity to study the morphologies and colours of the distant 3CR radio galaxies on sub–galactic scales, and show them to display a wide range of morphologies. A small number of the galaxies, generally those with redshifts , are fairly compact and symmetrical (prime examples are 3C34 and 3C41), but the majority of the galaxies display some sort of extended emission or alignment effect. The nature of this alignment is remarkably varied: in some sources (eg. 3C226 and 3C441) it is associated with a small companion, close to the host galaxy and positioned along the radio axis — in nearly all cases these companions are significantly bluer than the host galaxy; in other sources (eg. 3C49 and 3C352) there is evidence for only one central emission region, but this is asymmetrical and elongated in the direction of the radio emission; finally, a number of sources show spectacular optical morphologies, with bright strings of knots tightly aligned along the radio axis (eg. 3C266, 3C324 and 3C368), or large diffuse regions of emission surrounding the radio galaxy (eg. 3C239 and 3C265). It is of note, however, that there are a number of sources in the sample which display extended optical emission, but which are significantly misaligned from the radio axis (eg. 3C217, 3C267). Any model to describe the origin of the excess ultraviolet emission must take account of these misaligned sources as well as those which are tightly aligned. It is clear that a combination of different alignment mechanisms will be required to explain all of the properties of these active galaxies.
The infrared images presented do not show the same complexity as the HST data, although their much lower angular resolution would wash out some of the smaller–scale structures. The differences between the optical and infrared images are not, however, simply a resolution effect. This can be seen by examining the infrared images for some of the sources with the most extended optical emission (eg. 3C265, 3C266, 3C324, 3C368): their optical surface brightnesses remain high well beyond the radii at which the infrared surface brightnesses are declining.
Whilst a small number of the infrared images do show an alignment effect, particularly 3C68.2, 3C266 and 3C368, their elongation appears substantially smaller than at optical wavelengths, even taking account of the lower resolution of the infrared images. Those galaxies which don’t show a significant ultraviolet excess appear elliptical in the HST images, consistent with models whereby the spectral energy distribution of these sources is that of an old giant elliptical galaxy population plus a variable–strength flat spectrum aligned component (see also Lilly and Longair 1984, Lilly 1989, Rigler et al. 1992, Dunlop and Peacock 1993, McCarthy 1993 and references therein). The K–band images are generally dominated by the old stellar populations of the galaxies. Those galaxies which do show infrared alignments are amongst the most distant in the sample and possess large optical alignments: in these cases, the flat spectrum aligned emission may make a significant contribution at near–infrared wavelengths, accounting for the observed alignments. We develop this point further in Paper II, where we investigate the infrared emission of the galaxies to quantify the proportion that might be associated with an aligned component, and compare their infrared radial intensity profiles with de Vaucouleurs’ law.
Acknowledgements
This work is based on observations made with the NASA/ESA Hubble Space Telescope, obtained at the Space Telescope Science Institute, which is operated by AURA Inc., under contract from NASA. The National Radio Astronomy Observatory is operated by AURA Inc., under a co-operative agreement with the National Science Foundation. The United Kingdom Infrared Telescope is operated by the Royal Observatory Edinburgh. The authors would like to thank the telescope operators, Thor Wold and Delores Walther, and the scientific advisors, John Davies and Tom Geballe, for advice and assistance during our two UKIRT runs. Thanks are also due to the support scientist team at STScI, in particular Krista Rudloff. PNB acknowledges support from PPARC. HJAR acknowledges support from an EU twinning project, a programme subsidy granted by the Netherlands Organisation for Scientific Research (NWO) and a NATO research grant. This work was supported in part by the Formation and Evolution of Galaxies network set up by the European Commission under contract ERB FMRX– CT96–086 of its TMR programme.
References
- [Barthel 1989] Barthel P. D., 1989, ApJ, 336, 606
- [Begelman & Cioffi 1989] Begelman M. C., Cioffi D. F., 1989, ApJ, 345, L21
- [Best et al. 1995] Best P. N., Bailer D. M., Longair M. S., Riley J. M., 1995, MNRAS, 275, 1171
- [Best et al. 1996] Best P. N., Longair M. S., Röttgering H. J. A., 1996, MNRAS, 280, L9
- [Best et al. 1997a] Best P. N., Longair M. S., Röttgering H. J. A., 1997a, MNRAS, 286, 785
- [Best et al. 1997b] Best P. N., Longair M. S., Röttgering H. J. A., 1997b, MNRAS: submitted.
- [Blundell 1994] Blundell K. M., 1994, Ph.D. thesis, University of Cambridge
- [Burstein & Heiles 1982] Burstein D., Heiles C., 1982, AJ, 87, 1165
- [Chambers et al. 1987] Chambers K. C., Miley G. K., van Breugel W. J. M., 1987, Nat, 329, 604
- [Cimatti et al. 1996] Cimatti A., Dey A., van Breugel W., Antonucci R., Spinrad H., 1996, ApJ, 465, 145
- [Cimatti et al. 1997] Cimatti A., Dey A., van Breugel W., Hurt T., Antonucci R., 1997, ApJ, 476, 677
- [Cimatti et al. 1994] Cimatti A., di Serego Alighieri S., Field G. B., Fosbury R. A. E., 1994, ApJ, 422, 562
- [Cimatti et al. 1993] Cimatti A., di Serego Alighieri S., Fosbury R. A. E., Salvati M., Taylor D., 1993, MNRAS, 264, 421
- [Crawford & Fabian 1993] Crawford C. S., Fabian A. C., 1993, MNRAS, 260, L15
- [Crawford & Fabian 1995] Crawford C. S., Fabian A. C., 1995, MNRAS, 273, 827
- [Crawford & Fabian 1996a] Crawford C. S., Fabian A. C., 1996a, MNRAS, 281, L5
- [Crawford & Fabian 1996b] Crawford C. S., Fabian A. C., 1996b, MNRAS, 282, 1483
- [Daly 1990] Daly R. A., 1990, ApJ, 355, 416
- [De Young 1989] De Young D. S., 1989, ApJ, 342, L59
- [Dey & Spinrad 1996] Dey A., Spinrad H., 1996, ApJ, 459, 133
- [di Serego Alighieri et al. 1993] di Serego Alighieri S., Cimatti A., Fosbury R. A. E., 1993, ApJ, 404, 584
- [di Serego Alighieri et al. 1994] di Serego Alighieri S., Cimatti A., Fosbury R. A. E., 1994, ApJ, 431, 123
- [di Serego Alighieri et al. 1996] di Serego Alighieri S., Cimatti A., Fosbury R. A. E., Perez-Fournon I., 1996, MNRAS, 279, L57
- [di Serego Alighieri et al. 1989] di Serego Alighieri S., Fosbury R. A. E., Quinn P. J., Tadhunter C. N., 1989, Nat, 341, 307
- [Dickinson 1997] Dickinson M., 1997, in et al. N. T., ed., HST and the high redshift Universe; proceedings of the 37th Herstmonceux conference. Cambridge University Press, in press
- [Dickinson et al. 1996] Dickinson M., Dey A., Spinrad H., 1996, in Hippelein H., Meisenheimer K., Röser H.-J., eds, Galaxies in the Young Universe. Springer Verlag, p. 164
- [Dickson et al. 1995] Dickson R., Tadhunter C., Shaw M., Clark N., Morganti R., 1995, MNRAS, 273, L29
- [Djorgovski et al. 1987] Djorgovski S., Spinrad H., Pedelty J., Rudnick L., Stockton A., 1987, AJ, 93, 1307
- [Dunlop 1994] Dunlop J. S., 1994, in Wamsteker W., Longair M. S., Kondo Y., eds, Frontiers of Space & Ground–based Astronomy. Kluwer Academic Publishers, p. 395
- [Dunlop & Peacock 1993] Dunlop J. S., Peacock J., 1993, MNRAS, 263, 936
- [Economou et al. 1995] Economou F., Lawrence A., Ward M. J., Blanco P. R., 1995, MNRAS, 272, L5
- [Eisenhardt & Chokshi 1990] Eisenhardt P., Chokshi A., 1990, ApJ, 351, L9
- [Fabian 1989] Fabian A. C., 1989, MNRAS, 238, 41P
- [Fanaroff & Riley 1974] Fanaroff B. L., Riley J. M., 1974, MNRAS, 167, 31P
- [Fanti et al. 1985] Fanti C., Fanti R., Parma P., Schilizzi R. T., van Breugel W. J. M., 1985, A&A, 143, 292
- [Fanti et al. 1989] Fanti C., Fanti R., Parma P., Venturi T., Schilizzi R. T., Nan Rendong Spencer R. E., Muxlow T. W. B., van Breugel W. J. M., 1989, A&A, 217, 44
- [Fernini et al. 1993] Fernini I., Burns J. O., Bridle A. H., Perley R. A., 1993, AJ, 105, 1690
- [Giavalisco et al. 1996] Giavalisco M., Livio M., Bohlin R. C., Macchetto F. D., Stecher T. P., 1996, AJ, 112, 369
- [Hammer & Le Fèvre 1990] Hammer F., Le Fèvre O., 1990, ApJ, 357, 38
- [Hammer et al. 1993] Hammer F., Le Fèvre O., Angonin M. C., 1993, Nat, 362, 324
- [Hammer et al. 1991] Hammer F., Le Fèvre O., Proust D., 1991, ApJ, 374, 91
- [Hammer et al. 1986] Hammer F., Nottale L., Le Fèvre O., 1986, A&A, 169, L1
- [Hippelein & Meisenheimer 1992] Hippelein H., Meisenheimer K., 1992, A&A, 264, 472
- [Holtzman et al. 1995] Holtzman J. A., Burrows C. J., Casertano S., Hester J. J., Trauger J. T., Watson A. M., Worthey G., 1995, PASP, 107, 1065
- [Jackson & Rawlings 1997] Jackson N., Rawlings S., 1997, MNRAS, in press
- [Jannuzi & Elston 1991] Jannuzi B. T., Elston R., 1991, ApJ, 366, L69
- [Johnson et al. 1995] Johnson R. A., Leahy J. P., Garrington S. T., 1995, MNRAS, 273, 877
- [Lacy & Rawlings 1994] Lacy M., Rawlings S., 1994, MNRAS, 270, 431
- [Lacy et al. 1995] Lacy M., Rawlings S., Eales S., Dunlop J. S., 1995, MNRAS, 273, 821
- [Laing et al. 1983] Laing R. A., Riley J. M., Longair M. S., 1983, MNRAS, 204, 151
- [Lauer 1989] Lauer T. R., 1989, PASP, 101, 445
- [Law-Green et al. 1997] Law-Green J. D. B., Best P. N., Nair S., Leahy J. P., Longair M. S., 1997, MNRAS: submitted.
- [Le Fèvre & Hammer 1988] Le Fèvre O., Hammer F., 1988, ApJ, 333, L37
- [Le Fèvre et al. 1988a] Le Fèvre O., Hammer F., Jones J., 1988a, ApJ, 331, L73
- [Le Fèvre et al. 1987] Le Fèvre O., Hammer F., Nottale L., Mathez G., 1987, Nat, 326, 268
- [Le Fèvre et al. 1988b] Le Fèvre O., Hammer F., Nottale L., Mazure A., Christian C., 1988b, ApJ, 324, L1
- [Leahy & Perley 1991] Leahy J. P., Perley R. A., 1991, AJ, 102, 537
- [Lilly 1989] Lilly S. J., 1989, ApJ, 340, 77
- [Lilly & Longair 1984] Lilly S. J., Longair M. S., 1984, MNRAS, 211, 833
- [Liu & Pooley 1991] Liu R., Pooley G., 1991, MNRAS, 253, 669
- [Liu et al. 1992] Liu R., Pooley G., Riley J. M., 1992, MNRAS, 257, 545
- [Longair et al. 1995] Longair M. S., Best P. N., Röttgering H. J. A., 1995, MNRAS, 275, L47
- [Maddox et al. 1990] Maddox S. J., Sutherland W. J., Efstathiou G., Loveday J., 1990, MNRAS, 243, 692
- [McCarthy 1988] McCarthy P. J., 1988, Ph.D. thesis, University of California, Berkeley
- [McCarthy 1993] McCarthy P. J., 1993, ARA&A, 31, 639
- [McCarthy et al. 1987] McCarthy P. J., van Breugel W. J. M., Spinrad H., Djorgovski S., 1987, ApJ, 321, L29
- [Meisenheimer & Hippelein 1992] Meisenheimer K., Hippelein H., 1992, A&A, 264, 455
- [Pacholczyk 1970] Pacholczyk A. G., 1970, Radio Astrophysics. Freeman, San Francisco
- [Pedelty et al. 1989a] Pedelty J. A., Rudnick L., McCarthy P. J., Spinrad H., 1989a, AJ, 97, 647
- [Pedelty et al. 1989b] Pedelty J. A., Rudnick L., McCarthy P. J., Spinrad H., 1989b, AJ, 98, 1232
- [Perley 1989] Perley R. A., 1989, in Perley R. A., Schwab F. R., Bridle A. H., eds, ASP Conf. Ser. Vol 6, Synthesis Imaging in Radio Astronomy. Astronomical Society of the Pacific, p. 259
- [Perryman et al. 1984] Perryman M. A. C., Lilly S. J., Longair M. S., Downes A. J. B., 1984, MNRAS, 209, 159
- [Rawlings et al. 1991] Rawlings S., Eales S., Lacy M., 1991, MNRAS, 251, 17P
- [Rawlings et al. 1995] Rawlings S., Lacy M., Sivia D. S., Eales S. A., 1995, MNRAS, 274, 428
- [Rees 1989] Rees M. J., 1989, MNRAS, 239, 1P
- [Rigler & Lilly 1994] Rigler M. A., Lilly S. J., 1994, ApJ, 427, L79
- [Rigler et al. 1992] Rigler M. A., Lilly S. J., Stockton A., Hammer F., Le Fèvre O., 1992, ApJ, 385, 61
- [Sanghera et al. 1995] Sanghera H. S., Saikia D. J., Lüdke E., Spencer R. E., Foulsham P. A., Akujor C. E., Tzioumis A. K., 1995, A&A, 295, 629
- [Scarrott et al. 1990] Scarrott S. M., Rolph C. D., Tadhunter C. N., 1990, MNRAS, 243, 5P
- [Smith et al. 1979] Smith H. E., Junkkarinen V. T., Spinrad H., Grueff G., Vigotti M., 1979, ApJ, 231, 307
- [Spinrad 1982] Spinrad H., 1982, PASP, 94, 397
- [Spinrad & Djorgovski 1984] Spinrad H., Djorgovski S., 1984, ApJ, 285, L49
- [Spinrad et al. 1985] Spinrad H., Filippenko A., Wyckoff S., Stocke J., Wagner M., Lawrie D., 1985, ApJ, 299, L7
- [Stockton et al. 1995] Stockton A., Kellogg M., Ridgway S. E., 1995, ApJ, 443, L69
- [Stockton et al. 1996] Stockton A., Ridgway S. E., Kellogg M., 1996, AJ, 112, 902
- [Tadhunter 1991] Tadhunter C. N., 1991, MNRAS, 251, 46P
- [Tadhunter et al. 1992] Tadhunter C. N., Scarrott S. M., Draper P., Rolph C., 1992, MNRAS, 256, 53P
- [van Breugel et al. 1992] van Breugel W. J. M., Fanti C., Fanti R., Stanghellini C., Schilizzi R. T., Spencer R. E., 1992, A&A, 256, 56
- [Worrall et al. 1994] Worrall D. M., Lawrence C. R., Pearson T. R., Readhead A. C. S., 1994, ApJ, 420, L17