Rapid infrared flares in GRS 1915+105 : evidence for infrared synchrotron emission
Abstract
We report imaging photometry of the radio-jet black hole candidate source GRS 1915+105 in the infrared K band. The observations reveal rapid infrared flare events on timescales of less than an hour. These events are strikingly similar to those regularly observed in radio monitoring at 15 GHz. Furthermore, when dereddened, the infrared events have comparable amplitudes to the radio oscillations, and observations at 15 GHz made hr after our infrared observations reveal that the source was indeed displaying radio oscillations at this time. We suggest that we have observed infrared synchrotron emission from this source. We estimate the equipartition magnetic field and power required to accelerate the particles for the repeated radio events, and find both to be orders of magnitude greater than those estimated for any other X-ray binary.
Comparison of events at 15 GHz and 2.2 m suggests that the dominant loss mechanism is adiabatic expansion, which in turn implies that each event corresponds to a small ejection of material from the system.
keywords:
binaries: close – stars : individual : GRS 1915+105 – infrared : stars – radio continuum : stars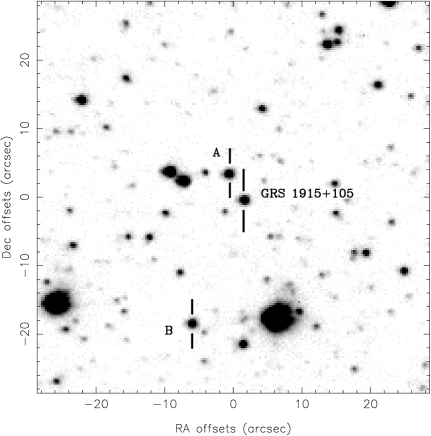
1 Introduction
GRS 1915+105 was discovered by the WATCH instrument on board the Granat satellite on 1992 August 15 (Castro-Tirado et al. 1992). A radio counterpart was subsequently identified, and in a series of remarkable observations Mirabel & Rodríguez (1994) discovered apparent superluminal motions in jet-like outflows from the source, interpreted as a bipolar outflow with bulk velocity c. Radio monitoring of the source at 15 GHz has also revealed quasi-periodic events with periods in the range 20 – 120 min (Pooley 1995, 1996, 1997, Pooley & Fender 1997).
The source has no observed optical counterpart, due to heavy extinction in the Galactic plane (see below), and its true nature remains uncertain. The X-ray flaring and hard X-ray emission of the source suggest a black-hole transient system (e.g. Finoguenov et al. 1994), but the binarity of the system has yet to be definitively established by any modulation at a likely orbital period.
GRS 1915+105 displays exceedingly rich behaviour in X-rays, including very rapid large amplitude flaring on timescales of minutes (e.g. Greiner, Morgan & Remillard 1996; Belloni et al. 1997). The hard X-ray behaviour seems to be coupled to the radio emission over long timescales (Foster et al. 1996).
Spectroscopy of the infrared counterpart has revealed emission lines of HeI and HI, and possibly also HeII, which have been interpreted as arising in an accretion disc (Castro-Tirado, Geballe & Lund 1996). However, Mirabel et al. (1997) suggest that the emission lines may arise in the circumstellar environment of a Be star in a high-mass X-ray binary system.
1.1 Previous infrared imaging and photometry
The infrared counterpart to GRS 1915+105 was discovered independently by Mirabel et al. (1994) and Castro-Tirado et al. (1993) in the J, H & K photometric bands. The K-magnitude was observed to vary between 13.0 – 14.3, and the JHK colours suggested a heavily reddened object. Boër et al. (1995) have detected a faint (I=23.4) red-optical counterpart.
Sams, Eckart & Sunyaev (1996a) made high-resolution K-band observations with a speckle-imaging technique which revealed an infrared ‘jet’ of about 0.5 arcsec extent aligned at the same position angle as the radio jet, when the source was in a bright (K=12.5) state. Subsequent observations with the same technique, when the source was again in a bright state (K=12.3) failed to reproduce this result (Sams, Eckart & Sunyaev 1996b). Eikenberry & Fazio (1997) and Chaty & Mirabel (1997) describe further infrared imaging which shows no evidence for a jet, and use this to place upper limits of the order of days for the radiative lifetime of the emission.
Further photometry by Chaty et al. (1996) and Mirabel et al. (1996) has revealed infrared variability in the J, H & K bands on timescales of hours and longer. In particular, Mirabel et al. (1996) report one event in which GRS 1915+105 becomes brighter ( mag) and redder ( mag) in the near-infrared a few days after a major radio and X-ray outburst. They intepret this as resulting from an interaction between jet ejecta and a dust cloud lying several hundred A.U. from the source.
2 Observations
Our infrared observations were carried out at UKIRT on 1996 October 22, with IRCAM3, a imaging array operating in the m wavelength range. Conditions were photometric and seeing varying between 0.8 – 1.2 arcsec. Over a hr period we obtained 145 K-band images of GRS 1915+105. Each image is a sum of five 4-sec exposures, giving a total of 2900 sec on-source. Effective time resolution is of order 30 sec. Flux calibration was achieved using G21-15, for which we assumed K=11.757. The observations were carried out in service mode, and were arranged to be simultaneous with pointed OSSE hard X-ray observations (to be reported elsewhere). Data reduction was carried out using the IRCAMDR software on the STARLINK node at Sussex University.
A single 20-sec K-band image of the field of GRS 1915+105 is shown in Fig 1. The imaging is not of high enough resolution to look for the infrared ‘jet’ of Sams, Eckart & Sunyaev (1996a). Indicated on the image are GRS 1915+105 and two nearby stars of similar brightness, labelled ‘A’ and ‘B’, which were used for relative photometry (see below). Extended emission on arcsec scales, reported at radio wavelengths by Newell, Spencer & Jowett (1996), and our original motivation for deep infrared imaging of the field, is not detected.
Photometry was performed on each of the 145 individual frames, with a 5 arcsec software aperture. Magnitudes were measured for GRS 1915+105, star ‘A’ and star ‘B’ in every frame (except for a few where ‘B’ dropped off the edge of the image). Stars ‘A’ and ‘B’ then provided an indication of how changing conditions were affecting the observations. The mean magnitudes of ‘A’ and ‘B’ were and respectively.
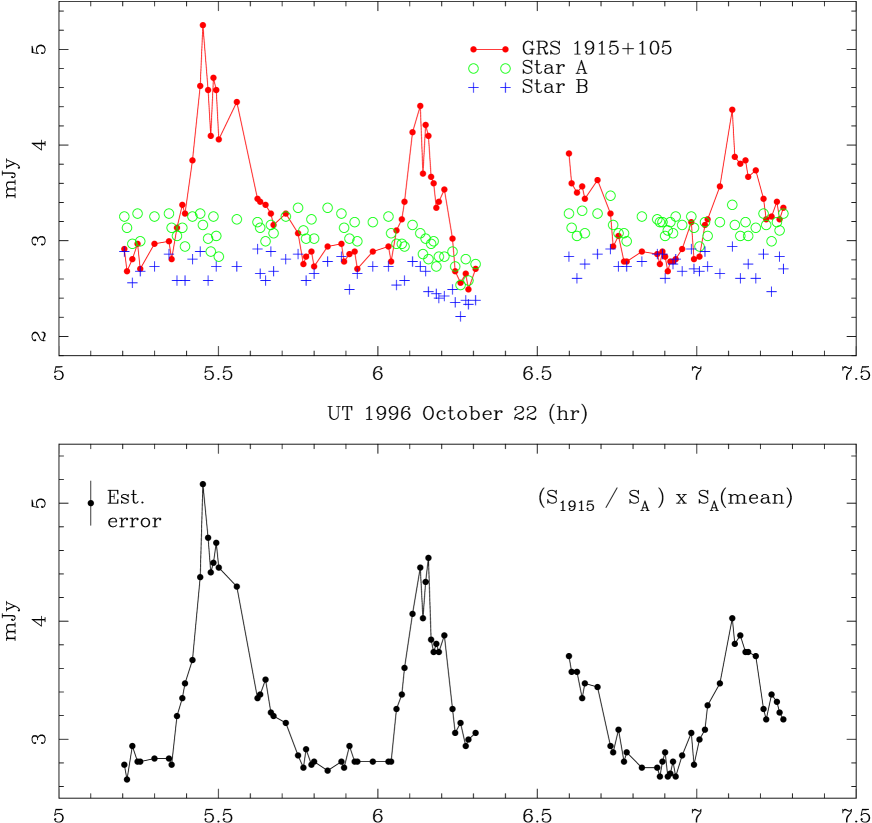
Fig 2(a) shows the flux densities of GRS 1915+105, ‘A’ and ‘B’ plotted against time. It is clear that ‘A’ and ‘B’ are changing together, as a result of a varying atmosphere, and that the dramatic variability in flux from GRS 1915+105 is real. Dividing the flux from GRS 1915+105 by that of star ‘A’ (Fig 2(b)) for each frame, and then multiplying by the mean value for ‘A’, provides a good compensation for varying conditions. This is especially evident in the constant flux levels at about 2.8 mJy (K=13.36) for GRS 1915+105 between flare events.
Radio observations reported here are drawn from a subset of those to be presented in Pooley & Fender (1997), in which the observational procedure will be described in detail.
3 Discussion
3.1 Dereddening
In order to compare the infrared flares meaningfully with both the rapid radio variability repeatedly observed from GRS 1915+105, and with similar infrared events observed in other sources (in particular Cygnus X-3) it is necessary to deredden the observed flux densities. Optical extinction to the source has been estimated to be in the range 26 – 33 magnitudes (Mirabel et al. 1994; Chaty et al. 1997). This is consistent with K-band extinctions in the range 2.9 – 3.7 mag (Rieke & Lebofsky 1984) though the exact AV:AK relation is uncertain and direction-dependent in the Galactic plane (Mathis 1990).
We choose a value of AK = 3.3 mag (corresponding to A mag) to deredden the K-band fluxes by. However, it should be noted that the uncertainty in the reddening to the source introduces an uncertainty of at least 40% in any quoted luminosities.
3.2 Comparison with radio events
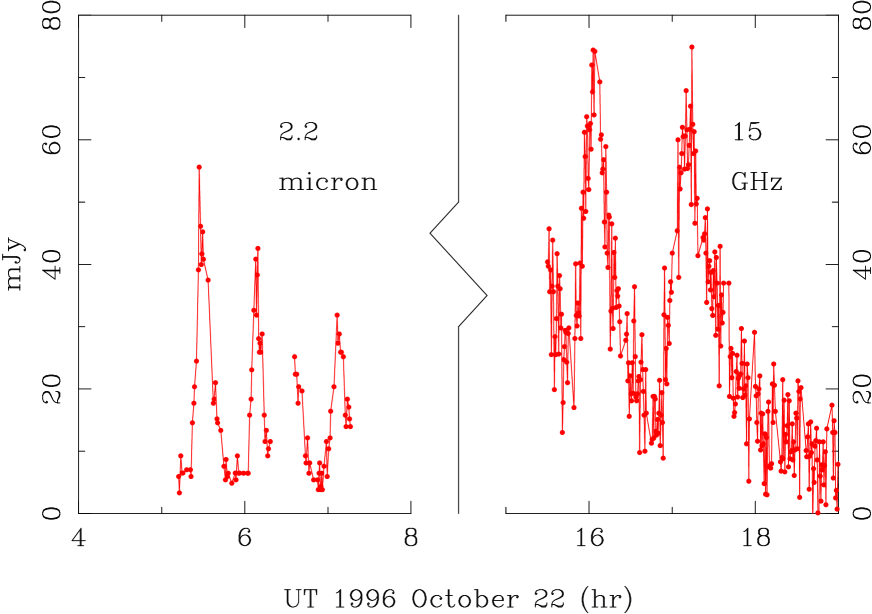
Due to longitudinal differences, radio observations with the Ryle Telescope were not possible until hr after our infrared observations. Figure 3 plots both the dereddened infrared flux densities and the radio observations on the same scale. A value of 2.5 mJy has been subtracted from the infrared data prior to dereddening, as a quiescent baseline.
It is immediately obvious the radio oscillations of the type reported by Pooley (1995, 1996, 1997) and Pooley & Fender (1997) were occuring at this time. The similarity between the variability in the infrared and the radio is striking. The amplitude of the events is very similar, as are their rise, decay and recurrence timescales. The first two infrared flares are separated by min, a ‘period’ often found in the radio oscillations. The recurrence timescale of the radio oscillations observed 8 hr later is actually slightly longer, but ‘period’ changes of this type are commonly observed in the radio monitoring (Pooley & Fender 1997).
| Synchrotron luminosity | Equipartition magnetic | Minimum energy in | Minimum power into |
| (erg s-1) | field (Gauss) | each event (erg) | particle acceleration (erg s-1) |
3.3 Energy in synchrotron events
If the infrared flares are synchrotron in origin, we can evaluate the equipartition magnetic field for these events in order to determine the minimum energy required for their generation. Assuming a distance of 12.5 kpc and a flat spectrum (spectral index ) from 15 GHz to 2.2 m, the source has a synchrotron luminosity of erg s-1 during these outbursts (the luminosity is completely dominated by the high-frequency infrared tail of the emission). Assuming a volume for the electron cloud of a sphere of radius 5 light min (from the rise time of the events), and a filling factor of unity, we can estimate an equipartition magnetic field and energy. The derived magnetic field is Gauss, the total energy erg. While there is no reason to assume the source to be in equipartition, shifting the magnetic field to higher or lower values rapidly increases the energy associated with each oscillation; we can therefore consider erg to be a lower limit on the energy required to generate each event.
It should also be noted that our calculation is for an intrinsic synchrotron spectral index of zero; the common interpretation of a flat synchrotron spectrum as arising from an inhomogenous source with varying degrees of absorption again increases the inferred synchrotron luminosity and hence energy associated with each oscillation. Furthermore, we do not consider effects naturally associated with the jets, i.e. acceleration to relativistic velocities and Doppler de-boosting, both of which will again increase the required energy budget.
Assuming that the magnetic field does not decay, and can be re-used by subsequent populations of accelerated particles, we find that GRS 1915+105 is required to input erg s-1 into the acceleration of particles in order to produce one such flare event every 30 min (we stress that we have not considered any bulk acceleration of material when arriving at this minimum power requirement). In a 8 G field, particles of energies GeV are required to produce synchrotron emission at 2.2 m. The lifetime of such particles to synchrotron losses would be of order 1 hr, significantly longer than that observed here. Furthermore, the characteristics timescale for flux density decays due to synchrotron or inverse Compton losses are frquency dependent, varying as . If these were the dominant loss mechanisms, we would therefore expect to see decay timescales times shorter at 2.2 m than at 15 GHz. This is not however observed, and the favoured decay mechanism must instead be adiabatic expansion losses, which produce the same decay rate at all frequencies.
The observed and derived parameters of the oscillations are summarized in table 1.
3.4 Comparison with infrared flares in other objects
The infrared flaring reported here is reminiscent of that observed in Cygnus X-3 (e.g. Fender et al. 1996), in which flare complexes can rise in less than a minute and persist for up to an hour. Two-colour analysis of Cyg X-3 flares (Fender et al. 1996) suggested an origin in a hot ( K) optically thin plasma, possibly associated with jets and/or the inner accretion disc (although infrared synchrotron emission was not ruled out). Given uncertainties in distance and reddening to both sources, the infrared flares reported here are the same luminosity as those observed in Cyg X-3.
Circinus X-1, related to GRS 1915+105 and Cyg X-3 in being a radio-bright X-ray binary, undergoes infrared flaring once every 16.6 days (Glass 1994). The flares are of longer duration (over a day) than those observed in GRS 1915+105 and Cyg X-3, but again are correlated with radio behaviour, and have no satisfactory explanation to date.
4 Conclusions
We have observed GRS 1915+105 with high time resolution in the infrared K-band and found flaring/oscillation events on timescales of min which have striking morphological similarities to oscillations often observed at high radio frequencies. When dereddened, the infrared events are found to have (within uncertainties primarily related to the dereddening) the same amplitude as radio events observed from the source some eight hours later. We suggest that the infrared and radio events have a common origin in synchrotron emission. This supports the preferred explanation of Sams et al. (1996a) that they were observing synchrotron emission from the infrared jet, and is consistent with a reddening of the source during outbursts without the need to include a dust component.
If the synchrotron interpretation is correct, then the synchrotron luminosity of GRS 1915+105 becomes very large, of order 1036 erg, compared to other Galactic sources. However, it should be noted that previous estimates of the synchrotron luminosities of X-ray binaries are based upon an extrapolation of optically thin spectra from cm wavelengths, and the high-frequency form of the synchrotron spectrum is not well known for these sources. For GRS 1915+105, calculation of equipartition magnetic field and minimum energy associated with an oscillation, based upon the luminosity and size constraints implied by the rise times, produces values of G and erg respectively.
The dominant mechanism causing the decay of the emission is determined to be adiabatic expansion losses from the similarity of characteristic decay times at two wavelengths four orders of magnitude apart. This in turn implies that each oscillation event corresponds to a small ejection of material from the system, and is not consistent with radiative losses suffered by a confined emission region. Synchrotron losses will become more important for observations at shorter wavelengths. For the equipartition magnetic field of G, the radiative lifetime would be shorter than the expansion lifetime at wavelengths of m and shorter, producing a turnover in the synchrotron spectrum during the decay phase of any oscillations.
Acknowledgements
We would like to thank Vivek Dhawan, Bob Hjellming and Rob Hynes for useful discussions. We would like to thank the service team at UKIRT, which is operated by The Observatories on behalf of the PPARC, and the staff at MRAO for maintenance and operation of the Ryle Telescope, which is supported by the PPARC.
References
- [] Belloni T., Mendez M., King A.R., ven der Klis M., van Paradijs J., 1997, ApJ, 479, L145
- [] Castro-Tirado A., Geballe T.R., Lund N., 1996, ApJ, 461, L99
- [] Castro-Tirado A. et al., 1992, I.A.U.Circ 5590
- [] Castro-Tirado A. et al., 1993, I.A.U.Circ 5830
- [] Chaty S., Mirabel L.F., 1997, In Proc. XXXIInd Rencontres de Moriond Proceedings ‘Very high energy phenomena in the Universe’, in press
- [] Chaty S., Mirabel I.F., Duc P.A., Wink J.E., RodríguezL.F., 1996, A&A, 310, 825
- [] Eikenberry S.S., Fazio G.G., 1997, ApJ, 475, L53
- [] Finoguenov F. et al., 1994, ApJ, 424, 940
- [] Fender R.P., Bell Burnell S.J., Williams P.M., Webster A.S., 1996, MNRAS, 283, 798
- [] Foster R.S., Waltman E.B., Tavani M., Harmon B.A., Zhang S.N., Paciesas W.S., Ghigo F.D., 1996, ApJ, 467, L81
- [] Glass I.S., 1994, MNRAS, 268, 742
- [] Greiner J., Morgan E.H., Remillard R.A., 1996, ApJ, 473, L107
- [] Mathis J.S., 1990, ARA&A, 28, 37
- [] Mirabel I.F., Rodríguez L.F., 1994, Nature, 371, 46
- [] Mirabel I.F. et al., 1994, A&A, 282, L17
- [] Mirabel I.F., Rodríguez L.F., Chaty S., Sauvage M., Gerard E., Duc P.-A., Castro-Tirado A., Callanan P., 1996, ApJ, 472, L111
- [] Mirabel I.F., Bandyopadhyay R., Charles P.A., Shabhaz T., Rodriguez L.F., 1997, ApJ, 477, L45
- [] Newell S.J., Spencer R.E., Jowett F.H., 1996, In ‘Radio emission from the stars and The Sun’, ASP conf. ser. vol. 93, eds Taylor A.R. & Paredes J.M., Barcelona, p.240
- [] Pooley G.G., 1995, I.A.U. Circ 6269
- [] Pooley G.G., 1996, I.A.U. Circ 6411
- [] Pooley G.G., 1997, Vistas in Astronomy, 41, 17
- [] Pooley G.G., Fender R.P., 1997, MNRAS, submitted
- [] Rieke G.H., Lebofsky M.J., 1984, ApJ, 288, 618
- [] Rodriguez L.F., Mirabel I.F., ApJ, 474, L123
- [] Sams B., Eckart A., Sunyaev R., 1996a, Nature, 382, 47
- [] Sams B., Eckart A., Sunyaev R., 1996b, I.A.U.Circ 6455