OH SATELLITE LINE MASERS AND AN AGN CANDIDATE IN M82
Abstract
We report the detection of OH satellite line masers at 1720 MHz and 1612 MHz from the nuclear region of the starburst galaxy M82. The observations were aimed at detecting 1720 MHz maser emission from the known radio emitting SNR in the nuclear region. At 1720 MHz we detect six features above the 5 limit set by noise, four in emission and two in absorption. Three of the emission features appear closely associated with known discrete continuum radio sources, and one of the absorption features is precisely coincident with the discrete continuum source 44.01+59.6. The latter source also exhibits strong 1612 MHz emission at the same velocity. No other 1612 MHz features were detected. All of the 1720 MHz emission features are consistent with masers pumped by collisions with molecular hydrogen at densities between cm-3 and 105 cm-3, and Tk between 50 K and 250 K. The absorption and emission associated with the two satellite lines in 44.01+59.6, together with other evidence, points to the possibility that this source is the AGN in M82.
1 INTRODUCTION
M82 is the nearest (D Mpc) and therefore most well studied starburst galaxy, since its features may be examined at high luminosity sensitivity and high linear resolution. The inner 1 kpc region contains a large population of discrete luminous radio sources presumed to represent primarily a population of radio emitting SNR (e.g., Kronberg, Biermann, & Schwab 1985; Muxlow et al. 1994). Their high radio luminosity stems from the interaction of the ejecta with the surrounding dense molecular clouds responsible for star formation. Here we present a report of the first search for satellite OH maser line emission at 1720 MHz and 1612 MHz associated with this SNR population using the Very Large Array. Such features are observable in about 10% of all galactic SNR (Frail et al. 1996), and are also found to be associated with the source Sgr A East in the central region of the Galaxy (Yusef-Zadeh et al. 1996). These masers are probably associated with pumping by collisions with H2 molecules in SNR shocks, in accordance with the models by Elitzur (1976). The shock conditions present in the SNR of M82 would therefore be expected to produce 1720 MHz masers similar to those found in our Galaxy, and possibly with much higher luminosity.
2 OBSERVATIONS
Observations were made of M82 in the two OH satellite lines at 1720.527 MHz and 1612.231 MHz on November 17, 1996, using the Very Large Array of the National Radio Astronomy Observatory.111The National Radio Astronomy Observatory is a facility of the National Science Foundation, operated under a cooperative agreement by Associated Universities, Inc. The VLA correlator was configured to observe a 3.125 MHz bandwidth centered on a LSR velocity of 200 km s-1, close to the systemic velocity of M82. The bandwidth was divided into 128 spectral channels, providing a velocity resolution of 4.3 km s-1and 4.5 km s-1 at 1720 MHz and 1612 MHz, respectively. Only right handed circular polarization was recorded at each frequency. The data were amplitude, phase, and passband calibrated according to standard VLA procedures using the AIPS software package. Self–calibration of the strong continuum of M82 allowed some additional improvement in the dynamic range at both frequencies. The continuum was subtracted from the u–v visibility data using the AIPS task UVLIN which linearly interpolates the continuum across the region containing the line emission. Maps were made using both natural and robust weighting, with the latter giving an improvement in resolution of 40% at the expense of an increase of 20% in the rms noise level. Considerable interference was detected at 1612 MHz from the Glonass satellite system. After careful editing, the resulting rms noise per channel is 0.7 mJy at 1720 MHz and 1.7 mJy at 1612 MHz.
The individual spectral channel maps were inspected to search for features greater than five times the rms noise (i.e., 5), and Gaussian fits were made to derive the parameters of these features. The peak flux densities were determined from the naturally weighted data while the positions were determined from the robust weighted data (Table 1).
3 RESULTS
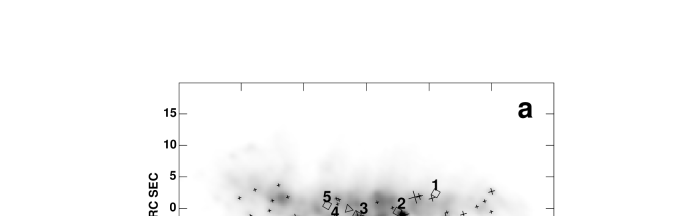
The features which were found to be at the level of 5 or greater at 1720 MHz are shown in Table 1 together with estimates of their measured parameters. Also shown are the flux densities (S), or their upper limits, for any associated features at 1612 MHz. None of the features were significantly resolved by the beam () of the robust weighted maps. Figure 1(a) shows the locations of these features on the 1720 MHz continuum map, which is also labeled with the locations of the radio SNR cataloged by Kronberg et al. (1985). Figure 1(b) shows the same features on a position–velocity (p–v) contour plot of the CO emission along the major axis, adapted from Shen & Lo (1995). The position of each feature is represented by its location projected onto the major axis. Figure 2 shows the individual spectra from slices through the data cube at the maximum brightness of the features on the channel maps. Note that the data cube for the 6 features listed in Table 1 contains independent points, which leads to a Gaussian probability of 20% for finding a noise feature in the cube at the level or greater. Thus, one of the observed features could be spurious.
The 1720 MHz features (1), (2), (3), and (6) are seen in emission whereas (4) and (5) are in absorption. Features (1)–(4) appear associated with discrete continuum sources, showing maximum displacements of 1 (15 pc projected separation). Features (5) and (6) do not appear associated with discrete continuum sources. Instead, feature (5) appears in absorption against the background continuum and the emission feature (6) is displaced well to the south of the radio continuum disk and may be a noise feature, in accordance with the probability computation above. Note however that the latter does appear superposed on a sub–mm dust continuum feature projecting southward from the disk on the maps of Hughes, Gear, & Robson (1994) and Kruegel et al. (1990). Feature (2) is located roughly midway between two SNR, approximately 1 NE of the brightest and most compact SNR 41.95+57.5, using the designation by Muxlow et al. (1994). It is displaced in position by about 1 and in velocity by about km s-1 with respect to the main line 1667 MHz maser m2 identified by Weliachew, Fomalont, & Greisen (1984), and its flux density at 1720 MHz is about is a factor of 8 or 9 weaker than feature m2 at 1667 MHz. Feature (4) is the most interesting one, since it is unique in two respects. It exhibits both 1720 MHz absorption and bright 1612 MHz emission at the same velocity, and it is the only feature precisely coincident with a discrete source, in this case 44.01+59.6.
Figure 1(b) shows that the velocities of the features follow the general pattern associated with rotation of the molecular ring of radius 250 pc in the nucleus of M82, although some of the them are displaced by up to 100 km s-1, possibly signifying their association with velocity disturbances in shocks. Features (1)–(4) exhibit the same kinematic signature in the p–v plot as the ridge of maximum brightness in CO, signifying the association with star forming regions. Feature (2) is located at the western end of a feature associated with the inner nuclear ring of ionized gas, identified for example by Goetz et al. (1990) and Achtermann & Lacy (1995).
3.1 The Physical Origin of the Features
All of the 1720 MHz emission features are unresolved, and have T 500 K, consistent with maser action. The 1612 MHz feature associated with (4) has T 5000 K. The mean monochromatic luminosity () of the observed 1720 MHz masers ( Jy-kpc2) is about two orders of magnitude greater than the most luminous components of the counterparts in galactic SNR (e.g., Jy-kpc2 for W28) observed by Frail et al. (1994) and a factor of about 30 greater than the integrated luminosity of the masers ( Jy-kpc2) in the Galactic center observed by Yusef–Zadeh et al. (1996). This may possibly be accounted for by a large number of components within the synthesized beam, which has a projected diameter of about 17 pc at the distance of M82.
Features (1), (3), (5) and (6) have no associated main line masers. Therefore they probably have the same origin as their counterparts associated with galactic SNR, and are presumably pumped by collisions with H2 molecules. Collisional pumping is most efficient when the density and temperature are in the range and and 25 K 200 K respectively (Elitzur 1976). These conditions overlap readily with the conditions found in molecular clouds in M82, though temperatures in the higher part of this range would require shock heating, since the ambient kinetic temperature for molecular clouds in M82 is about 45 K (e.g., Wild et al. 1992). Feature (2) is associated with a main line maser, and it is probably located in an HII complex in this region, since both main line and satellite line masers are sometimes observed together in galactic HII regions (Gaume & Mutel 1987). The absorption and emission found together in feature (4), and their precise coincidence with one of the discrete continuum source suggest a different origin. We discuss this feature separately.
3.2 An AGN Candidate?
The prominence of the brightest compact source 41.95+57.5 led to an early suggestion that it may be a nuclear radio source associated with the nucleus of M82 (Kronberg & Wilkinson 1975). However, its structure, radio spectrum, and variability are consistent with its current interpretation as a SNR (e.g., Huang et al. 1994). Muxlow et al. (1994) also suggested that the source 43.31+59.2, closer to the 2.2 peak, might be associated with the AGN, but the absence of a low frequency turnover, signifying a low free–free optical depth, indicates that it is located on the near side of the ionized gas distribution (Wills et al. 1997). The latter authors also suggested that the source 44.01+59.6 is a more likely AGN candidate. It has a strong turnover and a positive high frequency spectral index, expected for an AGN source. Our OH data support this latter suggestion, and we now examine the properties of this source in more detail.
Both the 1720 MHz absorption and the 1612 MHz emission in feature (4) are coincident in velocity and are spatially coincident with the source 44.01+59.6. The continuum source is very compact with a diameter of 0.8 pc (Muxlow et al. 1994), and, as noted above, it has been suggested as a possible AGN candidate by Wills et al. (1997) on the basis of its unusual radio spectrum. It is also one of four discrete radio sources coincident with discrete X-ray sources identified by Watson, Stanger, & Griffiths (1984), and it is coincident with a super star cluster (e.g., O’Connell et al. 1994). It is near the 2.2 nucleus and the kinematic center, and it is the site of the highest ratio of HCO+/CO in M82 (Seaquist et al., in preparation), signifying that this region also has the highest molecular gas density and/or ionization. The former property is reminiscent of the high HCN/CO ratio in the nucleus of NGC 1068 (Helfer & Blitz 1995). Finally, the combined absorption/emission resembles the OH properties of the AGN in Cen A observed by van Langevelde et al. (1995). These authors associate the OH features in Cen A with a maser pumped by far IR in a molecular cloud possibly in a circumnuclear torus associated the AGN. Thus, our observations and other indicators lend support to the suggestion by Wills et al. (1997) that 44.01+59.6 is the AGN of M82, and that the OH features are associated with a circumnuclear disk or torus.
The opposite behavior in the two satellite transitions associated with 44.01+59.6 may be used to investigate the characteristics of the absorbing cloud. This effect occurs when the relevant hyperfine levels in the ground state compete for the same IR pump photons associated with transitions between the ground state and the first excited states in the (119) and (79) states (e.g., Elitzur 1992). When both rotational transitions are optically thick, it leads to stimulated absorption at 1720 MHz and stimulated emission at 1612 MHz with equivalent optical depths. The required OH column density in the masering cloud is given by (km s, where is the line width. If the optical depth in the masering lines is low, then amplification of the continuum would lead to conjugate emission and absorption in the satellite lines, as is the case for Cen A. The greater line/continuum ratio in emission in M82 indicates , and the ratio of the line strengths then permits an estimate of the optical depth and covering factor of the absorbing gas. If we assume conjugate optical depths against the discrete continuum source at 1720 MHz and 1612 MHz, the inferred line/continuum ratios of and respectively (referred to the flux of the discrete source) lead to an optical depth of 1.9 and a covering factor of 0.5.
The foregoing considerations in turn lead to estimates of the absorbing cloud properties as follows. Using a line width of 13 km s-1 (Table 1), we obtain a lower limit to the OH column density of cm-2. Adopting an OH/H2 abundance ratio of , similar to that derived for Cen A by van Langevelde et al. (1995), and a (spherical) cloud diameter of pc, based on the size of 44.01+59.6 and the covering factor of less than unity, we obtain a lower limit on the H2 density of cm-3, with an uncertainty of perhaps an order of magnitude. This density is similar to the densities in the molecular clouds in M82, and to the absorbing cloud associated with OH absorption in Cen A.
4 SUMMARY
In conclusion, we find satellite line OH masers at 1720 MHz near three SNR in M82, one maser south of the central disk, one feature in absorption against the disk radio continuum, and a feature with both absorption and emission at respectively 1720 MHz and 1612 MHz. The position of the feature showing both emission and absorption (feature [4]) is precisely coincident with the discrete source 44.01+59.6. We conclude that it is probable that features (1), (2), and (3) are produced by the collisional pumping by dense molecular gas associated with star formation near the radio SNR, but are not necessarily a direct consequence of the SNR themselves. The behavior in feature (4) associated with 44.01+59.6 bears a strong similarity to that of the satellite OH lines in the AGN of Cen A. This similarity, along with other evidence, supports the view that this discrete source is the AGN in M82, and that the OH absorption features are produced by a circumnuclear disk or torus.
We wish to thank Karen Wills for communicating the results of MERLIN observations of M82 prior to publication. This research was supported by a grant to E.R.S. from the Natural Sciences and Engineering Research Council of Canada.
References
- (1)
- (2) Achtermann, J. M., & Lacy, J. H. 1995, ApJ, 439, 163
- (3)
- (4) Dietz, R. D., Smith, J., Hackwell, J. A., Gehrz, R. D., & Grasdalen, G. L. 1986, AJ, 91, 758
- (5)
- (6) Elitzur, M. 1976, ApJ, 203, 124
- (7)
- (8) Elitzur, M. 1992, Astronomical Masers (Dordrecht: Kluwer)
- (9)
- (10) Frail, D. A., Goss, W. M., Reynoso, E. M., Giacani, E. B., Green, A. J., & Otrupeck, R. 1996, AJ, 111, 1651
- (11)
- (12) Frail, D. A., Goss, W. M., Slysh, V. I. 1994, ApJ, 424, L111
- (13)
- (14) Gaume, R. A., & Mutel, R. L. 1987, ApJS, 65, 193
- (15)
- (16) Goetz, M., McKeith, C. D., Downes, D., & Greve, A. 1990, A&A, 240, 52
- (17)
- (18) Helfer, T. T., & Blitz, L. 1995, ApJ, 450, 90
- (19)
- (20) Huang, Z. P., Thuan, T. X., Chevalier, R. A., Condon, J. J., & Yun, Q. F. 1994, ApJ, 424, 114
- (21)
- (22) Hughes, D. H., Gear, W. K., & Robson, E. I. 1994, MNRAS, 270, 641
- (23)
- (24) Kronberg, P. P., Biermann, P., & Schwab, F. 1985, ApJ, 291, 693
- (25)
- (26) Kronberg, P. P., & Wilkinson, P. N. 1975, ApJ, 200, 430
- (27)
- (28) Kruegel, E., Chini, R., Klein, U., Lemke, R., Wielebinski, R., & Zylka, R. 1990, A&A, 240, 232
- (29)
- (30) Muxlow, T. W. B., Pedlar, A., Wilkinson, P.M., Axon, D. J., Sanders, E. M., & deBruyn, A. G. 1994, MNRAS, 266, 455
- (31)
- (32) O’Connell, R. W., Gallagher, G. S., Hunter, D. A., & Colley, W. N. 1995, ApJ, 446, L1
- (33)
- (34) Shen, J. & Lo, K. Y. 1995, ApJ, L99
- (35)
- (36) van Langevelde, H. J., van Dishoeck, E. W., Sevenster, M., & Israel, F. P. 1995, ApJ, 448, L119
- (37)
- (38) Watson, M. G., Stanger, V., & Griffiths, R. E. 1984, ApJ, 286, 144
- (39)
- (40) Weliachew, L., Fomalont, E. B., & Greisen, E. W. 1984, A&A, 137, 335
- (41)
- (42) Wild, W., Harris, A. I., Eckart, A., Genzel, R., Graf, U. U., Jackson, J. M., Russell, A. P. G., & Stutzki, J. 1992, A&A, 265, 447
- (43)
- (44) Wills, K. A., Pedlar, A., Muxlow, T. W. B., & Wilkinson, P. N. 1997, MNRAS, in press
- (45)
- (46) Yusef-Zadeh, F., Roberts, D. A., Goss, W. M., Frail, D. A., & Green, A. J. 1996, ApJ, 466, L25
- (47)
(a) Grey scale representation of the 1720 MHz continuum map showing the OH features listed in Table 1 (diamond symbols) and the discrete sources from Kronberg et al. (1985) (cross symbols). Also marked is the 2.2 nucleus of the galaxy according to Dietz et al. (1986) (triangle symbol). The image is rotated so that major axis of M82 is parallel to the horizontal axis. The position angle of the major axis was assumed to be . (b) Features in Table 1 on a contour representation of the CO position-velocity map from Shen & Lo (1995). Positions of the maser features shown are projected onto the major axis, and the positions are with reference to the 2.2 IR source at the nucleus.
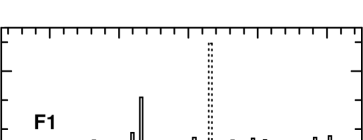
The 1720 MHz spectra for each of the features listed in Table 1. In each case the spectra represent slices along the velocity axis of the spectral line cube at the position of peak brightness in the individual channel maps of the feature. The only 1612 MHz feature shown, and the only one detected, is represented by the dashed profile associated with feature (4).
| Feature | (B1950) | (B1950) | 1720 Line | 1612 Line | Velocity | |
|---|---|---|---|---|---|---|
| ( s) | ( ) | (mJy) | (mJy) | ( | ( | |
| 1 | 40.800.09 | 59.40.3 | ||||
| 2 | 42.090.07 | 58.20.2 | ||||
| 3 | 43.330.07 | 59.40.2 | ||||
| 4 | 44.020.02 | 59.50.1 | ||||
| 5 | 44.140.08 | 62.20.2 | ||||
| 6 | 44.490.12 | 44.80.3 |