Cristina C. Popescu 11institutetext: Max Planck Institut für Astronomie, Königstuhl 17, D–69117 Heidelberg, Germany 22institutetext: Department of Astronomy, University of Padova, Vicolo Osservatorio 5, 35122 Padova, Italy 33institutetext: European Southern Observatory, Alonso de Cordova 3107, Vitacura, Casilla 19001 Santiago 19, Chile 44institutetext: Universitätssternwarte München, Scheiner Str.1, D–81679 München, Germany 55institutetext: The Astronomical Institute of the Romanian Academy, Str. Cuţitul de Argint 5, 75212, Bucharest, Romania
SN 1995ah-the first supernova observed in a Blue Compact Dwarf galaxy ††thanks: Partly based on observations obtained at the European Southern Observatory, La Silla, Chile and at the German-Spanish Observatory, Calar Alto, Almeria, Spain
Abstract
We present the properties of the supernova SN 1995ah discovered in a Blue Compact Dwarf galaxy (BCD) around 10 days after the maximum. This is the first supernova event observed in a BCD. The photometric and spectroscopic data suggest that SN 1995ah is a Type II supernova and could belong to the rare Bright SNII Linear subclass, for which at maximum light.
keywords:
supernovae: individual: 1995ah - blue compact dwarf galaxies: individual: HS0016+14491 Introduction
The Type II supernova 1995ah was discovered on February 2, 1995 by Popescu et al. (1995) during the follow-up spectroscopy of a survey for emission-line galaxies (Popescu et al. 1996a); the discovery of this supernova was therefore serendipitous. The survey itself was conducted with the aim to search for emission-line galaxies towards nearby voids (Popescu et al. 1996b, Popescu et al. 1997) and to study the spatial distribution of the dwarf emission-line galaxies in comparison with the population of normal (giant) galaxies. The candidates for emission-line objects were selected from the objective-prism plates of the Hamburg Quasar Survey (HQS) (Hagen et al. 1995). The selection of candidates was done on digitised spectra and was based on the presence of the [OIII] 5007 line.
The galaxy HS0016+1449 was selected as a candidate in the frame of the above mentioned survey and was confirmed as a galaxy with emission-lines during one of the follow-up spectroscopic runs at the 2.2 m telescope at Calar Alto. The galaxy was previously unknown in literature, and its main characteristics are given by Popescu et al. (1996a) (Tables 4, 5). The spectrogram together with some further direct images of the galaxy indicated that HS0016+1449 is a typical Blue Compact Dwarf galaxy with high degree of ionization and blue continuum, at a redshift z=0.0147. A later spectrogram of the galaxy led to the discovery of the supernova 1995ah. This is the first case of a supernova discovered in a Blue Compact Dwarf.
The compact galaxies were discovered and classified as a separate class of objects by Haro (1956) and Zwicky (1964), based on their high surface brightness appearance on the photographic plates. The whole family was later divided into two subclasses, red and blue, according to their integrated colours. The Blue Compact Dwarfs received considerable attention when it was realised that these objects are places where strong star formation is occuring (Searle & Sargent 1972). Late type spirals and irregular galaxies have been long known as centres of active star formation with their appearance in the blue region of the spectrum largely determined by the emission from young stars. However, in late type spirals and as well as in irregulars the bulk of the stellar mass lies not in the young stars but in an older stellar population which contributes most of the emission in the far red and infra-red spectral regions. Sargent & Searle (1970) discovered that among the BCDs there are members in which the young stellar population dominates in blue and in the far infrared. It was proposed that the BCDs are galaxies undergoing a strong burst of star formation and it may even be that they produce primarily massive stars rather than stars with a luminosity function similar to that of our solar neighbourhood. Sargent & Searle termed these objects “isolated extra-galactic HII regions”, but nowadays the most commonly denomination is “HII galaxies”.
While the name of BCDs was mainly used for objects that were classified on morphological criteria (Binggeli et al. 1985 - for the Virgo Cluster Catalog), the term of HII galaxies was introduced for objects discovered on spectroscopic surveys for emission-line objects. The class of BCDs contains however a rather heterogenous family of objects, with different properties (Campos-Aguilar et al. 1993).
Typical diameters, intrinsic luminosities and H luminosities of the HII galaxies range between , , and erg/sec, respectively.
| Date (UT) | Oct., 8.141 | Feb., 2.792 | Oct., 14.211 |
|---|---|---|---|
| 1994 | 1995 | 1995 | |
| Telescope | 2.2 m, CA | 2.2 m, CA | 3.6 m, ESO |
| Instrument | BCCS | BCCS | EFOSC1 |
| Detector | TEK13 | TEK6 | TEK26 |
| Pixel Size () | 24 | 24 | 27 |
| Slit width () | 2 | 2 | 2 |
| P.A. | 90. | 90. | 216. |
| Pixel number | 10241024 | 10241024 | 512512 |
| Dispersion (Å/pixel) | 5.1 | 5.2 | 6.3 |
| Resolution (Å) | 12 | 12 | 18 |
| Spectral Range (Å) | 3600-9000 | 3460-8600 | 3700-6800 |
| Exposure time (s) | 600 | 459 | 1800 |
| Date (UT) | Feb., 03.786 | Oct., 14.197 | Oct., 17.935 |
|---|---|---|---|
| 1995 | 1995 | 1995 | |
| Telescope | 2.2 m, CA | 3.6 m, ESO | 3.5 m, CA |
| Instrument | CAFOS | EFOSC1 | PFFR |
| Detector | TEK13 | TEK26 | TEK7 |
| Pixel Size () | 24 | 27 | 24 |
| Pixel number | 10241024 | 512512 | 10241024 |
| Pixel scale (′′/pixel) | 0.511 | 0.610 | 0.406 |
| Filter | R | R | 703/34 nm |
| Exposure time (s) | 60 | 120 | 600 |
The paper is organised as follows. In 2 we describe the spectroscopic and the photometric properties of the supernova and of the host galaxy, in 3 we make some extimates on the SNR of this kind of galaxies and 4 contains the summary.
2 The observations
Table 1 gives the set-up of the spectroscopic observations of the galaxy HS0016+1449 before the supernova exploded, when it was close to maximum and 254 days after the discovery. The first two observations were taken with the 2.2 m telescope at the German-Spanish Observatory at Calar Alto (Almeria, Spain) and the last observation was obtained with the ESO 3.6 m telescope. The spectroscopic data were reduced using both the MIDAS and IRAF packages. In all cases a standard procedure was applied, namely: bias subtraction, flat-field correction, extraction of the 1-dimensional spectra from the 2-dimensional one, transformation to the true wavelength scale, correction for the atmospheric extinction using mean extinction values for Calar Alto and La Silla, respectively, and convertion to true flux from observations of spectrophotometric standard stars.
The journal of the photometric observations is given in Table 2. The first image was taken during the supernova explosion with the CAFOS (The Calar Alto Faint Object Spectograph) at the 2.2 m telescope at Calar Alto. A second R image was taken at ESO 253 days after the discovery of the supernova together with the spectroscopic observations described above. The deepest direct image was taken at the Prime Focus of the 3.5 m Focal Reducer at Calar Alto. We also observed several open-clusters containing photometric standard stars, namely NGC2264 and NGC2419 at Calar Alto and Ru149 at La Silla. All the direct images were taken in photometric conditions. The photometry of the frames was performed using aperture photometry and the software available in MIDAS. For the calibration of the frames we used the data from Christian et al. (1985)(NGC2264, NGC2419) and Landolt (1992) (Ru149).

2.1 The photometry
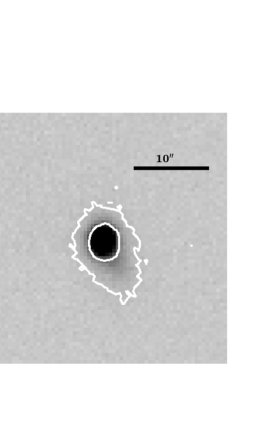
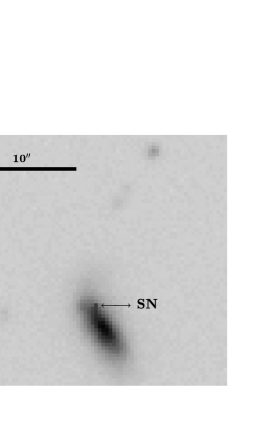
The first direct frame taken on February 3, 1995 (Fig. 1) is dominated by the supernova image which outshines the faint underlying galaxy. A deep 600 s exposure taken 256 days later (October 17, 1995) (Fig. 2) shows the supernova which faded substantially. The remnants of the supernova are still visible on the northern-eastern edge of the galaxy. The same features are present on the red ESO image taken on October 14, 1995. The distance of the supernova from the centre of the galaxy is 2.57′′, at a PA=18.4∘. At a redshift of z=0.0147, this corresponds to 0.7 kpc. Throughout this paper a Hubble constant of 75 km/s/Mpc is considered. The galaxy itself shows little structure; a hot-spot at its center is embedded in a faint and structureless envelope. Some interesting features seem to surround the galaxy, maybe nearby companions and remnants of tidal interactions. It was suggested (Taylor et al. 1994, Taylor 1997) that interaction with nearby companions may play an important role in triggering bursts of star formation in HII galaxies. However, the faint features that seem to surround the galaxy could result from projection effects and further observations would be required to confirm the real nature of the “companions”. The diameters of the galaxy measured along the major and the minor axis were D=14.5′′ (4.2 kpc) and d=6.8′′ (1.9 kpc), respectively.
From our photometric data we computed the apparent magnitudes of the SN and of the host galaxy. For the galaxy HS0016+1449 we found an apparent magnitude of R=17.7 which gives an absolute magnitude of M, after correction for a galactic extinction of A (taken from Burstein & Heiles 1984). We estimate that the errors in our magnitude determinations are around 0.2 mag. The supernova was initially as bright as R=15.8 (February 3) and it faded down to R=20.7 (October 14), 253 days later. The corresponding absolute magnitudes of the supernova were M (February 3) and M (October 14). The first data point we believe to be measured 10 days after the maximum, as our spectral characteristics indicates (see next subsection). Given the magnitude of the supernova near maximum we suggest that SN 1995ah could belong to the rare Bright SNII Linear subclass (Patat et al. 1994), for which at maximum light. We made then an attempt to compare our two photometric measurements with the light curves of another Bright SNIIL, SN 1990K (Cappellaro et al. 1995) (Fig. 3). The SN 1990K light curve has been scaled to the distance and reddening of SN 1995ah. We assumed January 24th as the date of maximum of the SN 1995ah light curve. The agreement is quite good and this tells us that the amount of energy involved in the SN 1995ah and SN 1990K explosions could be similar.
2.2 The spectroscopy
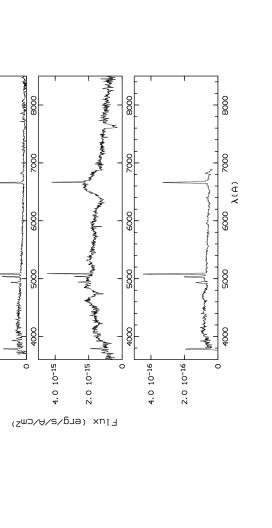
The top pannel of Fig. 4 gives the first spectogram of the galaxy taken on October 8, 1994. The spectrum shows the typical narrow emission-lines of a high-ionization HII galaxy, namely [OII] 3726,3731, [NeIII] 3869, H 4861, [OIII] 4959,5007, H 6563 and [SII] 6716,6731.
A second spectrum of the galaxy taken on February 2, 1995 (Fig. 4, middle pannel) is dominated by the features of a Type II supernova around 10 days after the maximum; the spectrum is characterised by broad emission-lines with P-Cyg absorption on which the narrow-emission lines of the galaxy are superimposed.
The third spectrum taken on October 14, 1995 (Fig. 4, bottom pannel) shows that traces of the supernova are still visible, especially in the broad emission of the H.
We first analyse the spectroscopic properties of the host galaxy with the aim of proofing the membership of HS0016+1449 to the class of HII galaxies. In Table 3 we give the line ratios of the bright narrow emission-lines with respect to the H line. The line ratios are corrected for the extinction in our own Galaxy as well as for the internal extinction in the galaxy itself. The intrinsic ratios I()/I(H) were calculated using equation (7.6) from Osterbrock (1989). The reddening coefficient c(H) was derived from the H/H decrement and the value of c(H) was computed assuming that the intrinsic Balmer-line ratios are equal to the case B recombination values from Osterbrock (1989), H/H=2.87. The values of the line ratios and of the c(H) were separately computed for the spectrum taken on October 8, 1994 (Column A) and for the one taken on October 14, 1995 but for different regions of the galaxy (Columns B, C, D, E, F). Because in the latter spectrum the slit was oriented along the major axis of the galaxy, we were able to extract separately the contribution of different regions, including the region of the supernova. Each region was artificially extracted to contain the same number of pixels and corresponds to 1.83′′ (0.5 kpc) width. The regions were considered from NE to SW. Table 3 shows that the first spectrum has the same internal extinction as the regions B, C and D (an average of c(H)=0.44) while for the regions E and F the extinction grows up to 1.92 and 2.04, respectively. The errors in the line ratios are around for Column A, B, C and D and up to 30 for the regions E and F. We should notice that the latter errors are due to the bad S/N of the H. The corrected line ratios from the first spectrum (A) are approximately the same as those in the region C of the last spectrum, where the supernova features are still visible. Presumably the first spectrum observed with a standard BC Cassegrain Spectograph was taken with the slit crossing the region C. The spectrum of the region C contains also the lines of H and [OIII] 4363, the latter being used to estimate the electronic temperature. The table also shows a tendency of decreasing the degree of the oxygen ionization, from region B to region F, from a ([OII] 3727)/([OIII] 5007) ratio of 0.28 up to a ratio of 5.31.
| A | B | C | D | E | F | |
|---|---|---|---|---|---|---|
| c(H) | 0.46 | 0.48 | 0.40 | 0.44 | 1.92 | 2.04 |
| [OII] 3727 | 1.85 | 1.16 | 1.61 | 5.08 | 37.64 | 98.29 |
| H4340 | 0.46 | |||||
| [OIII] 4363 | 0.15 | |||||
| [OIII] 4959 | 1.95 | 1.71 | 1.98 | 1.64 | 3.12 | 6.56 |
| [OIII] 5007 | 5.85 | 4.13 | 5.66 | 4.76 | 8.35 | 18.50 |
Though we divided our spectrum in different regions, mainly with the aim of extracting the contribution of the supernova features, the spectrum is characterised by two main spectral types, one of high ionization and low reddening, corresponding to an extension of 5.49′′ (1.5 kpc) along the major axis of the galaxy (region B, C, D) and one of low ionization and high extinction, corresponding to an extension of 3.66′′ (1.0 kpc) (region E, F).
Using the [OIII] /[OII] 4363 ratio (for the region C) in the limit N (Osterbrock 1989, p. 121) we obtained a temperature of T K. From the ratio [SII] 6716/[SII] we determined an electron density Ncm-3 (see Osterbrock 1989, p. 134), assuming a temperature TK. The Ne determination can be recalculated using our estimated temperature, which implies a correction of (104/T)1/2 to the previous determination. The Ne becomes thus 350 cm-3. Using lower limit estimates for the [NII] 6583 (again for the high ionization region), and the diagnostic diagrams log([OIII] 5007/H) vs log([NII] 6583/H) from Osterbrock (1989, p. 346) we found the location of our galaxy in the region occupied by the high ionization HII galaxies. Using also the diagnostic diagrams log([OIII] 5007/H) vs log([SII] /H) from Osterbrock (1989), p. 349, we found again that our galaxy is a typical HII galaxy.
So both morphological and spectroscopic properties of the galaxy HS0016+1449 recommend it as a typical Blue Compact Dwarf.
| line identification | velocity | |
|---|---|---|
| February 2 | October 14 | |
| H | 15900 | 6700 |
| HeI | 12700 | |
| H | 12200 | 4300 |
| H | 13200 | 4300 |
| H | 10500 | |
| H | 11400 | |
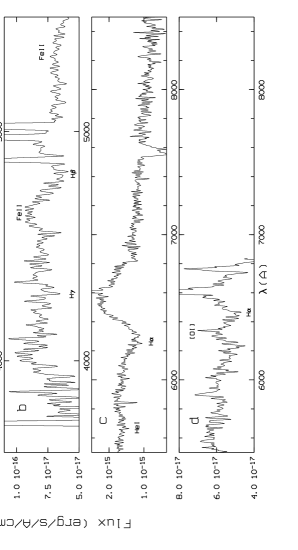
Next we will describe the spectroscopic features of the supernova. The first spectrum of the supernova is typical of a SN Type II around 10 days after the maximum (Fig. 5 a,c). It is characterised by broad emission lines with PCyg absorption on their blue side, of the Balmer series (visible up to Hδ) and of the HeI 5875 as well as by blends due to FeII (35), (37), (38), (42). The typical expansion velocities of the ejected shells measured from the positions of the deepest features of the PCyg absorptions are given in Table 4. The upper limit of the expansion velocity, derived from the wavelength of the blue wing of the Hα absorption is 23000 km/s. These high values confirm that SN 1995ah has been caught soon after explosion. As an example, SN 1987A had a similar expansion velocity only 6 days after explosion (Hanuschik et al. 1989).
The second and last spectrum of the SN taken on October 14, 1995 (Fig. 5 b,d) shows still traces of the supernova continuum, of the broad Balmer emission-lines (visible up to H), of the FeII blends and [OI]. The expansion velocity as derived from the FWHM of the emission lines, and given in Table 4, is a factor smaller than in the first spectrum, and similar to that of other SNII. No HeI 5875 is more visible.
3 Supernova rates
We can now relate the H luminosity of our galaxy to the SFR following Kennicutt (1983). If we consider a Miller & Scalo (1979) IMF:
| (1) |
including stars in the mass range, the transformation can be written as:
| (2) |
Taking the H luminosity of HS0016+1449 L(H)=ergs/s, as measured in the spectrum of October 1995 we obtain a .
The supernova rate SNR is related to the SFR through the following integrals:
| (3) | |||||
| (4) |
From (3) and (4) we obtain:
| (5) |
Thus, for a SFR of , the corresponding supernova rate is , or , where SNu=SN/100yr/10, M and we considered B=17.6 for the galaxy (see Popescu et al. 1996a). The errors were calculated from the uncertainties introduced by the H flux measurements. The derived supernova rate is in good agreement with the for irregular galaxies, taken from Cappellaro et al. (1997).
4 Summary
1. SN 1995ah is the first supernova observed in a BCD galaxy. It was discovered during a survey for emission-line galaxies, around 10 days after the maximum brightness.
2. SN 1995ah is a Type II supernova and could belong to the rare Bright SNII Linear subclass. We made an attempt to compare our photometric measurement with the light curve of another Bright SNIIL, SN 1990K and we found a quite good agreement, suggesting similar amount of energy involved in the two explosions. The distance of the supernova from the centre of the galaxy is 2.57′′, at a PA=18.4∘.
3. The host galaxy HS0016+1449 has an R=17.7 at a redshift z=0.0147 and its morphologic and spectroscopic characteristics are typical for the HII galaxy class.
4. From the H luminosity of the host galaxy, L(H)=ergs/s, we estimate a , in agreement with the SNR for irregular galaxies.
Acknowledgements.
We thank to the anonymous referee for useful comments and suggestions. U. Hopp acknowledges the support by the SFB 375 of the Deutsche Fortschungsgemeinschaft.References
- [1] Binggeli, B., Sandage, A., Tammann, G.A. 1985, AJ 90, 1681
- [2] Burstein, D., Heiles, C. 1984, ApJS 54, 33
- [3] Campos-Aguilar, A., Moles, M., Masegosa, J. 1993, AJ 106, 1784
- [4] Cappellaro, E., Danziger, I.J., della Valle, M., Gouiffes, C., Turatto, M. 1995, A&A 293, 723
- [5] Cappellaro, E., Turatto, M., Tsvetkov, D.Yu., Bartunov, O.S., Pollas, C., Evans, R., Hamuy, M., 1997, A&A in press
- [6] Christian, C.A., Adams, M., Barnes, J.V., Butcher, H., Hayes, D.S., Mould, J.R., Siegel, M. 1985, PAPS 97, 363
- [7] Hagen, H.-J., Groote, D., Engels, D., Reimers, D. 1995, A&AS 111, 195
- [8] Hanuschik, R.W., Schmidt-Kaler, T. 1989, MNRAS 241, 347
- [9] Haro, G. 1956, Bol. Obs. Tonantzintla y Tacubaya, 2, 8
- [10] Kennicutt, R.C. 1983, ApJ 272, 54
- [11] Kirshner R.P. 1990, in: Supernova, ed. A.G. Petschek, Spring-Verlag, New York, p. 59
- [12] Landolt, A.U. 1992, AJ 104, 340
- [13] Miller, J.S., Mathews, W.G. 1972, ApJ 172, 593
- [14] Miller, G.E., Scalo, H.M. 1979, ApJS 41, 513
- [15] Osterbrock, D.E. 1989, Astrophysics of Gaseous Nebulae and Active Galactic Nuclei, University Science Books, California
- [16] Patat, F., Barbon, R., Cappellaro, E., Turatto, M. 1994, A&A 282, 731
- [17] Popescu, C.C., Rafanelli, P., Hopp, U., Elsässer, H. 1995, IAUC 6245
- [18] Popescu, C.C., Hopp, U., Hagen, H.J., Elsässer, H. 1996a, A&AS, 116, 43
- [19] Popescu, C.C., Hopp, U., Elsässer, H., Hagen, H. 1996b, in proceedings of the 30th Rencontres de Moriond: Clustering in the Universe, eds. Maurogordato, S., Balkowski, C., Tao, C., and Trân Thanh Vân, J., Editions Frontieres, p. 77
- [20] Popescu, C.C., Hopp, U., Elsässer, H. 1997, A&A in press
- [21] Salzer, J.J., MacAlpine, G.M., Boroson, T.A. 1989, ApJS 70, 479
- [22] Sargent, W.L.W., Searle, L. 1970, ApJ, 162, L155
- [23] Searle, L., Sargent, W.L.W. 1972, ApJ, 173, 25
- [24] Taylor, C.L., Brinks, E., Pogge, R.W., Skillman, E.D. 1994, AJ 107, 971
- [25] Taylor, C.L. 1997, ApJ 480, 524
- [26] Zwicky, S. 1964, ApJ, 143, 192