Maximal Disks and the Tully-Fisher Relation
Abstract
We show that for luminous, non-barred, high-surface brightness (HSB) spirals the Tully-Fisher (TF) relation residuals can be used to estimate the relative mass contributions of the stellar disk and the dark halo at the peak of the disk rotation, near exponential scale lengths. For “maximal disks”, a large fraction () of the total rotational support, , at such radii should arise from their stellar mass. Therefore the disk size, or surface-brightness, should be a significant additional parameter in the TF relation. At a given absolute luminosity, , more compact disks (as measured by the disk scale length ) should have higher rotation speeds, . Using a well-defined sample of late-type spirals, deviations, and , from the mean relations, and , are not significantly correlated. The case of expected for a maximal disk is ruled out for the majority of these HSB galaxies.
We model adiabatic infall of varying amounts of luminous matter into dark matter halos to explore the range of possible values for From this, we find that the TF relation residuals require a mean value of , fairly insensitive to the details of the initial dark matter halo and to the presence of a bulge. This translates to within , or roughly twice more dark matter in the inner parts of late-type spirals than previously accounted for by maximum disk fits. We show that any stellar population differences between disks of different scalelengths lead to lower values of . Our result is independent of the shape of the luminosity profile and relies only on the assumption of adiabatic contraction and that the dark matter halo rotation rises in the central parts of the galaxy. Sub-maximal disks establish a natural continuity between HSB and low-surface brightness (LSB) galaxies which appear to be completely dark matter dominated even in their inner regions.
1 Introduction
Over the last twenty years, much effort has been invested in searching for a “third parameter” to reduce the scatter in the two-parameter Tully-Fisher relation (TFR) between the stellar luminosity and the rotation speed of spiral galaxies (e.g., Strauss & Willick 1996, Courteau 1997; hereafter C97, and references therein). For late-type spiral galaxies, no other structural parameter (such as the size, light concentration, or mean surface brightness of the galaxy) appears to lead to a significant reduction in scatter. In short, the stellar luminosity alone seems to determine the rotation speed (which we will define more precisely below) of a spiral galaxy.
It is common to model the rotation curves of individual galaxies with multi-component mass models, usually consisting of bulge, disk and dark halo components (e.g., Broeils 1992, hereafter B92; van der Kruit 1995, hereafter vdK95). The mass components representing the bulge and the disk are usually derived from the deprojected light-distribution, assuming a constant mass-to-light ratio, to be determined by the data. The assumed constancy of across a given galaxy is often justified on the basis of modest radial color gradients (de Jong 1995) and the small changes of vertical scale heights as a function of radius in late-type spirals (van der Kruit 1988, de Grijs & Peletier 1997). Especially for data taken in the redder bands this approximation should be valid. With only a single value of , analytical galaxy formation models can explain simultaneously the properties of HSB and LSB galaxies, like the slope and zero-point of the TF relation, very well (Dalcanton et al. 1997, Mo, Mao, & White 1998). This provides further support for the constancy of among disk galaxies.
Dark matter halos in rotation curve decompositions have been modeled traditionally as isothermal spheres with a homogeneous core. Because these multi-component fits to the rotation curve data are not unique, it appeared sensible to add a constraint, such as the “maximum disk” or “minimum dark matter” solution (Sancisi & van Albada 1985, Carignan & Freeman 1985), to obtain a unique solution. These fits imply the highest possible value for , typically ranging from 3 to 5 in the band (Broeils & Courteau 1997; hereafter BC97) and, in turn, lead to larger core radii for the halo. “Maximum disk” fits have been very successful, matching almost all H I and H rotation curve data (B92, Buchhorn 1992, BC97), reproducing the small scale features of optical rotation curves well (Freeman 1993), and satisfying constraints on spirals arms for non-interacting galaxies (Athanassoula et al. 1987). Maximum disk models imply that for bright HSB Sb-Sc spirals, the stellar disk and bulge are the dominant mass components inside two exponential scale lengths. These galaxies are typically HI-deficient in their inner parts and the mass of the neutral gas is negligible (Broeils 1992).
An operational definition for the maximum disk hypothesis is that the stellar disk provides of the total rotational support of the galaxy at (Sackett 1997). The lower boundary accounts for bars and massive bulges which reduce the contribution of the disk to the overall rotation curve. The upper boundary of this ratio is kept at 95% in order to prevent hollow cores in the dark halo. Still, the validity of the maximum disk hypothesis has yet to be demonstrated unequivocally in external galaxies because of our inability to constrain , independent of mass models.
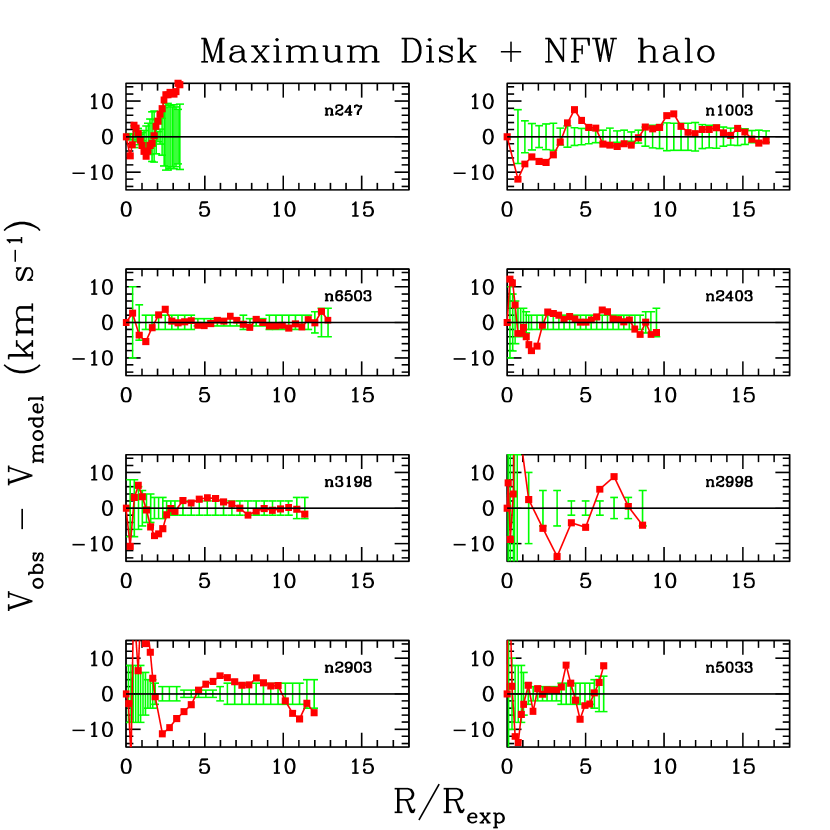
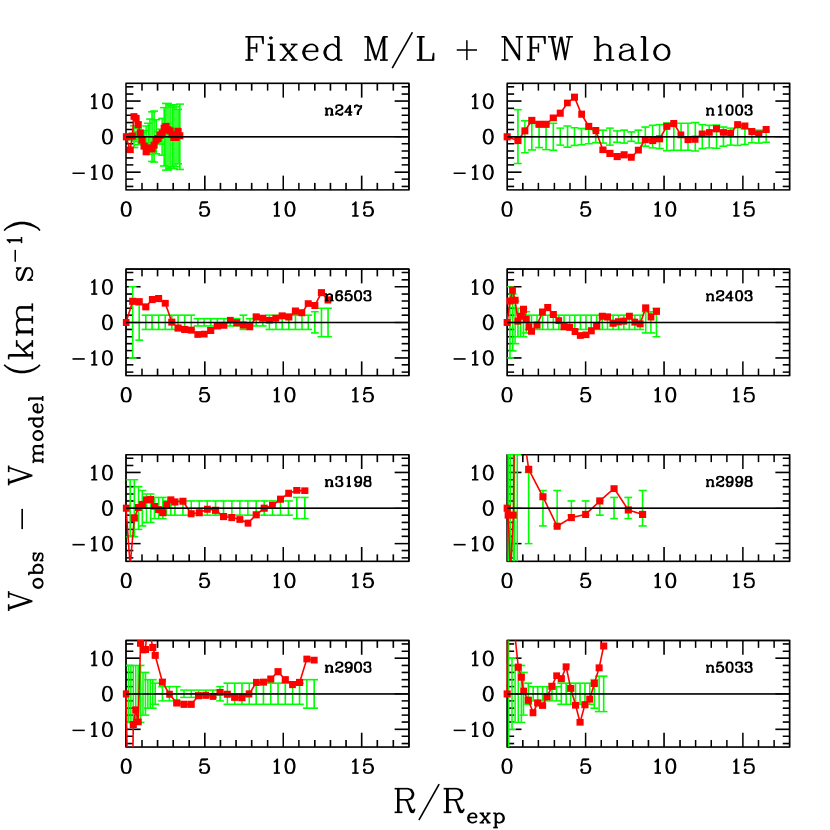
To illustrate this point, we have computed mass decompositions for 10 late-type spirals with extended H I rotation curves previously modeled with an isothermal halo and maximum disk by Broeils (1992, p. 246). We have repeated Broeils’ modeling, but with a cosmologically motivated halo (Navarro, Frenk, & White 1996; hereafter NFW) and two values of corresponding to a maximal disk and lighter disk with . The data-model residuals are shown in Figs. 1 & 2. Details regarding the fitting procedure will be given elsewhere. Clearly, one cannot discriminate in favor of any one mass model based on the quality of these multi-component fits; the observed H I rotation curves are reproduced equally well by each fit. A similar result was also found by BC97 who modeled 290 H rotation curves with -band surface brightness profiles and found equally good fits using either a pure disk or a pure halo. This latter argument is however trivial given the limitations to constrain fitting parameters from shallow rotation curves. Note also that the particular shape of the NFW halo does not play a role in constraining ; this is because of the strong covariance that exists between the concentration parameter of the NFW halo and . This is true of any other halo model with a core parameter. An example of such fitting is found in Navarro (1997, p. 408) for NGC 3198.
A related argument in support of maximum disks is that the luminous matter alone can reproduce the overall shape and small scale features of optical rotation curves (Buchhorn 1992, Freeman 1993). The small-scale features are almost certainly the result of spiral wave streaming and offer weak support for maximum disks. This is confirmed by matching the bumpy features of the rotation curve with similar features in major-axis luminosity cuts. The match to the overall shape of the rotation curve is met just as well by pure halo or pure disks models (BC97).
In principle, there exists a technique to constrain uniquely, but it is difficult to implement in practice, and it still requires statistical arguments. For pure exponential disks, the vertical (azimuthal) velocity dispersion and scale height of the stellar disk are linked to its mass density, independent of the halo mass (van der Kruit & Searle 1981, Bahcall & Casertano 1985). If the disk scale length is also known, one can directly infer the mass of the disk. The measurement of velocity dispersions in stellar disks away from the central bulge and disk inhomogeneities is however difficult for large samples. The rapid surface brightness decline in stellar disks requires that absorption profiles beyond 1-2 disk scale lengths be measured with 8-10m class telescopes. This technique also requires that galaxy properties be matched statistically since disk scale heights and scale lengths cannot be measured in face-on and edge-on galaxies simultaneously. One attempt at this technique has been published so far (Bottema 1993) which suggests, based on a sample of 12 bulge-less systems and some assumptions about their stellar populations, that late-type spirals are sub-maximal with equal to at
Locally, most investigations of the Galactic mass density near the Sun support the notion of a significantly sub-maximal Milky Way disk with at (Kuijken 1995 and references therein). Sackett (1997) however argues that new or revised structural data for the Milky Way would favor a maximal Galactic disk. A crucial element in these models is the precise contribution of the massive central bar (e.g., Zhao, Spergel, & Rich 1995) or elongated bulge (Kuijken 1995) to the dynamical support in the inner parts of the Galaxy, which is quite uncertain at present. The uncertainty in the disk scale length is also an issue; a 25% difference above or below the nominal value of 3.5 kpc is sufficient to lend a sub-maximal result or not. Published values for the disk scale length of the Milky Way currently differ by more than 30% (Sackett 1997).
Numerical and analytical models of disk formation in a dissipationless dark matter halo also predict, for realistic total fractions of baryonic to dark matter, that spiral disks should be far from maximal (Blumenthal et al. 1986, Barnes 1987, Flores et al. 1993, Moore 1994, NFW, Dalcanton et al. 1997, Mo, Mao, & White 1998, Navarro 1998).
In this paper we explore whether the Tully-Fisher relation, and its seemingly sole dependence on stellar luminosity, is consistent with “maximal” disks. The basic idea of our test is best described by a Gedankenexperiment: Consider a pure exponential disk galaxy of a given luminosity, mass-to-light ratio, and disk scale length. In the absence of dark matter or bulge, its rotation curve is given by (Freeman 1970),
| (1) |
where, is the gravitational constant, the central surface brightness, the disk exponential scale length, , and and are the modified Bessel functions of the first and second kind. The disk rotation curve will peak at at a value of . For disks of finite thickness (say, ) the rotation curve will have a very similar shape but a % lower peak (e.g., Casertano 1983); this will slightly affect the “shape” term in square brackets in Eq. (1), but leave the subsequent scalings untouched.
Imagine “compressing” the same disk to a somewhat smaller scale length. The more compacted disk will peak at a higher rotation velocity, and dimensional analysis of Eq. 1 yields
| (2) |
at fixed . Thus, if dark matter is negligible inside 2.2, a 20% change in disk scale length – at a given disk mass – should translate into a 10% change of , hence into a % offset in luminosity from the mean TFR. Such an offset should be easily detectable in a statistical sense, given the size and quality of TFR samples currently available. Of course, this effect will be altered by the presence of a dark matter halo and of a bulge, and we will devise a sequence of models that predicts for a wide range of disk-to-halo mass ratios.
Even though in practice such a test requires to substitute for , our test does not rely on any assumption that const; it merely requires that be independent of surface brightness and that any gradient in for comparable disks be self-similar.
In §2 of this paper, we determine the mean value of for a set of well defined samples of luminous (), non-barred HSB galaxies. In §3, we compare this observed value to the predictions from a number of diskhalo models and examine the effects due to color gradients. This enables us to estimate what fraction of the rotation speed, at arises from the stellar disk. We discuss our results in §4 and offer a brief conclusion in §5.
2 Determination of
2.1 Using Two Data Samples
To date, two large optical TF data sets have been published, from which we can determine for many hundreds of non-barred HSB galaxies. All galaxies are selected from the field, where dark matter halos have likely not overlapped or recently merged. We first use the collection of 306 Sb-Sc northern galaxies from Courteau and Faber (Courteau 1992; hereafter referred to as CF). The CF galaxies were selected from the UGC catalog using the following criteria: , blue major axis diameter , inclination between 55∘ and 75∘, no bar, and no apparent interaction. The velocities were modeled via parametric fitting of the H rotation curves (C97) and the CCD magnitudes and disk scale lenghts were measured in the Gunn band (Courteau 1996). Specific details about galaxy selection can be found in Courteau (1992, 1996). We use a sub-sample of the CF catalog in a region of Quiet Hubble Flow (QHF) to minimise the effects of streaming and local infall motions on distance estimates (Courteau et al. 1993). For this analysis, the CF QHF sub-sample is further restricted to rotation curves that extend beyond (so that is defined) and to . Only the brighter galaxies () are retained where the dynamical contributions from the stellar disk are likely to be largest. All other cases, expect perhaps for bar-dominated galaxies, presumably yield a lower fraction of visible-to-total matter at . The color is also computed from the RC3 B-band and CF -band magnitudes are corrected for Galactic and internal extinction. After all culling, 124 CF/QHF galaxies are kept for final analysis.
We also use the collection of 1355 southern late-type spirals from Mathewson, Ford, & Buchhorn (1992; hereafter MAT). Peculiar motions are not as conspicuous in this sample and no spatial culling is applied. Excluding or retaining galaxies in the vicinity of the Great Attractor does not change the final result. As above for the CF sample, we restrict the total MAT sample to and , and require galaxies to have a measured color and I-band scale length. This yields a final sample of 406 MAT galaxies. The -band magnitudes and colors were corrected for internal and Galactic extinction as described in Willick et al. (1997). The fitting of for the MAT galaxies is described in C97. The disk scale lengths, from Byun (1995), were extracted from 2D bulge/disk decompositions of the galaxy images.
Five galaxies overlap between the CF and MAT samples. With those, we can verify that our CF scalelengths and those measured by Byun agree to within 10%. The typical uncertainty in published scalelengths for a given galaxy is about 23% (Knapen & van der Kruit 1991). The matching rotational amplitudes also agree very well, within 5% (C97).
It is of interest to verify how adequately the surface density of disk galaxies is described by a pure exponential profile. Using this information, we can show that our final result does not depend on any assumption about the shape of the luminosity profile of the disk.
We compute the fraction of “exponential light” at a given radius as the ratio of the integrated light, based on the disk exponential fit, to the total observed light inside that radius. We measure two separate ratios at and at “infinity.” The total magnitude measured at infinity includes all the light from the galaxy plus a small extrapolation of the disk profile (typically ) from its observed edge to infinity.
A disk is deemed “purely exponential” if the ratio of “exponential” to observed light at a given radius does not deviate by more than 20% from unity. In Fig. 3, we show exponential light ratios computed at and infinity for all 306 CF galaxies. More than three-quarters of the light profiles deviate from the idealized exponential disk model, some by more than 50%. Galaxies left of the peak of the histogram have typically a larger bulge or can be described by a Freeman Type I luminosity profile (Freeman 1970), whereas those on the right side correspond to a Freeman Type II profile or will show a truncated disk. Based on the criterion above, 85 CF galaxies, or 22% of the total CF sample, qualify as pure exponential disks. This ratio is closer to 18% for all MAT galaxies.
The TF distribution of all CF galaxies is shown in Fig. 4. The two distributions with circles and squares in each panel use absolute magnitudes measured at and infinity respectively. The solid line is the QHF TF fit from C97 and the dashed line is offset from that fit by 0 .5. This magnitude difference is that expected between the light measured at and at infinity for a pure exponential disk. The TF slopes are statistically equivalent and the zero-points differ by 0 .62 0 .05, a little over the exponential disk value. The bottom panel shows the same distributions for pure exponential disks only; here, the TF zero-point offset is exactly 0 .5, as expected by construction. The TF scatter for the QHF galaxies increases from 0 .34 when total extrapolated magnitudes are used to 0 .40 if the light interior to is used. As expected, there is no dependence of the TF scatter on the choice of magnitudes for the pure exponential galaxies ( in either case). In all cases, whether one considers the full CF sample or only the distribution of pure exponential disks, the TF slopes are equivalent within their statistical error (independent of the choice of magnitude), meaning that dynamically, all late-type spirals behave as exponential disks111It also implies that the typical rotation curve of a late-type spiral has reached turnover for . (C97)..
The data used in this study are: , , or , a or color term, distance of the galaxy in Mpc (see C97), and the fraction of exponential light in a galaxy. Distance-dependent quantities assume Mpc as in C97.
2.2 Fitting the Mean Parameter Relations
A galaxy’s rotation speed, size, and color correlate with its absolute luminosity; these correlations are known as the Tully-Fisher relation (Tully & Fisher 1977), Freeman’s law (Freeman 1970), and the color-magnitude relation (Tully et al. 1982), and are shown in Fig. 5 for our two samples. At present, we want to ask how various galaxy properties correlate at a given absolute luminosity. Hence we need to fit and remove the trends of , , and color ( or ) with absolute magnitude ( or for each sample). These three relations were fit by the functional form , where stands for , , and , respectively, is the absolute magnitude of the CF galaxies, and the upper bar denotes a median value. The same notation applies for the MAT sample with the appropriate terms replaced.
To achieve a robust fit to the data , we varied and to minimize the sign of the datamodel deviation (Press et al. 1992, §15.7). These fits are shown in Table 1. Standard least-squares fits give essentially the same solutions.
| Table 1. Parameter Correlations | |||
|---|---|---|---|
| CF/QHF galaxies (N=124) | CF pure exp. disks (N=28) | ||
| MAT galaxies (N=406) | MAT pure exp. disks (N=73) | ||
The fits were applied to the sample of exponential disks only and are shown as solid lines in Fig. 5. Open and closed symbols show all the galaxies and the restricted sample of pure exponential disks respectively.
2.3 Correlations among the Residuals
We can now define the residuals for each object as . Fig. 6 shows the residuals for , , and color plotted against each other. ¿From inspection of the plots, it is not obvious which range of correlation slopes is statistically acceptable. We devise a robust non-parametric test by rotating the set of residuals by various angles to get and then applying a Spearman rank test (Press et al. 1992, §14.6) for correlation between the quantities . The acceptable range of can be calculated from the range of angles for which the are not significantly correlated.
Table 2 shows correlation slopes for the full and restricted CF/QHF and MAT samples. The error quoted for each slope gives the 95% confidence level.
| Table 2. Residual correlations | |||||
|---|---|---|---|---|---|
| CF/QHF galaxies | MAT galaxies | ||||
| all | exp. only | all | exp. only | ||
The first line of Table 2 shows that there is tentative evidence that , indicating that the disk mass does play a role in setting . However, the case of , expected for the disk-only case, is clearly ruled out.
Further, the residual analysis shows that there is a slight (but not statistically significant) tendency that redder disks (at a given luminosity) are slightly more compact, and that redder disks have higher (see Table 2). These trends are expected in a variety of evolutionary models for disk galaxies (e.g., Firmani & Avila-Reese 1998).
Before proceeding with a dynamical analysis (§3) one should explore the potential impact of stellar population variations among disks of the same luminosity. Qualitatively, one would expect redder disks to have higher mass-to-light ratios, whether their colors are affected by dust, greater age, or higher metallicity. Since, more compact disks are observed to be marginally redder (Table 2), this would imply that the derived is lower than its “true” value, and consequently the observed mean value of is an upper limit to the actual dynamical contribution from the disk stars.
To be more quantitative about M/L variations among different disks, we have used population models (Vazdekis et al. 1996, their Table 2) to determine how the stellar -band varies with color. As a full exploration of this question is beyond the scope of this paper, we follow the common practice of using single age population models to match colors that arise from a more complex star-formation history, but which has resulted in the same luminosity weighted stellar age. We use population models with a mean age of Gyrs and near-solar metallicity to find that if the color differences are attributable to age differences, if they are attributable to metallicity differences, and for dust reddening, where is the ratio of total -band extinction to the differential extinction . This last quantity will depend on the details of the dust distribution. For the benchmark case of a simple absorption screen with a mean Galactic extinction curve, (Savage and Mathis, 1979).
In the context of these models, it appears the reddening due to stellar population age differences, and dust reddening imply the largest differences, with corresponding to a 25% increase in .
Another potential bias on the final value of is the wavelength dependence on scalelengths. The stellar disk mass is dominated by low-mass stars which emit most of their light in the redder bandpasses. Therefore, K-band scalelengths may be most representative of the surface density of the disk population. Scale lengths at red band passes are typically shorter than in the blue (de Jong 1995, Peletier & Balcells 1997). The ratio between the and band scalelengths and K-band scalelengths is about half that value but we will test for a more extreme difference of 10%. That is, we now measure at and use the shorter scalelength as our new fiducial. For both CF and MAT galaxies, this yields an 8% increase of . This effect is negligible and does not impact our conclusions. In the following we develop a dynamical analysis under the assumption that within our sample the stellar populations of disks at the same luminosity are similar.
3 What values of should we expect?
If the stellar disk were the only relevant mass component, we would expect , in the absence of color gradients. If, on the other hand, the stars are only test particles, then a difference in simply shifts the physical radius at which we determine . Therefore, in this limiting case just reflects , the logarithmic gradient of the halo rotation curve at disk scale lengths. Note that for halos with rising rotation curves (isothermal with a core, or NFW) one finds . As a consequence, one would expect a surface brightness, or disk size, dependence in the relation, both for the case of dominant and of negligible disk mass, yet with opposite sign. Consequently, there must be an intermediate case, where the stellar disk is somewhat important and the surface brightness disappears.
The actual situation will be bracketed by these two extremes. Below, we explore how depends on the fraction of the circular velocity at that is attributable to the stellar disk, .
3.1 Exponential Disks in NFW Halos
We first examine a simple exponential disk embedded in dark matter halo. For the initial dark matter halo structure, we use a density profile found in the collisionless CDM simulations of halo formation by NFW. These simulations indicate that this initial structure only depends on the total halo mass, which translates into the total stellar mass, if the baryonic fraction is constant among halos of identical mass, and if most cooled baryons have been converted into stars.
If the central accumulation of the baryons occurs on a longer time scale than the local dynamical time, the dissipationless dark matter halo will contract obeying adiabatic invariance (Blumenthal et al. 1986). Calculating this adjustment is easy in spherical geometry (e.g., Flores et al. 1993, NFW), but requires replacement of the disk configuration by the spherical density profile that has the same enclosed mass (see Binney & Tremaine 1987, Eq. 2-170). It is well known that this procedure leads to a somewhat incorrect rotation curve, but we are only interested in derivatives. The final disk rotation curve is still computed using Eq. 1, and the final dark matter distribution is given by where is the total mass within radius before disk formation (e.g., NFW).
Using a SCDM halo profile from NFW with and assuming a baryon fraction of , we calculated the combined diskhalo rotation curves for various and for kpc, corresponding to a range of at . Then we changed by 5% retaining the total disk mass and the initial (uncontracted) halo profile, and repeated the calculation to estimate for each value of . Our choice of and is representative of the Milky Way and the galaxies considered in this study. We will show below that our result is rather insensitive to reasonable variations in our disk and halo parameters. Experiments with showed that the finite change has no significant impact on the estimate of the gradient. In cases where a central bulge is included (§3.2), the spheroid remains unchanged when considering the small changes in for the gradient calculation. An example of such a contraction is shown in Fig. 7. The estimated gradients are shown as the short-dashed line connecting the open circles in Fig. 8. Note also that for low mass disks, , the gradient becomes positive, because the halo rotation curve is rising, and an increase in means that is measured at greater metric radii.
These results are insensitive to the adopted disk scale length or rotation curve amplitude provided representative values are used. If we choose kpc (4 kpc) in the calculations, the value of at a given increases (decreases) in the mean by only 0.03 (see Fig. 9) from our nominal case. Disk scale lengths for HSB galaxies vary typically between 2kpc and 6kpc (Courteau 1996). Similar modest excursions for are found if we use different rotation curve amplitudes. The value of is a slow function of the optical velocity, or , and is typically smaller than for HSB galaxies (the opposite is true for LSB galaxies). We have experimented with a range of halo velocities from 160 to 200 , or a variation in of 150 to 300 (depending on the cosmology). The value of increases in the mean by less than 0.03 per 10 increments in for a given disk mass and mass-to-light ratio. This is because the shape of the logarithmic NFW rotation curve changes little over such amplitude increments at . This is also depicted in Fig. 9. These tests were performed with and without a bulge component (see below). Thus our results are only weakly dependent on the exact value of and provided we use reasonable estimates for galaxies. Our nominal halo velocity, corresponds to for an CDM universe (Navarro 1998).
Our choice of baryon fraction is consistent with the latest D/H abundances (Burles & Tytler 1998, Levshakov et al. 1998) which give . The specific choice of is inconsequential for this analysis; results are essentially unchanged if we adopt (=70).
3.2 Central Bulge
Even considering the late-type spirals of our sample, the bulge component may not be dynamically negligible. Therefore, we repeated the above calculation including in the rotation curve calculation a spheroid with 20% of the disk mass and a scale radius of 500 pc. Such a bulge mass fraction is an upper-limit for these SbSc galaxies (BC97). We repeated the same analysis as above with this new component in the halo contraction and rotation curve calculation. The resulting are shown as the solid line connecting the triangles in Fig 9. It is evident that even a large bulge for these galaxies makes little difference for this calculation at (see also Mo et al. 1997).
3.3 Isothermal Halos with Cores
Finally, we explore how sensitive are these results to the particular functional form of the assumed dark matter profile. To this end, we repeated our calculations starting from an isothermal dark matter halo with an initial core radius . The resulting dependence of on is shown by the long-dashed line connecting the open squares in Fig. 8. The result is again quite similar to the previous two cases. Choosing a larger core radius makes little difference for heavy disks (), but leads to rotation curve shapes for very light disks that are linearly rising within , grossly inconsistent with the observations for these luminous, HSB disks (C97).
3.4 Dependence on Initial Halo Parameters
The derivative is a function of (at least) four variables: the initial values of (assumed to be directly coupled to the NFW concentration parameter) and , the disk size, mass and disk mass-to-light ratio. If the initial halo structure and size of the disk were coupled, i.e. if varied systematically with , it would change the interpretation of . To impact our conclusions, the denser, or more concentrated, halos of a given mass scale (NFW predict a 25 % scatter in their concentration parameter) would need to harbor larger than average disks. The dark matter could aid the lower surface brightness stellar disks to yield the same rotation speed at as that of their higher surface brightness cousins and remove any surface brightness trend in the TF relation, even in the presence of a near-maximal disk.
There seems to be broad agreement that (at least for systems with small bulges, i.e., little merging) the disk size is regulated by the initial angular momentum (e.g. Mo, Mao and White, 1998). For the purpose of our analysis, it suffices that there exists a monotonic mapping between total initial angular momentum and final disk size; this would mean that larger disks (at a given total baryonic mass) come from baryon/dark matter systems with higher initial spin parameters (see also §3.5.2 in Mo, Mao & White 1998). When considering halos of the same mass scale but with different spin-parameters one might suspect that the halos, too, become more extended (or less concentrated) at higher , analogous to the disks. In this case the surface mass density of both disk and halo would drop at higher , and one would necessarily expect an SB dependence of the TFR.
The halo concentration is found to be independent of the spin parameter (see also §3.5.2 in Mo, Mao & White 1998). Hence, at least in the context of hierarchical formation simulations, one would not expect any correlation between the (initial) halo structure and size of the disk. This is implicit in our derivation. We calculate using halo parameters that depend only on the total mass. Hence our conclusion is somewhat model dependent, but one which follows from current hierarchical scenarios. Note that the initial halo choice matters least for a dominant disk, where the final halo structure in the inner parts is predominantly determined by the (adiabatic) contraction process.
We have not investigated the (random) scatter in the initial halo concentrations but this would merely contribute to weakening our model-data comparison and the power of our statistical tests and we believe our conclusions to be conservative in this respect.
4 Discussion
The mean value of in both CF and MAT samples of exponential disks is . By taking the range of for which our models predict in this range (Fig. 8), we find a mean value of . This range can be widened if we adopt limits determined from each sample separately; in this case, we would have . Therefore, our mean relation is inconsistent with , the mimimum boundary for a “maximal disk” (Sackett 1997), at the 95% confidence level. This statement holds for any reasonable combination of , , the mass of the disk, and . That is, we have tested for any combination of our model input parameters and cannot produce for , the absolute maximum allowed by our global data222This statement applies to the data ensemble; clearly, it may be possible to find small sets of galaxies where exceeds 0.75..
The need to consider the actual distribution of the light in any dynamical measurements (e.g., mass decomposition), instead of assuming a priori an average luminosity profile, cannot be overemphasized (see e.g., Kalnajs 1983). We did indeed restrict our analysis to galaxies with a nearly pure exponential light profile. However, this distinction turns out to matter little for our statistical analysis. Inclusion of all types of galaxy profiles would bias the value towards larger fractions of dark-to-total matter at by no more than 15% of the actual value for pure exponential disks, with and a 95% upper limit of 0.66 (Courteau & Rix 1998). Inspection of Eqs. 1 and 2 shows that our analysis is insensitive to the assumption of exponential disks: as long as the rotation curve shape factor in Eq. 1, , does not depend strongly on at a fixed luminosity, Eq. 2 holds exactly. For the remainder of this discussion, we adopt the ratio as our nominal result.
Our main argument is based on possible correlations between and which can be ruled out statistically in the presence of the observed scatter. As long as the sources of the scatter are not systematically linked to the correlation of interest, their nature, cause or origin is inconsequential. For example, inclination errors and Hubble-flow distance errors are not systematically linked to either and and we did not consider them explicitly333 These merely soften the confidence limits on possible correlation slopes. Color gradients (dust, stellar populations) are relevant sources of scatter that might vary systematically with disk scale length. However, as we saw in §2.3, correction for color differences can only increase the ratio of dark-to-visible matter at . This is because the mean inferred value of is an upper limit to the contribution of the disk mass to the rotation speed at . The dynamical interpretation of this gradient is only slightly altered if we consider the dependence of stellar population on disk mass-to-light ratios (Bottema 1997, hereafter B97). B97 examined population differences between LSB and HSB galaxies using crude population synthesis arguments, and showed that dust or metallicity gradients in spiral galaxies can account for of Our own estimates in §2.3 using the population models of Vazdekis et al. 1996, suggest that the impact of age and dust on can be even larger with an increase of 25% in , or a 50% decrease of . This would lower to for color offsets from the mean. This value is in agreement with the data if the maximum observed color trends seen in Fig. 8 for and are removed from the distribution of . However, because colors depend strongly on the star formation history of the galaxy, more detailed chemical and spectral evolutionary models based on different galaxy formation scenarios (merging, extended collapse) are needed to address the interplay between colors and the dynamical properties of galaxies on firmer grounds (cf. e.g., Firmani & Avila-Reese 1998, Sommerville & Primack 1998).
Arguments in favor of sub-maximal disks have been given by van der Kruit (1995) and a few were highlighted in §1. Abiding by the definition that a disk is “maximal” if (Sackett 1997), we have effectively shown that non-barred late-type spirals are, on average, sub-maximal at , and that the halo contributes , within that radius. Sub-maximal disks with imply , a factor of two smaller than maximal disk values (Bottema 1993, BC97). This corresponds to twice more dark matter in the inner parts of late-type spirals than previously accounted for by maximal disk fits. Evolutionary synthesis models of spiral galaxies suggest mass-to-light ratios in the range 1-2444Although the range of ratios depends significantly on the choice of initial mass function. Here, we assume a Scalo IMF truncated at and in the -band, with possible extremes up to 5 for very red systems (Bruzual & Charlot 1993). Thus, there is good agreement between these models and our result. The same is also true with the work of Bottema (1993) who combined measurements of velocity dispersion, scale length, and scale height of exponential disks to infer that old disks contribute at most of the observed maximum rotation at a given luminosity. Another supportive result is that of Quillen & Sarajedini (1998) who find that low values of the disk in the range 1-2 are required to explain stable disks at . In order to avoid unrealistically thick disks, one must invoke a substantial amount of dark matter in the inner parts of these distant disks, in agreement with our study of low redshift galaxies.
Swing amplification theory (Athanassoula et al. 1987) puts a constraint on the density of galactic disks in order to preserve m=2,3 modes (and inhibit m=1 modes). The low values of observed here are in complete agreement with the observed spiral structure of late-type disks.
While our statistical argument favors sub-maximal disks in the majority of HSB non-barred disk galaxies, it does not completely exclude the possibility that some galactic disks could be maximal. Such disks are more likely to be found in lighter or less centrally concentrated halos or equivalently, systems of very high surface brightness or low angular momentum. Ostriker and Peebles (1973) have shown that a massive halo will suppress bar instabilities in the disk. Thus, it is not surprising that bar-dominated galaxies may exhibit a higher fraction of luminous-to-dark matter at their center, to the point of possibly being maximal (Quillen & Frogel 1998, Bottema & Gerritsen 1998, Debattista & Sellwood 1998, Weiner 1998).
The current analysis together with other recent studies, suggest a continuum of luminous-to-dark matter content in spiral galaxies directly proportional to their mean surface brightness (or initial angular momentum). LSB and dwarf galaxies appear to be fully DM dominated at all radii (Broeils 1992, Zwaan et al. 1995, Bottema 1997, Côté 1997, Dalcanton et al. 1997, de Blok & McGaugh 1997), non-barred HSBs are sub-maximal in their inner parts (Bottema 1993, this work), and bar-dominated galaxies which exhibit, on average, higher surface brightnesses than typical Tully-Fisher galaxies may possibly be maximal. Following this argument, one may infer that our Milky Way, if it does harbor a strong bar at its center, could indeed be maximal (Sackett 1997). More explorations of the central regions of our Galaxy and the structure of extragalactic disks and bulges are desperately needed.
5 Conclusion
We have shown that the TF relation, when cast as vs. , is independent of surface brightness for HSB galaxies. We are lead to interpret this empirical result as evidence for large quantities of non-luminous matter in the inner parts () of late-type galaxies. We have employed simple models for the contraction of the dark matter halo by adiabatic infall of baryons (the “luminous component”). For halos with initially rising rotation curves, this contraction leads to approximately flat, or featureless, rotation curves, and to a TF relation that is independent of surface-brightness, if in the mean. This analysis assumes that the initial halo structure is uncorrelated with the size of the resulting disk, as suggested by current cosmological simulations. Combined with the empirical TF evidence, this model invalidates the notion of maximal disks for the majority of HSB late-type spirals. Our result is independent of the shape of the luminosity profiles and large variations in our choice of model parameters.
Acknowledgements The authors would like to thank Roelof Bottema, Alice Quillen and Julio Navarro for useful comments, the referee Jerry Sellwood for a critical and insightful review, and Adrick Broeils for use of his software to produce Figs. 1 & 2.
References
- (1)
- (2) Athanassoula, E., Bosma, A., & Papaioannou, S. 1987, A&A, 179, 23
- (3) Bahcall, J., & Casertano, S. 1985, ApJ, 293, 7
- (4) Barnes, J. 1987, in Nearly Normal Galaxies, ed. S.M. Faber, (New York: Springer-Verlag), 154
- (5) Binney, J. & Tremaine, S. 1987, Galactic Dynamics (Princeton Univ. Press)
- (6) Blumenthal, G.R., Faber, S.M., Flores, R., & Primack, J.P. 1986, ApJ, 301, 27
- (7) Bottema, R. 1993, A&A, 275, 16
- (8) Bottema, R. 1997, A&A, 328, 517
- (9) Bottema, R. & Gerritsen, 1998, MNRAS, 290, 585
- (10) Broeils, A.H. 1992, Ph. D. thesis, Univ. of Groningen, The Netherlands
- (11) Broeils, A.H. & Courteau, S. 1997, in Dark and Visible Matter in Galaxies and Cosmological Implications, eds. M. Persic & P. Salucci (San Francisco: ASP, Vol. 117), 74 [BC97]
- (12) Bruzual, A.G. & Charlot, S. 1993, ApJ, 405, 538
- (13) Buchhorn, M. 1992, Ph.D. thesis, Australian National Univ.
- (14) Burles, S. & Tytler, D. 1998, in Proceedings of the Second Oak Ridge Symposium on Atomic and Nuclear Astrophysics, ed. A. Mezzacappa.
- (15) Burstein, D. & Rubin, V. 1985, ApJ, 297, 423
- (16) Byun, Y.I. 1995, ApJ, 448, 563
- (17) Carignan, C. & Freeman, K.C. 1985, ApJ, 294, 494
- (18) Casertano, S. 1983, MNRAS, 203, 735
- (19) Casertano, S. & van Gorkom, J.H. 1991, AJ, 101, 1231
- (20) Côté, S. 1997, in Dark and Visible Matter in Galaxies and Cosmological Implications, eds. M. Persic & P. Salucci (San Francisco: ASP, Vol. 117), 52
- (21) Courteau, S. 1992, Ph.D. thesis, Univ. California, Santa Cruz
- (22) Courteau, S. 1996, ApJS, 103, 363
- (23) Courteau, S. 1997, AJ, 114, 2402 [C97]
- (24) Courteau, S., Faber, S.M., Dressler, A., & Willick, J.A. 1993, ApJ, 412, L51
- (25) Courteau, S., & Rix, H.W. 1998, in Galactic Halos, ed. Dennis Zaritsky (San Francisco: ASP, Vol. 136), 196
- (26) Dalcanton, J.J., Spergel, D.N., & Summers, F.J. 1997, ApJ, 482, 659
- (27) Debattista, V.P. & Sellwood, J.A. 1998, ApJ, 493, L5
- (28) de Blok, W.J.G. & McGaugh, S.S., 1997, MNRAS, 290, 533
- (29) de Grijs, R., Peletier, R.F., & van der Kruit, P.C. 1997, A&A, 327, 966
- (30) de Jong, R.S. 1995, Ph.D. thesis, Univ. of Groningen, The Netherlands
- (31) Flores, R., Primack, J.P., Blumenthal, G.R., & Faber, S.M. 1993, ApJ, 412, 443
- (32) Flynn & Fuchs 1994, MNRAS, 270, 471
- (33) Freeman, K.C. 1970, ApJ, 160, 811 (see also Binney & Tremaine 1987, Eq. 2-169)
- (34) Freeman, K.C. 1993, in Physics of Nearby Galaxies: Nature or Nurture?, Eds. R.X. Thuan, C. Balkowski, J.Thanh Van (Paris: Frontières), 201
- (35) Kalnajs, A.J. 1983, in Internal Kinematics of Galaxies, IAU Symp. 100, ed. E. Athanassoula (Dordrecht: Reidel), 87
- (36) Knapen, J., & van der Kruit, P. C. 1991, A&A, 248, 57
- (37) Kuijken, K. 1995, in Stellar Populations, IAU 164 (Dordrecht: Kluwer), 195
- (38) Kuijken, K. & Gilmore, G. 1991, ApJ, 367, 9
- (39) Levshakov, S.A., Kegel, W.H. & Takahara, F. 1998, ApJ, 499, 1
- (40) Martin, P. & Roy, J.R. 1994, ApJ, 424, 599
- (41) Mathewson, D. S., Ford, V. L., & Buchhorn, M. 1992, ApJS, 81, 413
- (42) McKeith, C.D., Castles, J., Greve, A., & Downes, D. 1993, A&A, 272, 98
- (43) Mo, H.J., Mao, S., & White, S.D.M. 1998, MNRAS, 295, 319
- (44) Moore, B. 1994, Nature, 370, 629
- (45) Navarro, J.F. 1998, in Galactic Halos, ed. Dennis Zaritsky (San Francisco: ASP, Vol. 136), 409
- (46) Navarro, J.F., Frenk, C.S., & White, S.D.M. 1996, ApJ, 462, 563 [NFW]
- (47) Ostriker, J.P. & Peebles, P.J.E. 1973, ApJ, 186, 467
- (48) Peletier, R.F. & Balcells, M. 1997, New Astronomy, 1, 349
- (49) Prada, F., Beckman, J.E., McKeith, C.D., Castles, J., & Greve, A. 1994, ApJ, 423, 35
- (50) Press, W.H., Teukolsky, S.A., Vettering, W.T., & Flannering, B.P. 1992, Numerical Recipes (Cambridge Univ. Press)
- (51) Ryder, S.D. 1995, ApJ, 444, 610
- (52) Quillen, A.C. & Sarajedini, V.L., 1998, AJ, 115, 1412
- (53) Quillen, A.C. & Frogel, J. 1997, ApJ, 487, 603
- (54) Sackett, P.D. 1997, ApJ, 483, 103
- (55) Savage, B. and Mathis, J., 1979, ARA&A, 17, 73.
- (56) Sommerville, R. S., & Primack, J.R. 1998, astro-ph/9802268
- (57) Strauss, M. A. & Willick, J. A. 1995, Phys. Rep., 261, 271
- (58) Tully, R.B. & Fisher, J.R. 1977, A&A, 54, 661
- (59) Tully, R.B., Mould, J.R., & Aaronson, M. 1982, ApJ, 257, 527
- (60) van Albada, T.S. & Sancisi, R. 1986, Phil. Trans. R. Soc. Lond., 320, 447
- (61) van der Kruit, P.C. 1988, A&A, 192, 117
- (62) van der Kruit, P.C. 1995, in Stellar Populations, IAU 164 (Dordrecht: Kluwer), 205 [vdK95]
- (63) Vazdekis, A., Casuso, E., Peletier, R. F., & Beckman, J.E. 1996, ApJS, 106, 307
- (64) Weiner, B.J. 1998, PhD thesis, Rutgers Univ.
- (65) Willick, J.A., Courteau, S., Faber, S.M., Burstein, D., Dekel, A. & Strauss, M.A. 1997, ApJS, 109, 333
- (66) Zaritsky , D., Kennicutt, R.C., & Huchra, J.P. 1994, ApJ, 420, 87
- (67) Zhao, H.-S., Spergel, D.N., & Rich, R.M. 1995, ApJ, 440, L13
- (68) Zwaan, M.A., van der Hulst, J.M., de Blok, W.J.G., & McGaugh, S.S. 1995, MNRAS, 273, L35
- (69)