Radio and Optical Follow-up Observations and Improved IPN Position of GRB 970111
Abstract
We report on Westerbork 840 MHz, 1.4 and 5 GHz radio observations of the improved IPN–WFC error box of the -ray burst GRB 970111, between 26.4 hours and 120 days after the event onset. In the 13 sq arcmin area defined by the IPN (BATSE and Ulysses) annulus and the published refined BeppoSAX Wide Field Camera (WFC) error box we detected no steady sources brighter than 0.56 mJy (), and no varying radio emission, down to 1.0 mJy (4). We also report on and band observations of the error box with the 4.2 m William Herschel Telescope at La Palma.
1 Introduction
The ‘isotropic’ and ‘inhomogeneous’ distribution of gamma-ray bursts (GRBs) (Meegan et al. 1992; Briggs et al. 1996) is explained in a natural way if GRB sources are located at cosmological distances of order Gpc (Usov and Chibisov 1975; Paczyński 1986; Goodman 1986; Fenimore et al. 1993). However, a GRB source distribution in a very large galactic halo (characteristic size pc) is also advocated (see, e.g., Podsiadlowki et al. 1995). Independent of what the distance scale of GRB sources is, the mechanism that gives rise to the sudden emission of gamma rays is unknown, and it is generally believed that progress in solving this problem requires the detection of GRB counterparts in other parts of the electromagnetic spectrum. Very promising in providing new insights to the origin and production mechanism of GRBs are the recent discovery of an optical transient related to GRB 970228 (Van Paradijs et al. 1997; Groot et al. 1997a), and the monitoring of its optical light curve (Galama et al. 1997a; Sahu et al. 1997). The optical transient may be associated with a faint galaxy (Van Paradijs et al. 1997; Groot et al. 1997b), suggesting that it lies at a cosmological distance.
The peak luminosities of GRBs are highly super-Eddington, even for galactic halo models. Paczyński and Rhoads (1993) pointed out that it is hard to avoid relativistic outflows from the GRB source, and that the interaction of these flows with an interstellar medium must generate radio emission, as is observed, e.g., in extragalactic jet sources (see also Katz 1994b; Mészáros et al. 1994, Mészáros and Rees 1997). Paczyński and Rhoads estimated that the strongest GRBs may be followed by transient ( mJy) radio emission at intervals ranging between minutes (for the galactic-halo distance scale) to roughly weeks to months (for the cosmological distance scale).
We report here on observations of the refined error box of GRB 970111 (In ’t Zand et al. 1997) made with the Westerbork Synthesis Radio Telescope (WSRT) in the months following the burst, and the derivation of a substantially improved Interplanetary Network (IPN) error box based on the time delay between the burst as observed with the Burst And Transient Source Experiment (BATSE) and Ulysses. In Section 2 we describe the properties of the GRB as observed with BATSE, and present the IPN-BeppoSAX error box. In Section 3 we describe the radio and optical observations, the results of which are discussed in Section 4.
2 GRB 970111 gamma-ray observations
2.1 BATSE observations
GRB 970111 triggered BATSE on 11 January, 1997 at 09:44:00 UT. Here we describe data obtained with the Large Area Detectors (LADs); a detailed description of the instrument is given elsewhere (Fishman et al. 1989). Fig. 1 shows the burst profile (with 1.024 s time resolution) in four energy channels (25-50, 50-100, 100-300, 300 keV). The event duration is s, estimated from the summed signal of all energy channels (T90 is the time during which 90% of the total burst counts are emitted; Kouveliotou et al. 1993).
When we fit a broken power law to the event energy spectrum we find that the total 25 keV - 1.8 MeV fluence during 48.4 s of emission is ergs cm-2. This fluence is among the top 1% of all GRBs observed with BATSE so far. The event peak flux (summed over the same energy range in 1.024 s interval) is ergs cm-2s-1, which makes GRB970111 one of the top 5% brightest BATSE events. A slightly better fit is obtained using the Band function (Band et al. 1993), for which we find that the spectral power peaks at = 1661 keV.
In the burst profile summed over all channels we distinguish five peaks: channel 4 shows only the first three, channel 1 shows only the last four of them. The peaks occur at times (since trigger) s, s, s, s, and s. Thus, this event shows strong spectral evolution, with the first peak having a very hard spectrum starting above keV, and the last two having much softer spectra. This is confirmed in the BeppoSAX Wide Field Camera observations (WFC; energy range 1.8-30 keV) in which there are only two peaks starting and s, respectively, after the BATSE trigger time. Spectral evolution in GRBs is well known; GRB 970111 is an extreme example of late pulses disappearing entirely at high energies (see Ford et al. 1995 for a detailed description of spectral-evolution trends of bursts observed with BATSE).
The burst location using the directional response of the BATSE detectors that recorded the burst was and (J2000) with a total error of 1.5∘ (statistical and systematic added in quadrature). Fortunately, besides the two near-Earth satellites CGRO and BeppoSaX, the event was also recorded with the Ulysses spacecraft, which allowed the derivation of a very narrow and short IPN annulus (see Hurley et al. 1994 for a description of IPN error boxes).
2.2 IPN–BeppoSax WFC combined error box
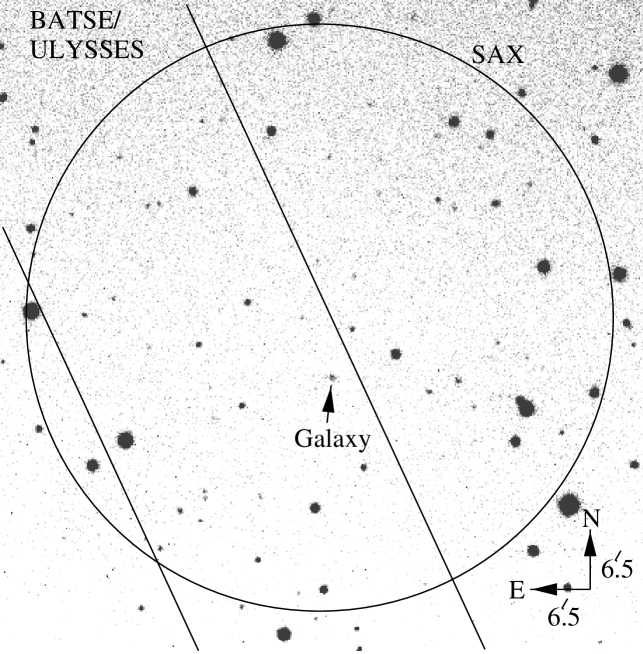
Triangulation of this event using Ulysses and BATSE data gives an annulus of possible arrival directions. This annulus is centered at 50m55.4s, +33∘21′57′′(J2000), and has a radius of (3 confidence). It is consistent with the one given by Hurley et al. (1997a), but narrower. Combining this annulus with the refined BeppoSAX WFC error circle (In ’t Zand et al. 1997) gives an approximately trapezoidal error box whose corners are at , 28m22s, 28m28s, 28m09s, 28m21s, (J2000), and whose area is approximately 13 square arcminutes (see Fig. 2). Of the three SAX and ROSAT quiescent soft X-ray sources (Butler et al. 1997; Voges et al., ibid) found in the preliminary WFC error circle (Costa et al. 1997) none lies within this error box.
3 Radio and Optical Observations
3.1 Radio Observations
The error box of GRB 970111 was first observed at 840 MHz with the WSRT at the preliminary position given by Costa et al. (1997) on January 12, at UT 12:51, starting 26.4 hours after the event, for only 1.44 hours until the GRB source exceeded the telescope hour-angle limit. Subsequent 12 hour observations were made on January 13.31, 14.31, 16.31, 20.30 and 29.27, March 9.16, and April 9.08 UT (these and subsequent observing times refer to the middle of the observing period).
We used a new UHF receiving system, whose upper frequency band covers the 700–1200 MHz range, and selected 840 MHz because electromagnetic interference (EMI) is usually absent there. The standard continuum correlator was used, providing us with eight contiguous 10 MHz bands from 800 to 880 MHz. The noise level in a continuum map for a 10 MHz bandwidth after 12 hours of integration is typically 0.5 mJy beam-1, and our analysis shows that this was usually achieved in the present series of measurements. At 840 MHz, the synthesized beamwidth at declination is , and the field of view (half-power beamwidth) is about .
We also observed at 5 GHz on each of February 26.05 (5.15 hrs) and 27.29 (5.55 hrs) and March 2.22 (10.24 hrs). With 8 bands of each 10 MHz width we obtained noise levels 0.15 mJy per observation. The synthesized beamwidth at declination is . The field of view (half-power beamwidth) is about .
The latest observations were each for 8.4 hours at 1.4 GHz on May 11.07 and 12.06 (120.6 days after the event). The 1.4 GHz data consist of 5 bands of width 10 MHz (two were bad) and 3 bands of width 5 MHz, providing a useful 45 MHz of bandwidth. The noise level combining the two 1.4 GHz observations is 0.070 mJy. The synthesized beamwidth at declination at 1.4 GHz is . The field of view (half-power beamwidth) is about .
The data were analyzed using the NEWSTAR software package111http://www.nfra.nl:80/newstar/. The interferometer complex visibilities were first examined for possible EMI and other obvious defects. Bands with strong interference were either deleted or carefully edited. Due to interference about 45 % of the data were unusable in the January 14 observation. On the other days interference was usually limited to about 10 %. In the self calibration (gains and phases) we used models for each of the 8 bands around 840 MHz, each containing nearly 80 discrete sources above 2.5 mJy. For calibration of interferometer gain and phase, for each observation and each band, we used the standard WSRT calibrator 3C 48 (24.05 Jy at 840 MHz, 15.96 Jy at 1.4 GHz and 5.55 Jy at 5 GHz; based on the 3C286 flux density on the Baars et al. 1977 scale). The 840 MHz map of the field produced by combining data from January 13, 14, 16 20, 29 and March 9 is shown in Fig. 2. The 1.4 GHz observations have been analyzed in a similar way, but no self calibration was performed. The 5 GHz observations contained only very weak sources within the field of view and hence no model has been obtained and no self calibration was performed.
We searched for a transient radio counterpart by looking for variability at 840 MHz within the refined WFC-Ulysses-BATSE error region. Since all our observations were obtained with the same configurations of the Westerbork array, the synthesized beams of the images for different days are in principle the same. The most sensitive way to look for variations in the data is via the construction of difference maps from residual maps, i.e. maps deconvolved with a model containing all real sources in the field. We obtained equal synthesized beams in the residual maps of two observations by retaining only those points in common to the datasets of any two days in the comparison. Subsequently, we subtracted the two maps from each other and obtained the difference map. In these difference maps we did not detect any source variation in the 13 square arcminute error box of GRB 970111, down to 1.0 mJy (4) for the period of 26.4 hours to 88 days after the burst, and down to 2.4 mJy (4) for the first observation (January 12; see Fig. 3).
Since no radio source is found in the error box at any of the observing frequencies (840 MHz, 1.4 and 5 GHz) the 1.4 and 5 GHz upper limits to variability have been determined by considering the limit for detection of a radio source (for which we take 4, corresponding to 0.28 mJy at 1.4 GHz and 0.6 mJy at 5 GHz; see Fig. 3).
3.2 Optical Observations
We made , , and band images of the refined error box of GRB 970111 using the 4.2m William Herschel Telescope (prime focus) on La Palma in service time. On Feb. 28.2 UT , and images were obtained with integration times of 930, 405, and 695 s, respectively, and an image (405 s) on Mar. 1.1 UT. The field of view is 72 72. Fig. 4 shows a -band image of the region covering the WFC error box of GRB 970111. We made a and magnitude calibration with images of the photometric Landolt standard field 107 using stars 599-602. For the magnitude calibration we used Landolt standard field 104, star 334, 336, 338 and 339. Comparison with the Digital Sky Survey shows no brightening of sources to V = 19. The two radio sources located near to the error box (Sect. 4) show no counterpart down to = 23.7, = 24.0, = 22.9 and = 21.7. The combined GRB error box contains a few galaxies above the detection limit. One is a relatively bright galaxy (see Fig. 3), at = 15152, = +19 (equinox 2000.0), with = 20.2 0.1, = +1.3 0.1, = +0.7 0.1, = +1.4 0.1. This galaxy is not detected in the radio observations at 840 MHz ( 0.42 mJy, 3), 1.4 GHz ( 0.21 mJy, 3) and 5 GHz ( 0.45 mJy, 3).
4 Discussion
Using the combined map based on observations made on 12, 13, 16, 20, 29 January and March 9, we find no 840 MHz radio sources in the error box of GRB 970111 (see Fig. 2), down to the detection limit of 0.56 mJy (4). The () detection limits at 1.4 GHz and 5 GHz are 0.28 mJy and 0.6 mJy, respectively. (Note that the limits reported in Section 3.1 refer to variability of any radio source in the error box). Two sources lie just outside the error box at , = 15128 01, +19 (J1528.2+1933) and , = 15049 01, +19 2 (J1528.1+1935). The 840 MHz, 1.4 and 5 GHz fluxes are as follows: 1.13 0.14 mJy, 0.275 0.07 mJy and 0.45 mJy (J1528.2+1933), and 0.42 mJy, 0.21 mJy and 0.80 0.15 (J1528.1+1935) (upper limits are 3 ). The source A reported by Galama et al. (1997b) appeared, after the final analysis of subsequent observations, to be a noise peak.
Previous follow-up radio observations have not led to the detection of a variable radio signal that is possibly correlated with a GRB (see, e.g., the recent review by Vrba 1996). The deepest radio follow up at short intervals so far is that by Frail et al. (1994) who obtained upper limits of 3.5 mJy to variability at 1.4 GHz , within 3 to 99 days of GRB 940301, from observations of the COMPTEL error box of this burst (Frail et al. 1994). Galama et al. (1997c) derived upper limits of 10 mJy to variability at 325 MHz during an interval of 1 to 3 months after GRB 940301. Our present results improve the response time of Frail et al. (1994) by a factor 3. A similar improvement has been reported by Frail et al. (1997a).
To interpret our null result, we take as a guideline the work of Paczyński and Rhoads, which is based on the idea that GRBs are caused by the interaction of a relativistically expanding fireball with the interstellar medium (with density g cm-3). From their results (see their Eqs. 18b and 19b) we estimate, using a burst fluence erg cm-2 and an observing frequency of 840 MHz, that the peak radio flux and the time since the GRB that this peak is reached are given by: and ; here is the source distance in units of 0.5 Gpc. (In these estimates we have set several of the dimensionless constants occurring in these equations equal to unity). During the rise of the radio transient the flux increases with time proportional to ; the decay goes as .
The model of Katz (1994a,b) predicts an initial 840 MHz flux (simultaneous with the GRB, taken to emit ergs cm-2 in 30 s, over a 4 Hz bandwidth centered at Hz) of Jy. This flux rises proportionally to until it reaches a peak, roughly 30 s (840 MHz/4 1019 Hz)-5/12 10 days later, around 5 mJy. Thus, the models of Paczyński and Rhoads and of Katz predict radio afterglows for GRB 970111 that are quite similar.
GRB 970111 was extremely strong: it was among the top 1% of BATSE bursts with respect to fluence, and the top 5% with respect to peak flux. In the cosmological model for GRBs the turnover in the cumulative burst peak flux distribution occurs at redshift (e.g., Fenimore et al. 1993). Since the luminosity distribution of observed bursts is not very broad (see, e.g., Horack et al 1994; Ulmer et al. 1995) this indicates that GRB 970111 originated at a rather modest redshift (of order 0.1). We will therefore, in the following, assume a nominal source distance of 0.5 Gpc.
In Fig. 3 we have plotted our upper limits as a function of time since the burst, together with some of the best previous limits, and three curves showing the radio behaviour according to the above expressions derived from the Paczyński and Rhoads model. It appears that our observations exclude the model of Paczyński and Rhoads at its nominal parameters (the same is the case for the Katz model). They suggest that for the model to be viable, GRB 970111 should either have come from very nearby ( kpc, peaking within a few minutes of the burst), or from a very large distance ( Gpc, with a peak after many months, in which case its peak luminosity would have been exceptionally high), or it occurred with a high efficiency of gamma-ray production in regions of very low ambient density.
Although our non-detection of a radio counterpart for GRB 970111 nominally excludes the models of Paczyński and Rhoads (1993) and of Katz (1994a,b), we feel that in both models there are enough scaling factors that disagreement by about one order of magnitude is not yet compelling evidence that the models are qualitatively wrong. Moreover, at low radio frequencies the emission may be limited by self-absorption (e.g. Katz 1994a).
After the revised version of this paper was near completion we learnt of the detection of an optical and radio counterpart of GRB970508 (Bond 1997; Frail et al. 1997b). The inverted spectrum observed for this radio counterpart is evidence for the occurence of self-absorption. The measurement of a redshift ( 0.835, Metzger et al. 1997) of the optical counterpart of GRB 970508 may have settled the distance scale to GRB sources. It is clear that the relative response in radio is far from proportional to the strength of the GRB; the same is the case for the optical response (Castro-Tirado et al. 1997). It is currently unclear what GRB characteristic determines the low-energy response to GRBs, and more follow-up observations are required to unravel their systematics.
We will continue monitoring the error box of GRB 970111 in an attempt to detect any delayed radio signal from this event.
References
- (1)
- (2) Baars, J.W.M. et al. 1977, A&A, 61, 99
- (3) Band, D. et al. 1993, ApJ, 413, 281
- (4) Bond, H. 1997, IAU Circ., 6654
- (5) Briggs, M.S. et al. 1996, ApJ, 459, 40
- (6) Butler, R.G. et al. 1997, IAU Circ., 6539
- (7) Castro-Tirado, A. et al. 1997, IAU Circ., 6598
- (8) Costa, E. et al. 1997, IAU Circ., 6533
- (9) Fenimore, E.E. et al. 1993, Nature, 366, 40
- (10) Fishman, G.J. et al. 1989, in Proc. of the GRO Science Workshop, ed. W.N. Johnson, p. 2
- (11) Ford, L.A. et al. 1995, ApJ, 439, 307
- (12) Frail, D.A. et al. 1994, ApJ, 437, L43
- (13) Frail, D.A. et al. 1997a, IAU Circ., 6545
- (14) Frail, D.A. et al. 1997b, IAU Circ., 6662
- (15) Galama, T.J. et al. 1997a, Nature, 387, 479
- (16) Galama, T.J. et al. 1997b, IAU Circ., 6571
- (17) Galama, T.J. et al. 1997c, A&A, 321, 229
- (18) Goodman, J. 1986, ApJ, 308, 47
- (19) Groot, P.J. et al. 1997a, IAU Circ., 6584
- (20) Groot, P.J. et al. 1997b, IAU Circ., 6588
- (21) Horack, J.M., Emslie, A.G., & Meegan, C.A. 1994, ApJ, 426, 5.
- (22) Hurley et al. 1994, in AIP Conf. Proc. 307, Gamma-Ray Bursts, 2nd Huntsville Symposium, ed. G.J. Fishman, J.J. Brainerd, K. Hurley, p. 27
- (23) Hurley et al. 1997a, IAU Circ., 6571
- (24) In ’t Zand, J. et al. 1997, IAU Circ., 6569
- (25) Katz, J.I. 1994a, ApJ, 422, 248
- (26) Katz, J.I. 1994b, ApJ, 432, L107
- (27) Koranyi, D.M. et al. 1995, MNRAS, 276, L13
- (28) Kouveliotou, C. et al. 1993 ApJ, 413, L101
- (29) Meegan, C.A. et al. 1992, Nature, 355, 143
- (30) Mészáros, P., Rees, M.J., Papathanassiou, H. 1994, ApJ, 432, 181
- (31) Mészáros P., and Rees, M.J. 1997, ApJ, 476, 232
- (32) Metzger, M. et al. 1997, IAU Circ., 6655
- (33) Paczyński, B. 1986, ApJ, 308, 43
- (34) Paczyński, B., Rhoads, J.E. 1993, ApJ, 418, L5
- (35) Podsiadlowski, P., Rees, M.J., Ruderman, M., 1995, MNRAS, 273, 755
- (36) Sahu, K.C. et al. 1997, Nature, 387, 476
- (37) Ulmer, A., Wijers, R.A.M.J., Fenimore, E.E. 1995, ApJ, 440, 9
- (38) Usov, V.V. and Chibisov, G.V. 1975, Sov. Astron., 19, 115
- (39) Van Paradijs, J. et al. 1997, Nature, 386, 686
- (40) Voges, W., Boller, T., Greiner, J. 1997, IAU Circ., 6539
- (41) Vrba, F.J. 1996, in AIP Conf. Proc. 384, Gamma-Ray Bursts, 3rd Huntsville Symposium, ed. C. Kouveliotou, M.F. Briggs, G.J. Fishman, p. 565
- (42)