The first X–ray localization of a –ray burst by BeppoSAX and its fast spectral evolution
Abstract
In this paper we present the observations performed by the BeppoSAX Gamma–Ray Burst Monitor (GRBM) and Wide Field Cameras (WFC) of GB960720. We derive a precise localization (3 arcmin radius) and fast broad band ( keV) spectral evolution of the event. A search in the catalogues at all wavelengths in the error box yields a unique outstanding source: the bright radio quasar 4C 49.29. Although the probability of finding such a source by chance is very low ( ), the absence of similar counterparts in other small error boxes suggests a chance occurrence. We also find that the duration-energy relationship for bursts previously observed above 25 keV (Fenimore et al. 1995) extends down to 1.5 keV. This result suggests that the same radiation mechanism is ope-rating from X–rays to gamma–rays and is in agreement with radiative cooling by synchotron emission. A fast evolution of the spectrum is found, in which the ratio of X- to gamma–ray intensities varies over three orders of magni-tude. Furthermore, the spectrum in the initial phase of the event betrays the presence of an optically thick source rapidly evolving in a thin configuration. No other class of sources in the universe shows such a fast and extreme evolution. These results pose new and tighter constraints on theoretical models for gamma–ray bursts.
Key words: Gamma Ray Burst: localization – spectral evolution
1 Introduction
More than twenty years after their discovery (Klebesadel et al. 1973), the origin of gamma–ray bursts is still one of the great mysteries in astrophysics. The main reason is the difficult identification of a counterpart. Accurate position determination has been provided in the past only for a few dozens events (Atteia et al. 1987, Boer et al. 1994). The X–ray astronomy satellite BeppoSAX (Piro et al. 1995, Boella et al. 1997), a major program of the Italian Space Agency (ASI) with participation of the Netherlands Agency for Aerospace Programs (NIVR), represents a step forward, in that it combines a gamma–ray burst monitor (GRBM) with two X–ray wide field cameras (WFC), allowing simultaneous detection, 3 arcmin localization and X to –ray spectral measurements of GRB’s. The GRBM ( keV, Costa et al. 1997a) is based on four CsI scintillator slabs, orthogonal to the NFI and each one to the next one. The WFC (Jager et al. 1997) are coded mask proportional counters, operating in the keV range. They are pointed in opposite directions at 90∘ from the axis of Narrow Field Instruments (NFI) and are co-aligned with two of the GRBM slabs. They watch the X–ray sky with a full field of view of , with a spatial resolution of 5 arcmin (FWHM). Positions can be derived with accuracies from 1 to 5 arcmin.
The paper is structured as follows: in sect. 2 we present the observation of the event, discussing in particular the localization and the association with a potential counterpart. In sect.3 we present the broad band light curves and discuss the relationship between the pulse duration and energy. In sect. 4 we show the time resolved broad band spectra of the event and discuss some of the implications derived from the observed strong spectral evolution of the event.
2 Observation
On July 20, 1996 11:36:53 UT a gamma–ray burst (GB960720) was simultaneously detected in the GRBM and one WFC. The same event was detected by BATSE, (trigger n.5545, BATSE team and BACODINE, private communication). The burst had a peak flux of 1300 cts/s in the GRBM (corresponding to ), and 82 cts/s (corresponding to after correction for the off-axis position) in the WFC. The total flux emitted was . The value of of the peak luminosities of this relatively weak burst is similar to that found in brighter events (Laros et al. 1982, Yoshida et al. 1989).
The sky image of the full field of view of the WFC obtained in 15 s on the burst is shown in Fig. 1. a)
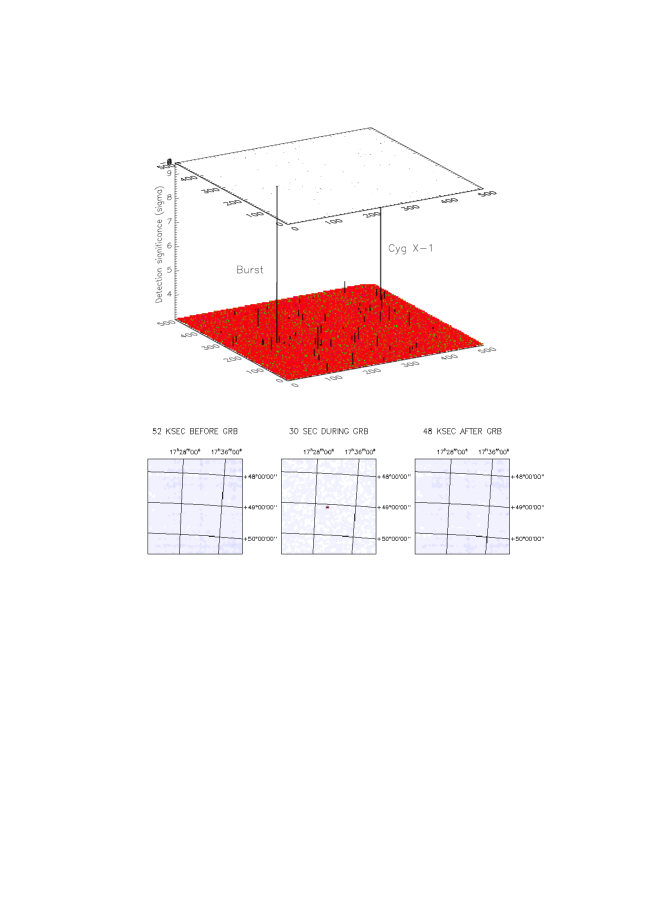
The 40∘ wide field shows the burst and, close to the edge, the well known X–ray source Cyg X-1. The Palomar Survey shows several objects within the 3 arcmin radius error circle. The only one identified in catalogues is the radio loud quasar 4C 49.29, with a flux of 2 Jy at 408 MHz (Reid et al. 1995). Considering all the radio sources with a flux brighter than that of the quasar (Colla et al. 1972) and the fraction of quasars in the radio source population at this flux level (Singal et al. 1993) the probability of chance occurence is about . The association of the gamma ray burst with a radio loud quasar is very tempting, considering the environment and radiation mechanisms supposedly operating in these two classes of sources. One of the most common explanation of the gamma–ray burst phenomenon, the fireball model (Rees & Mészáros 1992), involves relativistic expansion of a population of electrons that radiates mostly via synchrotron process. This is similar, but for the much greater Lorentz factor involved in the fireball models, to the scenario of radio loud quasars. However this is the only radio loud quasar found in a small gamma–ray burst error box, so that it may be a chance occurence. More data are needed to confirm the association.
A deep pointing (56 ksec) of the field was performed on Sept. 3, 1996 with the Narrow Field Instruments. The 45 days delay between burst trigger and NFI observation of the WFC error box is due to the fact that the simultaneous detection in WFC and GRBM of the event was discovered during off-line analysis. The NFI data confirm that a faint X-ray emission (F(2-10 keV)=) is associated with the quasar (Piro et al. 1996). However both the X-ray luminosity of erg s-1 (at a redshift z=1.038 (Reid et al. 1995), H0=50 km/s/Mpc) and the ratio of the X–ray to the optical flux ( ( Walsh et al. 1984)) are typical of a quasar (Maccacaro et al. 1980) and therefore not immediately related to afterglow activity of the gamma–ray burst.
Information on afterglow activity in X–rays on much shorter time scales can be derived from the observation with the WFC. The observation covers a period of about 100,000 s centered in time on the event. In Fig.1b we show the images of the field in time sequence. No si-gnificant emission is detected above the background either before of after the burst, with a upper limit of , 200 times lower than the peak flux. Any signature of an X–ray halo produced by dust scatte-ring in our Galaxy, — whose measurement would provide a direct test for a local vs. galactic halo / extragalactic origin (Pacinski 1991, Klose 1994) — would remain below the upper limit of the WFC by three orders of magnitude.
3 Pulse duration from X–rays to gamma–rays
Simultaneous X–ray to gamma–rays observation provide important information to constraint radiative mechanisms operating in gamma–ray bursts. The light curve in Fig. 2 shows that the burst duration increases with decreasing energy, from about 2 s in the keV range to about 16 s in the keV range. This behaviour was observed in the past by other spacecraft experiments (Laros et al. 1982, Yoshida et al. 1989).

In Fig. 3 we show that this dependency can be expressed as
| (1) |
in the whole band from 1.5 to 700 keV. This is consistent with BATSE results at higher energies (Fenimore et al. 1995), suggesting that the emission mechanism is the same from soft X–rays to gamma–rays. In particular it is consistent with what predicted by radiative cooling by synchrotron losses (Tavani 1996). On the reverse eq. (1) argues against a scenario in which X–rays and gamma–rays are produced by the same population of electrons via synchrotron and Inverse Compton processes respectively (Self–Synchro–Compton). In this case we would expect to observe a similar duration in the X–ray and gamma–ray range. In fact, an electron with Lorentz factor will produce X–ray and gamma–ray photons with the same cooling time . Eq. (1) also argues against models where the duration of the burst is independent of energy, as in some realizations of the fireball models, where the burst duration is determined by the hydrodynamical time scale (Sari et al 1996).

4 Broad band spectral evolution
Hard to soft spectral evolution appears to be a common – though not ubiquitous – property of gamma–ray bursts (Yoshida et al. 1989); this is also a distinct feature of this burst, as clear From Fig. 2. Moreover, from Fig. 4, a blow up of the initial part of the GRB, it is evident how the rise time remarkably depends on photon energy. The event starts with a sudden emission of gamma–ray photons (Fig. 4, lower panel), while the emission at lower energies is negligible (Fig. 4, upper panel).

As the gamma–ray emission decays with a time scale of s, the X–ray luminosity increases with a similar time scale. This behaviour can be better understood by analyzing the time resolved spectra (Fig. 5) which show indeed a strong variation, with the power law photon index () varying from to . After a few seconds the radiative output channel of the source goes from photons with E keV (, as from Fig. 5), to photons with E keV ().

This result extends to lower energies the spectral evolution observed above keV by BATSE, which shows that the peak of the energy distribution decreases substantially during the burst decay (Ford et al. 1995, Liang & Kargatis 1996).
We note that in the first second of the event there is an indication that the spectral photon index is higher than the maximum value () expected in the case of optically thin synchrotron emission (Ribicki & Lightman 1979). A similar evidence at the higher energies covered by BATSE has been observed by Crider et al. (1997). If synchrotron emission is the mechanism producing the photons of the burst, then our result could be explained with the presence of self-absorption in the initial part of the event. The source then quickly evolves and after 2 seconds the spectral index becomes consistent with that expected in the optically thin case (table 1).
Although the data do not permit to constrain complex spectral shapes, we have attempted to verify the consi-stency of the data with the scenario expected from synchrotron emission. We have assumed a fast evolving synchrotron spectrum characterized by self absorption at and a break frequency at that should correspond to the minimum energy of the electron distribution. Below we have assumed the optically thick slope of 1.5, while between and we have adopted a slope of , e.g. that expected by optically thin synchrotron emission below the minimum energy of the electron distribution. Above the emission is determined by the electron distribution, and in this case we have adopted a power law with slope fixed to the value of 2.4, the asymptotical value observed in the last part of the event. The connection between the different power laws has been modelled via a Band formula (Band et al., 1993). In order to further reduce the number of free parameters, we have assumed that in the first 2 seconds is at energies greater than 700 keV, and that in the following evolution has an energy below 1 keV. The only free parameters were then one of the two break energies and the normalization. From Table 1 (right colums) we see that in the first 2 seconds evolves very rapidly from hard X–rays to a few keV. In the following evolution a similar behaviour is observed for .
As mentioned before, this spectral evolution could explain well the shape of the light curves observed at the different energies. The X-ray emission in the first seconds corresponds to a photon spectrum rising in energy, hence it increases as this spectrum shifts to lower energies. In a similar fashion, the shift of the steep part of the spectrum produces the fast decrease in hard-X-rays. In this picture, the observed X-rays peak delay is naturally explained with the synchrotron self-absorption assumed above for the first seconds spectra.
| (b), (c) | ||||||
| (sec) | (keV) | |||||
| 0–1 | 523 | (b) | 0.95 | |||
| 1–2 | -0.39 | 1.15 | 6.31 | (b) | 1.42 | |
| 2–3 | -0.92 | 1.22 | 271.9 | (c) | 0.63 | |
| 3–4 | -1.18 | 1.37 | 50.1 | (c) | 0.68 | |
| 4–8 | -1.64 | 1.09 | 8.5 | (c) | 2.1 | |
| 8–17 | -2.44 | 0.7 | (c) | 0.7 |
-
(a)
Fit with simple power law
-
(b)
Fit with self–absorbed syncrothron model
-
(c)
Fit with Band form
This result challenges some realizations of fireball mo-dels that typically foresee self-absorption at much lower energies (Mészáros et al. 1994), although it should be noted that those models assume a time averaged situation.
5 Conclusions
The gamma ray bursts localization capabilities of BeppoSAX described and demonstrated in this paper have been fully exploited by implementing procedures for accurate real-time position determination of GRBM + WFC simultaneously detected events. This has made possible the discoveries of X-ray afterglows (e.g. Costa et al. 1997b) and possible counterparts at optical and radio wave lengths, providing also new and unprecedented X-ray data. These and future observations are needed to understand the general properties of the X to gamma–ray spectral evolution in gamma–ray bursts. Nevertheless the results presented here, that may represent the most extreme example of a common property of these events (Laros et al. 1982, Yoshida et al. 1989), demonstrate the importance of wide-band spectral measurements of GRBs and demand more detailed theoretical efforts on spectral evolution to account for the three order of magnitude variation of and its extremely small value in the first phase of the event.
-
Acknowledgements.
We thank the Beppo-SAX team for the efforts on the mission, the BACODINE team for the distribution of burst coordinates, G. Fishman and M. McCollough of the BATSE team for the light curves of the event, D. Frail for discussion on the radio quasar, M. Tavani and M. Vietri for helpful discussions on some of the theoretical implications of this observation and G.C. Perola for his critical reading of a previous version of this paper.
References
- 1 Atteia, J.-L. et al.,1987, Astrophys. J. Suppl. Ser. 64, 305.
- 2 Band, et al., 1993, Astrophys. J. 413, 281
- 3 Boella, G. et al.,1997, Astron. Astrophys. Suppl. Ser.122, 299
- 4 Boer, M. et al.,1994, in Gamma Ray Bursts, eds. G.J. Fishman - J.J. Brainerd - K. Hurley, (New York, AIP Conf. Proceedings), 307, 458
- 5 Crider, et al.,1997, Astrophys. J. 497, L39
- 6 Collai, G. et al.,1972, Astron. Astrophys. Suppl. Ser.7, 1
- 7 Costa, E. et al.,1997a, Adv. Space Res.,submitted.
- 8 Costa, E. et al.,1997b, Nature , 387, 783.
- 9 Fenimore, E.E. et al., 1995,Astrophys. J. 448, L101.
- 10 Ford, L. A. et al.,1995,Astrophys. J. 439, 307.
- 11 Frontera, F. et al.,1997,in preparation.
- 12 Klebesadel, R.W. et al.,1973, Astrophys. J. 182, L85.
- 13 Klose, S., 1994, Astrophys. J. 423, L23.
- 14 Jager, R. et al.,1997, Astron. Astrophys. Suppl. Ser., ,in press
- 15 Laros, J.G. et al.,1982, Astrophys. J. 286, 681
- 16 Liang, E. and Kargatis C., 1996, Nature , 381, 49
- 17 Maccacaro, T. et al., 1980, Astrophys. J. 329, 680
- 18 Mészáros, P. et al. , 1994, Astrophys. J. 432, 181
- 19 Paczynski, B., 1991, Acta Astron. 41, 257
- 20 Piro, L. et al. ,1995, in X-Ray and EUV/FUV Spectroscopy and Polarimetry, ed. S. Fineschi, SPIE, 2517, 169
- 21 Piro, L. et al.,1996, IAU circ. 6480
- 22 Rees, M.J. and Mészáros P., 1992, Mon. Not. R. Astr. Soc., 258, 41
- 23 Reid, A. et al.,1995, Astron. Astrophys. Suppl. Ser.110, 213
- 24 Ribicki, G.B.and Lightman A.P.,1979, Radiative Processes in Astrophysics,Wiley, New York
- 25 Sari, R. et al., 1996, preprint
- 26 Singal, A.K.,1993 , Mon. Not. R. Astr. Soc.262 , L27
- 27 Tavani, M, 1996, Astrophys. J. 466, 768
- 28 Walsh, D. et al.,Mon. Not. R. Astr. Soc.211, 105
- 29 Yoshida, A. et al.,1989, Publs. Astron. Soc. Japan 41, 509