The Spectra of Star Forming Galaxies at High Redshift
Abstract
We review the spectral properties of the population of star forming galaxies at discovered using a colour selection technique which targets the Lyman discontinuity at 912 Å. The UV luminosity of the typical galaxy exceeds by more than one order of magnitude that of the most luminous starbursts in the nearby universe, although the maximum star formation intensity (SFR per unit area) is within the limits found in local surveys. We consider in detail the likely magnitude of dust extinction and conclude that published estimates of the volume-averaged star formation rate at high need to be revised to higher values by a factor of about 3. This correction improves the agreement between the observations and recent theoretical predictions. Ly emission is generally weak, most likely as a result of resonant scattering. The large equivalent widths of the strongest interstellar lines and their systematic blueshift (by up to several hundred km s-1) relative to the Ly emission line are indicative of highly energetic outflows in the interstellar medium. Pilot observations have detected the redshifted H and [O III] emission lines in the band. The widths of these features imply dynamical masses of for the innermost star forming regions; the total masses involved are likely to exceed .
Introduction
The technique of Lyman limit imaging has proved to be highly successful in identifying star forming galaxies at high redshifts sph95 . At the time of writing (June 1997) our survey covers some 800 square arcminutes of sky in a dozen fields, with approximately 600 candidates brighter than of which 230 are spectroscopically confirmed galaxies at . The most significant results of this programme have been described by Mauro Giavalisco at this conference; here I review what we have learnt in the past year on the physical properties of galaxies at these early epochs from consideration of their spectra. In the spirit of the meeting, I shall emphasize the similarities (and differences) between the spectra of high redshift galaxies and those of local starbursts; such a comparison draws extensively on the detailed studies of local starbursts with the Hubble Space Telescope being carried out by Tim Heckman, Claus Leitherer, Gerhardt Meurer and their collaborators and described elsewhere in this volume.
I shall focus in particular on: (a) the UV luminosities and implied star formation rates; (b) evidence for the presence of dust and the corresponding UV extinction; (c) Ly emission and large-scale velocity fields; and (d) the prospects for detecting the familiar emission lines from H II regions and the key role they play in clarifying and extending much of the information provided by the ultraviolet spectra. Although the bulk of the spectra are of only modest signal-to-noise ratio, they are nevertheless adequate for addressing items (a), (b) and (c). For point (d) on the other hand, and for detailed studies of the stellar and interstellar lines which are not discussed here for lack of space, we rely on the most luminous objects in the sample to which we have paid special attention and devoted long exposure times. The best case is the galaxy 1512-cB58 yee96 . This spectrum (reproduced in Figure 1) is of comparable, or better, quality than HST spectra of local starburst galaxies and is a veritable mine of information for detailed studies of the physical conditions in high redshift galaxies. It now seems highly likely that this object, which is magnitudes brighter than the typical galaxy in our sample, is not extraordinarily luminous but gravitationally lensed wl97 ; seitz97 and therefore presumably provides us with an unusually clear view of a ‘normal’ galaxy at high redshift.
Ultraviolet Luminosities
The typical high- galaxy in our survey, with , () = 0.5, and , has a far-UV luminosity erg s-1 Å-1 at 1500 Å (unless otherwise stated, we adopt a km s-1 Mpc-1, , cosmology throughout this article). It is instructive to compare this value with those measured in nearby starbursts. The UV luminosities we find at are times greater than that of the brightest star cluster in the irregular galaxy NGC 4214 studied with HST by Leitherer et al. 1996 leitherer96 , and exceed by a factor of that of the most luminous local example, the Wolf-Rayet galaxy NGC 1741 which contains O type stars conti96 .
The ultraviolet spectra, in which we see the integrated continuum of O and early B stars, can in principle be used to estimate the star formation rate in a more direct way than the Balmer lines, which are produced by the reprocessed ionizing radiation of the stars at the very tip of the IMF. Adopting a continuous star formation model with an age greater than years and a Salpeter IMF from 0.1 to 100 bc96 ; lrh95 , the typical erg s-1 Å-1 corresponds to a star formation rate SFR yr-1. This is probably a lower limit, since dust extinction (see below) and a lower age would both raise this value (for an age of years the implied SFR is greater by a factor of ).
It is interesting to note that even the brightest objects in our sample fall well within the surface brightness distribution of local starbursts. The highest values of which we have found are times higher than the median. Adopting a typical extinction correction of a factor of at 1500 Å (see below) and a typical half-light radius kpc mauro96 , we arrive at a star formation intensity (SFR per unit area) yr-1 kpc-2 . This value compares well with the upper envelope of the ultraviolet sample considered by Meurer et al. 1997 meurer97 . Thus, the star forming galaxies which we are finding at high redshift appear to be spatially more extended versions of the local starburst phenomenon. The same physical processes which limit the maximum star formation intensity in nearby starbursts, as discussed by Meurer et al., also seem to be at play in young galaxies at high redshift which may well be undergoing their first episodes of star formation.
Dust Extinction
Dust is a ubiquitous component of the interstellar medium; given that galaxies at are obviously already enriched in heavy elements, it is likely that some dust is mixed with the gas and stars we observe. Unfortunately, even relatively small amounts of dust can have a significant effect in the rest-frame ultraviolet and thereby alter our view of high- galaxies. In particular, dust will: (a) extinguish resonantly scattered emission lines, most notably Ly; (b) attenuate the UV continuum leading to underestimates of the star formation rate; and (c) redden the broad spectral energy distribution so that it resembles that of an older stellar population. To some extent we have to learn to live with these problems because of the inherent uncertainties of any dust corrections which arise mostly from the unknown shape of the extinction law.
The intrinsic slope of the integrated UV continuum of a star forming galaxy is a robust quantity which, as explained for example by Calzetti 1997a daniela97a , varies little with the exact shape of the IMF or the age of the starburst. Spectral synthesis models show that the continuum between 1800 and 1200 Å is well approximated by a power law of the form (where is the flux per frequency unit) with between and 0. Similarly, the empirical template starburst spectrum constructed by Calzetti 1997b daniela97b has . In contrast, the galaxies we observe generally have UV spectral slopes between 0 and ; the spectrum of cB58 reproduced in Figure 1, for example, can be clearly seen to be redder than flat spectrum and has . Such (relatively) red spectra can result from an aging starburst or from an IMF lacking in massive stars, but we regard both possibilities as unlikely because with sufficiently high S/N we see directly the spectral signatures of O stars. The most straightforward interpretation, in analogy with local starbursts, is that the spectra are reddened by dust extinction.
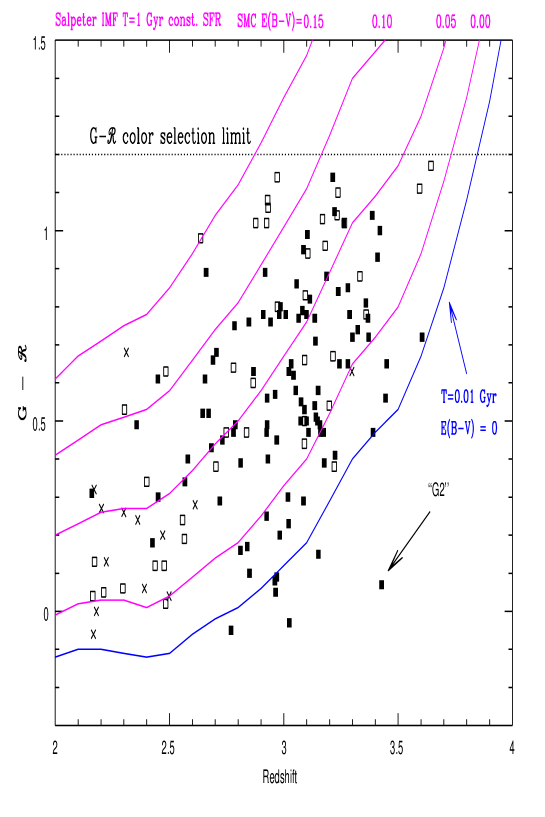
In Figure 2, reproduced from med97 , we use the () colours of the entire sample of spectroscopically confirmed galaxies to estimate dust corrections to the star formation rates at high redshift. Assuming an intrinsic spectral slope , as is the case for a Bruzual & Charlot 1996 bc96 model with 1 Gyr old continuous star formation and Salpeter IMF, the curves labelled with different values of at the top of the figure show the predicted () colour as a function of redshift, if the spectra of high- galaxies are reddened with an extinction law similar to that which applies to stars in the Small Magellanic Cloud. The curves all rise to redder () colour with redshift due to the increasing line blanketing by the Ly forest madau95 .
The difference between the observed and predicted () colour yields the extinction at 1500 Å, , appropriate to each galaxy; by adding together the individual values for all the galaxies in the sample Dickinson et al. 1997 med97 deduce a net correction by a factor of 1.8 to the comoving volume-averaged star formation rate (in yr-1 Mpc-3) at . Adopting the greyer extinction law deduced by Calzetti et al. from the integrated spectra of nearby starbursts cks94 ; daniela97a , increases the net correction to a factor of 3.5 . Also shown in Figure 2 is the zero-reddening curve for a younger stellar population (10 Myr) which has a bluer intrinsic UV slope bc96 . If the models are correct, some of the galaxies we have found are evidently younger than years, since they lie between the two zero-reddening curves in Figure 2.111There are a few points with () colours bluer than the years curve in Figure 2. Ly emission line contamination may play a role for some, particularly for the most deviant object labelled “G2” which is an AGN with strong line emission. Differences by mag can easily be explained by photometric errors and the stochastic nature of the Ly forest blanketing. Adopting the year old model as the unreddened template leads to corrections to the global star formation rate by factors of 3.5 and 6.3, for the SMC and Calzetti et al. extinction laws respectively.
We conclude that the likely dust correction to the integrated ultraviolet luminosity of Lyman break galaxies at amounts to a factor of . The correction could be as low as and as high as , depending on the age of the stellar population and on the wavelength dependence of the ultraviolet extinction. Our estimate is times lower than that deduced by Meurer et al. 1997 meurer97 . The difference results from a combination of several factors, the most significant of which is that the value mag (a factor of 15 in flux) proposed by Meurer et al. refers to the most extreme case considered above, an age of years and the Calzetti et al. attenuation curve. Given their number density, roughly comparable to that of present day galaxies, we consider it very unlikely that all Lyman break galaxies are as young as years. The lower values of UV extinction derived here are supported by the measured H flux in the few cases where this line has been detected in Lyman break galaxies (see below).

Figure 3 shows the effect of a factor of 3 correction for dust extinction on the comoving volume-averaged star formation rate deduced by Madau 1997 madau97 from the density of and drop-outs in the Hubble Deep Field. Given that the uncorrected value of at any epoch deviates by only a factor of from the average over the Hubble time, the inclusion of dust clearly has a significant impact on the interpretation of the cosmic star formation history. The plot in Figure 3 is generally taken to indicate a peak in star formation between and . This conclusion probably still holds once dust is taken into account, although the corrections appropriate to the lower redshift galaxies in the CFRS have yet to be determined cfrs95 . Since the values of from the CFRS survey are based on galaxy luminosities in the near-UV (2800 Å), the same amount of dust as deduced for the Lyman break galaxies would result in an upward correction of the filled circles in Figure 3 by a factor of . On the other hand, the typical mag found by Tresse et al. 1996 tresse96 from the Balmer decrement of CFRS galaxies at would imply a correction by a factor of to the UV continuum at 2800 Å daniela97a . It is interesting to note that the revisions we propose to Madau’s plot bring the observed values of in good agreement with recent theoretical predictions based on cold dark matter models of galaxy formation (see Figure 16 of Baugh et al. 1997 baugh97 ) and on the chemical evolution of the Milky Way ps97 .
Ly Emission
The Ly emission line is detected in about 75% of the galaxies in our sample but is always weaker than expected on the basis of the UV continuum luminosities, in agreement with the generally null results of previous searches for high redshift galaxies based on this spectral feature (e.g. tdt95 ). There are strong indications that the main reason for the weakness of Ly emission is resonant scattering in an outflowing interstellar medium. When detected, the emission line is generally redshifted by up to several hundred km s-1 relative to the interstellar absorption lines and, in the best observed cases, its profile is clearly asymmetric.
The bright galaxy 0000-D6, reproduced in Figure 4, is a good example. The zero point of the velocity scale in Figure 4 is at , the redshift of the strong interstellar absorption lines in 0000-D6. The peak of Ly emission is at a relative velocity of 800 km s-1, and while the red wing extends to km s-1, the blue wing is sharply absorbed. This P Cygni-type profile can be understood as originating in an expanding envelope around the H II region; the unabsorbed Ly photons we see are those back-scattered from the receding part of the nebula. In agreement with this picture, we find that the systemic velocity of the star-forming region is km s-1, as measured from the wavelengths of weak photospheric lines from O stars (S V and O IV ), which can be discerned in this high S/N spectrum, and of [O III] which we have detected in the -band (see below). Taken together, the relative velocities of interstellar, stellar and nebular lines point to large scale outflows in the interstellar medium, presumably as a consequence of the starburst activity which in this galaxy, one of the brightest in our sample, approaches yr-1. Similar, although generally less energetic, outflows are seen in local starburst galaxies observed with HST and HUT kunth96 ; rosa97 .
Large scale motions of the type we have found in 0000-D6 could be the main reason for the strengths of the interstellar absorption lines in high- galaxies which, with typical equivalent widths of 2-3 Å, are often greater than their counterparts in nearby starbursts. (Since these lines are saturated, their equivalent widths are much more sensitive to the velocity dispersion of the gas than to the metallicity of the gas). On the other hand, such strong absorption lines are also often seen in damped Ly systems, which are not generally associated with sites of active star formation and where they may reflect the complex velocity fields of merging protogalactic clumps hsr97 .
In any case, the systemic redshift of Ly emission relative to interstellar absorption along the same sight-line brings into question the validity of interpreting such differences along adjacent sight-lines as evidence for large rotating disks, as recently proposed by Djorgovski et al. 1996, and Lu, Sargent, & Barlow 1997 djorgovski96 ; lu97 .
Infrared Prospects
The rest-frame optical spectrum of star forming galaxies is strikingly different from the ultraviolet (e.g. conti96 ). At the nebular emission lines which dominate the optical spectrum are redshifted into the infrared and bands; there is a strong incentive to detect and measure these lines as they hold important clues to the nature of high- galaxies. In particular: (a) the line widths, which presumably reflect the overall kinematics of the star forming regions in a galaxy, can provide an indication of the masses involved; (b) a detection of H (or H at ) would give a measure of the star formation rate which can be compared with that deduced from the UV continuum; and (c) the ratios of the familiar nebular lines are probably the most promising way of estimating the metallicity of these galaxies, given the complexity of the ultraviolet absorption line spectra.
Somewhat paradoxically (given that the discovery of galaxies awaited the availability of large telescopes) the detection of the strongest rest-frame optical emission lines in the -band is actually within reach of 4-m telescopes equipped with moderately high dispersion near-infrared spectrographs. What is required is prior knowledge of the galaxy redshift and sufficient spectral resolution to ensure that the lines of interest fall in a gap between the much stronger OH- emission features which dominate the infrared sky. Pilot observations which we carried out with the CGS4 spectrograph on UKIRT in September 1996 were successful in detecting H and/or [O III] emission lines in both galaxies targeted, 0000-D6 and 0201-C6 pettini97a ; a third measurement—in cB58—has been obtained by Gillian Wright (private communication). Figure 5 shows a portion of the -band spectrum of 0201-C6. H and the weaker member [O III] doublet are both detected at the level, whereas the stronger [O III] line is lost in the nearby sky emission.
As can be seen from Figure 5, both H and [O III] emission lines are resolved; after correcting for the instrumental resolution, we measure km s-1 . A similar velocity dispersion is also found in the other two cases, 0000-D6 and cB58. (Incidentally, the fact that cB58 shows the same velocity dispersion as the other two galaxies, even though it is times brighter, is another indication of its gravitationally lensed nature). If we combine km s-1 with the half-light radii of kpc deduced for both 0201-C6 and 0000-D6 from HST WFPC2 images, we obtain virial masses of . This is comparable to the mass of the Milky Way bulge dwek95 and to the dynamical mass within the central kpc of an elliptical galaxy. However, the total masses involved are likely to be substantially greater, given that the present IR observations sample only the innermost cores of the galaxies, where the star formation rates are presumably highest. Indeed the clustering properties of Lyman break galaxies strongly suggest that they are associated with dark matter halos of mass steidel97 .
The H flux of 0201-C6 (Figure 5), erg s-1 cm-2, corresponds to a luminosity erg s-1. Adopting an H/H ratio of 2.75 and Kennicutt’s kennicutt83 calibration SFR (yr-1) (erg s-1)/ which is appropriate for a Salpeter IMF from 0.1 to 100 , we deduce a star formation rate SFR yr-1. For comparison SFR yr-1, depending on whether the age of the starburst is or years respectively. Estimates of the star formation rate from H emission and the UV continuum do not normally agree to better than a factor of in local starbursts (e.g. meurer95 ); the agreement in 0201-C6 is further improved when account is taken of the small amount of reddening () implied by the slope of the UV continuum () using the prescription by Calzetti daniela97a . We reach similar conclusions in 0000-D6 and cB58; in all three cases values of ultraviolet extinction as high as proposed by Meurer et al. ( mag meurer97 ) predict higher H fluxes than observed.
Finally, it is interesting to note that, with erg s-1 and km s-1, 0201-C6 falls on the extrapolation to higher luminosities of the correlation found for local H II galaxies by Melnick, Terlevich, & Moles 1988 mtm88 .
These preliminary results demonstrate clearly the great potential of infrared observations for complementing the information provided by the rest-frame ultraviolet and ultimately leading to a better understanding of the nature of high- galaxies. With large telescopes the detection of nebular emission lines in the near-IR will soon become routine and it will be possible to address the points touched upon here in greater depth, using a large set of measurements. Galaxies at redshifts such that [O II] , [O III] and H all fall within gaps between sky emission are the highest priority for future observations, because they offer the means to determine the abundance of oxygen. Bringing together emission and absorption pettini97b measurements at high redshift will allow a more comprehensive description of the chemical enrichment history of the universe than is possible at present.
References
- (1) Steidel, C.C., Pettini, M., & Hamilton, D. 1995, AJ, 110, 2519
- (2) Yee, H.K.C., Ellingson, E., Bechtold, J., Carlberg, R.G., & Cuillandre, J.C. 1996, AJ, 111, 1883
- (3) Williams, L.L.R., & Lewis, G.F. 1997, MNRAS, 281, L35
- (4) Seitz, S., Saglia, R.P., Bender, R., Hopp, U., Belloni, P., & Ziegler, B. 1997, MNRAS, (astro-ph/9706023)
- (5) Leitherer, C., Vacca, W. D., Conti, P. S., Filippenko, A. V., Robert, C., & Sargent, W. L. W. 1996, ApJ, 465, 717
- (6) Conti, P. S., Leitherer, C., & Vacca, W. D. 1996, ApJ, 461, L87
- (7) Bruzual, G. & Charlot, S. 1996, private communication
- (8) Leitherer, C., Robert, C., & Heckman, T.M. 1995, ApJS, 99, 173
- (9) Giavalisco, M., Steidel, C.C., & Macchetto, F.D. 1996, ApJ, 470, 189
- (10) Meurer, G.R., Heckman, T.M., Lehnert, M.D., Leitherer, C., & Lowenthal, J. 1997, AJ, in press (astro-ph/9704077)
- (11) Calzetti, D. 1997a, this volume
- (12) Calzetti, D. 1997b, AJ, 113, 162
- (13) Dickinson, M., et al. 1997, in preparation
- (14) Madau, P. 1995, ApJ, 441, 18
- (15) Calzetti, D., Kinney, A.L., & Storchi-Bergmann, T. 1994, ApJ, 429, 582
- (16) Madau, P. 1997, in The Hubble Deep Field, eds. M. Livio, S.M. Fall, & P. Madau (Cambridge: Cambridge University Press), in press
- (17) Lilly, S.J, Tresse, L., Hammer, F., Crampton, D., & Le Fèvre, O. 1995, ApJ, 455, 108
- (18) Tresse, L., Rola, C., Hammer, F., Stasinska, G., Le Fèvre, O., Lilly, S.J., & Crampton, D. 1996, MNRAS, 281, 847
- (19) Baugh, C.M., Cole, S., Frenk, C.S., & Lacey C.G. 1997, ApJ, in press (astro-ph/9703111)
- (20) Prantzos, N., & Silk, J. 1997, ApJ, submitted
- (21) Thompson, D., Djorgovski, S., & Trauger, J. 1995, AJ, 110, 963
- (22) Spinrad, H. 1997, this volume
- (23) Kunth, D., Lequeux, J., Mas-Hesse, J.M., Terlevich, E., & Terlevich, R. 1997, in Starburst Activity in Galaxies, Rev. Mex. Astron. Astrofis. Conf. Series, in press (astro-ph/9612043)
- (24) González Delgado, R., Leitherer, C., Heckman, T.M., Lowenthal, J.D., Ferguson, H.C., & Robert, C. 1997, ApJ, submitted
- (25) Haehnelt, M.G., Steinmetz, M., & Rauch, M. 1997, ApJ, submitted (astro-ph/9706201)
- (26) Djorgovski, S.G., Pahre, M.A., Bechtold, J., & Elston, R. 1996, Nature, 382, 234
- (27) Lu, L., Sargent, W.L.W., & Barlow, T.A. 1997, ApJ, 484, 131
- (28) Pettini, M., et al. 1997, in preparation
- (29) Dwek, E., et al. 1995, ApJ, 445, 716
- (30) Steidel, C.C., Adelberger, K.L., Dickinson, M., Giavalisco, M., Pettini, M., & Kellogg, M. 1997, ApJ, submitted
- (31) Kennicutt, R.C. 1983, ApJ, 272, 54
- (32) Meurer, G.R., Heckman, T.M., Leitherer, C., Kinney, A., Robert, C., & Garnett, D.R. 1995, AJ, 110, 2665.
- (33) Melnick, J., Terlevich, R., & Moles, M. 1988, MNRAS, 235, 297
- (34) Pettini, M., Smith, L.J., King, D.L., & Hunstead, R.W. 1997, ApJ, 486, in press