The Radio Spectral Index of the Crab Nebula
Abstract
We present the results of a new, comprehensive investigation of the radio spectral index of the Crab Nebula supernova remnant. New data at 74 MHz are combined with data at 327 MHz, 1.5 GHz and 5 GHz. In contrast to previous claims, little spatial variation in the spectral index is seen. In particular, between 327 MHz and 5 GHz we see no evidence of spectral steepening near the edge of the nebula, the “jet” or the ionized filaments. The rms limits on any spectral index variations in these regions amount to no more than 0.01. We believe that earlier reports of large steepening were the result of correlator bias and image registration problems. An elongated feature was detected 1′ northwest of the pulsar which may be a continuation of the well-known wisp-like structures seen closer to the center of the nebula. At 74 MHz, we see for the first time evidence of free-free absorption by the thermal material in the Crab Nebula’s filaments. Apart from some possible renewed acceleration occurring in the wisps, the dominant accelerator of relativistic electrons in the Crab Nebula is the pulsar itself.
keywords:
ISM: Individual (Crab Nebula) — Radio Continuum: ISM — supernova remnants1 Introduction
The Crab Nebula supernova remnant (SNR) is one of the strongest radio sources in the sky and has long been an object of intense scrutiny by radio astronomers. Nevertheless, a number of controversies with important physical implications continue to surround the details of its radio continuum spectrum. While there is general agreement that the Crab’s integrated spectrum has a slope 111We define the radio spectral index, , so that being the flux density at frequency from 10 MHz to the synchrotron break frequency near 104 GHz (Strom & Greidanus 1992, Kovalenko, Pynzar’ & Udal’tsov 1994), there is considerable dispute over the details of its spatial distribution (Wilson 1972, Swinbank 1980, Velusamy, Roshi & Venugopal 1992, Bietenholz & Kronberg 1992, hereafter BK92). Since the spectral index serves as a useful measure of the energy distribution of the relativistic electrons which generate the synchrotron emission, claims of spatial variations in spectral index across the nebula therefore must be interpreted in terms of differences in the underlying physical processes which influence the energy of the particles.
The following are the three main areas where small variations in the radio spectral index, , have been reported: In the first instance, BK92 report spectral index variations in the vicinity of the pulsar, similar to the wisps found in the optical (Scargle 1969, Hester et al. 1995). Although they can be seen as weak arcsecond-width features in the total intensity images, these structures are most prominent in the spectral index images. They have a flatter spectral index than the nebula, suggesting that they are regions of renewed particle acceleration. These spectral index ridges are located in the same region but are not positionally coincident with the optical wisps. They have the same concave arc-like appearance as the optical wisps but are somewhat longer. These ridges were interpreted as manifestations of the wind shock in the Crab by BK92, and Kronberg et al. (1993) modeled them as such with a tilted ring or torus geometry.
Secondly, Velusamy et al. (1992) have claimed that the spectrum of the filaments in the body of the nebula is different than that of the intra-filament plasma, and that there is a trend of steepening filament spectral index as a function of radius in the nebula. BK92, however, reported no such variations. If true, these spectral variations must be reconciled with interpretations of the physical nature of the filaments and the source of their radio emission (Reynolds 1988). This would imply a different, or at least an additional acceleration process for the relativistic electrons in the filaments.
Thirdly, several groups have reported a steepening of the spectral index near the edge of the nebula. (Velusamy & Sarma 1977, Agafonov 1987) These measurements, however, are difficult to make, and other groups report no steepening of towards the edges of the nebula (Wilson 1972, Swinbank 1980, Trushkin 1986, BK92). If such a steepening is real, then it could be interpreted as evidence for a shell of emission around the Crab, analogous to the steeper spectrum shell-type emission typically observed from classical shell-type SNRs (e.g. Cas-A). The question of whether or not such a shell exists superposed on the plerion is extremely important, since if it does, this would successfully bring to an end the search for the classical radio shell exterior to the presently observed Crab SNR. The lack of such a shell has led previous workers to important conclusions regarding the energy of the supernova explosion, the efficiency of its blast wave in accelerating relativistic particles, and the nature of the circumstellar environment surrounding the SN precursor star (Nomoto 1985; Nomoto 1987; Frail et al. 1995, F95 hereafter). If the existence of a shell were confirmed, all conclusions drawn from those negative searches would be in error.
In order to tackle these controversies, we bring together in this paper a comprehensive body of observational material, and present here important new sub-arcminute resolution 74 MHz observations. This radio database, encompassing an almost two decade range in frequency, allows us to conduct the most sensitive study of the magnitude and spatial distribution of the Crab’s radio spectral index conducted to date. We then use this unique body of evidence to address the observational controversies outlined above, and to address the physical implications of these findings.
2 Observations and Data Reduction
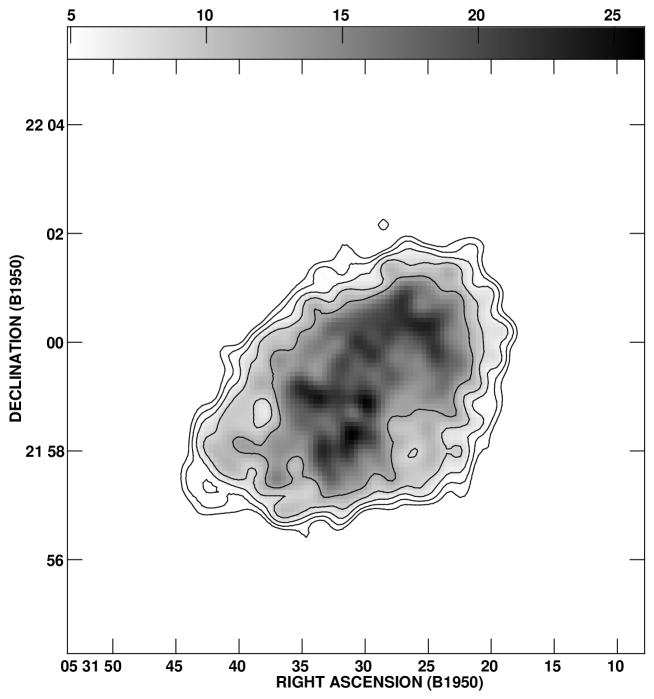
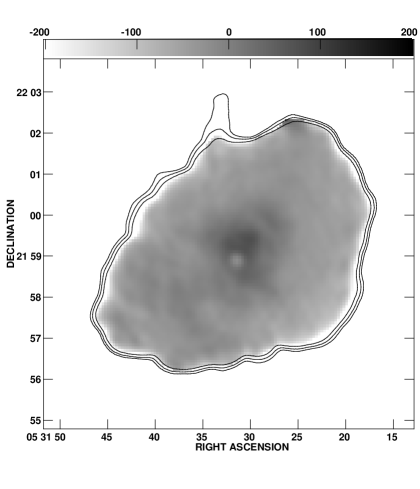
We used several sets of radio observations as described in Table 1. All data were taken at the NRAO VLA222The NRAO Very Large Array is a facility of the National Science Foundation operated under cooperative agreement by Associated Universities, Inc.. These include 74 MHz observations which currently utilize only eight VLA antennas. The 74 MHz data comprised snapshot observations from three A, two B, and one C array configuration spanning several years in order to obtain sufficient u-v coverage. The non-standard procedures employed to reduce these data are described in Kassim et al. 1993. The image obtained at 74 MHz is shown in Fig. 1.
Several problems which have not been addressed fully in the past complicate the determination of the spectral index from interferometer data, and especially from the VLA.
Firstly, the images at different frequencies need to be registered accurately. Most radio images have had the antenna phases improved by self-calibration (see, for example Pearson & Readhead, 1984; or Perley, 1989) Once this has been done, the absolute position information is degraded. To make a spectral index map, however, the two maps must be registered accurately, and so, a way of recovering the absolute position is needed. Typically this problem can be ignored, for if the starting model is reasonable the shift in position is small, and registering maps by the nominal positions is sufficient. Nonetheless, shifts of up to 1/4 of a beamwidth can occur. In the case of a completely resolved source, a shift of only 1/10 of a beam can change the map amplitude at a particular pixel position by up to 25%, which can cause substantial spurious spectral index variations, especially near bright gradients such as those near the edges of SNRs.
Images of the Crab are complicated, and registering them to less than 1/10 beamwidths is difficult in the presence of noise. One means of accomplishing this is by using the MIRIAD program IMDIFF (Dickel et al. 1988) which uses the maximum entropy method of Tan and Gull (1985) to find the translation required to make the first image resemble the second one as closely as possible in a least squares sense (see Bietenholz et al., 1991, for an application of this method to radio images of the Crab). The other approach is to self-calibrate the data in phase using a model of known positional offset, which will serve to bring the positions to the reference frame defined by the model (i.e. using the image at one frequency to phase calibrate the data at another frequency).
A much less tractable problem, peculiar to the VLA, is the correlator non-linearity (Kulkarni & Heiles 1980). The correction needed to compensate for this is known as the quantization or van Vleck correction, and it is not done at the VLA. To our knowledge, none of the previous VLA results have addressed this problem. The output of the digital correlator employed at the VLA is a known function of the true analog correlation factor. For small correlated flux densities, this function is very nearly linear, and this linear approximation is what is used at the VLA (D’Addario 1989). However, for objects as strong as the Crab, the relation between the digital correlation and the true analog correlation is no longer linear, and the derived correlated flux densities will be in error. This error increases with the observed flux density. It affects the real and imaginary part of the correlation coefficient independently, and since the uncalibrated phase, i.e. that of the correlated flux density, is random, it will cause random phase and amplitude errors. The observed amplitudes, however, will always be lower than the true ones, so the resulting maps will be biased. For our data, at 5 GHz, these errors can be as high as 4% in amplitude.
Unfortunately, the full information needed to correct for this effect is not as yet preserved at the VLA, so it is difficult to accurately recover the true correlation after the fact. This is less likely to affect our images at 74 MHz because the correlator non-linearity is less severe at this frequency, and our signal-to-noise ratio is considerably lower. For the data at other bands, we investigated the effects of this problem by making two sets of spectral index maps: First, the “standard” version which is made in the straightforward way, with the maps being registered by IMDIFF. Secondly we made “careful” spectral index maps, in which we deconvolved using only data at u-v distances K, where the correlated flux density is low enough that the error in neglecting the correlator bias is minor. The registration was achieved by also self-calibrating in phase using a common model. We describe the production of these images in more detail below.
Whether any significant bias is introduced into the maps by the correlator non-linearity is difficult to estimate. The process of deconvolution routinely recovers the flux density in the center of the u-v plane starting from an estimate of zero, so one might think that it should have no problem recovering a few percent of missing flux density. On the other hand the deconvolution process is completely free to adjust the flux density in the center of the u-v plane, whereas in regions where there are measurements, deconvolution will attempt to fit the biased measurements. We found that the apparent noise levels in the maps deconvolved by our “careful” process was lower than the “standard” ones. This suggests that there is discernible noise introduced by the missing correction, since one doesn’t expect the rms to decrease when one reduces the amount of data. This would suggest that the bias might also be significant.
We will now describe more fully the production of the “careful” spectral index images: Because the measurements near the center of the u-v plane contain the most correlated flux, they are most severely affected by the correlator non-linearity. We made maps without using the data compromised in this way. We chose to use a u-v distance cutoff rather than a flux density cutoff because its effect on the images is easier to understand. The resulting spectral index images will contain little information on angular scales larger than , i.e. half the size of the nebula. At 5 GHz, which is the worst case, the correlated flux density at this u-v distance is Jy and the remaining correlator non-linearity errors will be %.
Since the Crab Nebula is considerably larger than the largest scale of which we are sampling, we will recover the large scale structure by deconvolving with a default (support) in our maximum entropy deconvolutions (AIPS task VTESS; see Cornwell & Evans 1985, Cornwell 1988). We will use the same default (appropriately scaled) for all our observing frequencies, which is justified because the spectral index is quite uniform over the nebula (Wilson 1972, BK92). We will concentrate on mapping the difference to the Nebula’s average spectral index rather than its absolute spectral index, which can be more reliably determined using other methods: Kovalenko et al. (1994) have recently determined it to be . Using the same default map will bias our maps to look similar, and thus any spatial variation in spectral index will be required by the data (this is the “forced” VTESS technique of Anderson & Rudnick 1993).
The default map was produced as follows: At each frequency (except at 74 MHz) we mapped the data without any u-v restrictions. The resulting restored maps (i.e. convolved with an appropriate “clean” beam and with the residuals added) were corrected for the primary beam pattern, and for the expansion of the Crab (0.13% per year, Bietenholz et al. 1991). They were then convolved to a common resolution of , and flux-scaled to a common frequency using the Baars et al. (1977) spectral index of . The recent Kovalenko et al. (1994) value of is consistent with the older Baars et al. value to within the uncertainty, so using the latter should not affect our results. These maps were then averaged, and the result was used as the default map in all the subsequent deconvolution processes. For each deconvolution, it was again scaled back to the flux density and epoch appropriate for that frequency.
Furthermore, in order to assure accurately registered maps, this same (scaled and expanded) default image was used to self-calibrate, in phase only, the u-v data prior to deconvolution. This process has the side effect of further biasing the maps to be as similar as is allowed by the data. In other words it will minimize any spatial variations in the resulting spectral index map. However, our dynamic range is high, and we will show that this bias is negligible, and that our “careful” spectral index maps can be used with confidence.
Once self-calibrated in this way, the u-v data were transformed into the image plane, using only data at u-v distances greater than 1.6 K, and then deconvolved using the AIPS task VTESS and the appropriately scaled default map.
The resulting restored maps, were convolved to a common beamsize, contracted to a epoch 1987.4 and then spectral index maps were made in the usual way. The uncertainties were derived from empty regions of the maps near the nebula (especially at 5 GHz, the noise in a map corrected for primary beam pattern increases with distance from the phase center). These noise estimates were consistent with the differences between 4625 and 4885 MHz maps. At 74 MHz the pulsar is quite strong, and we first subtracted it from the fully calibrated u-v data. Furthermore, the 74 MHz observations have much lower signal to noise and fewer antennas, and the correlator non-linearity is less severe, so we did not make a “careful” spectral index map involving this frequency.
3 Results
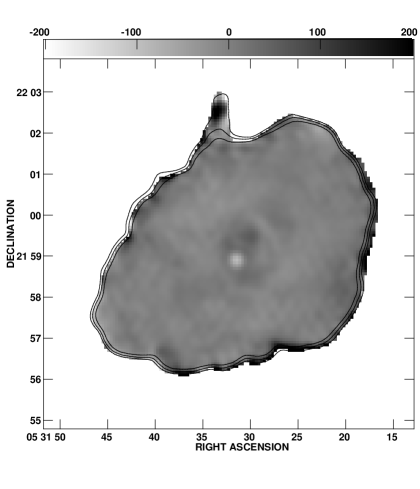
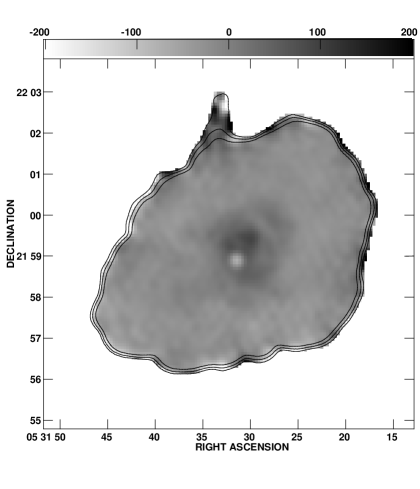
The relative spectral index between 327 MHz and 1.5 GHz () is shown in Fig. 2 while Fig. 3 shows the relative spectral index between 327 MHz and 4.9 GHz (); both at a resolution of . These are spectral indexes relative to the mean spectral index of the nebula (): we are not sensitive to the total flux densities, so our integrated spectral indexes are not constrained by our data. Our reduction process will make them very close to the value of which we assumed for the default maps. In addition, Fig. 4 shows two profiles through the spectral index map. The profiles go through the pulsar position at position angles ° and +45°.
We have included both the “careful” and the “standard” maps in order to assess the significance of the bias (see §2) and the degree of success we have had in treating it. Both maps reveal that the spectral index of the nebula is quite uniform. The rms over the whole nebula of , for example, is only 0.01 in when one excludes the region near the edge of the nebula where the signal-to-noise is low. The differences between the “careful” and the “standard” maps are negligible in the case of : the rms of the difference in is 0.008. There is no evidence of spectral steepening of any significant magnitude near the edges of the nebula. An “apparent” steepening is visible at some locations, near the nebular boundaries. However, these occur at brightness levels less than 1% of the peak brightness of the Crab Nebula (at 327 MHz), where the uncertainty in is large.
The pulsar is the strongest feature in these spectral index maps. It appears as a point source of steeper spectral index visible in the and maps. It shows up as a steepening of only 0.07 on the map. This translates into a pulsar flux density of 1.9 Jy at 327 MHz, which is consistent with the value of 1.3 Jy, given by Lorimer et al. (1995), since pulsar fluxes are known to be quite variable. Since the spectral index at the pulsar did not change noticeably between the “careful” and “standard” maps, any bias introduced by our “careful” procedure is small. All the maps also show a slight flattening in a region of about to in size surrounding the pulsar, and extending slightly farther to the NW. The magnitude of this effect ranges from about on the “standard” map to on the “careful” and the maps. It is notably larger on the “standard” map than on the “careful” one. Since the angular scales involved are those which could be biased by the correlator non-linearity, which is worst at 5 GHz, we suspect that the estimate of is more reliable. This effect is gradual, and remaining systematic sources of error are probably at about this level. We note that the correlator non-linearity would tend to reduce the observed flux density especially at higher frequencies and at large angular scales, which could cause a slight spurious spectral index steepening to appear towards the edges of the nebula in VLA images.
We emphasize that our conclusions above are largely independent of whether we examine the “careful” or the “standard” spectral index maps; this suggests that the bias introduced by the correlator non-linearity is in fact small. Our relatively uniform spectral index images suggest that the visibilities at two frequencies should differ only by a scale factor. We examined the gridded visibility data, and they show the expected linear relationship between 327 and 1.5 GHz at u-v-distances K. The formal scatter is about , which is compatible with the small spectral index differences found (since the above process accounted for neither residual calibration errors nor the primary beam pattern, we expect the scatter about a linear relationship to be somewhat larger than 1 even in the case of a completely uniform spectral index).
The “wisps” which were visible in the higher resolution spectral index map of BK82 are barely discernible at this resolution. This is simply because our beam area is about 70 times that of BK82. Another feature is consistently visible on all the and maps: it is a lane of steeper spectral index about to the NW of the pulsar. This feature has an about 0.03 steeper than the surrounding region.
The spectral index of the Crab Nebula’s “jet” is insignificantly steeper than that of the body of the nebula. Formally, of the jet is relative to the rest of the nebula. We conclude that the jet seems to have the same spectral index as the rest of the nebula. This is consistent with the star trail model of Cox, Gull & Greene (1991), which explains the jet as the star trail of the Crab’s progenitor. The star trail has cooled into a hollow tube, and the lower pressure inside the tube causes the relativistic plasma from the nebula to expand more rapidly there.
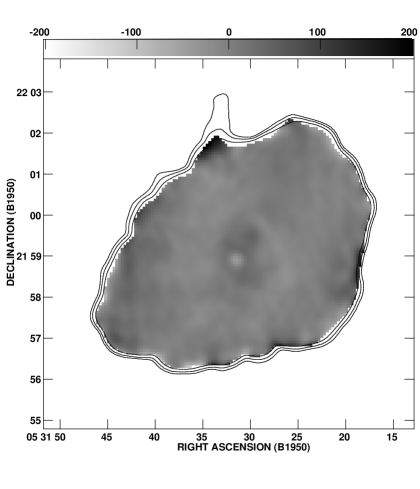
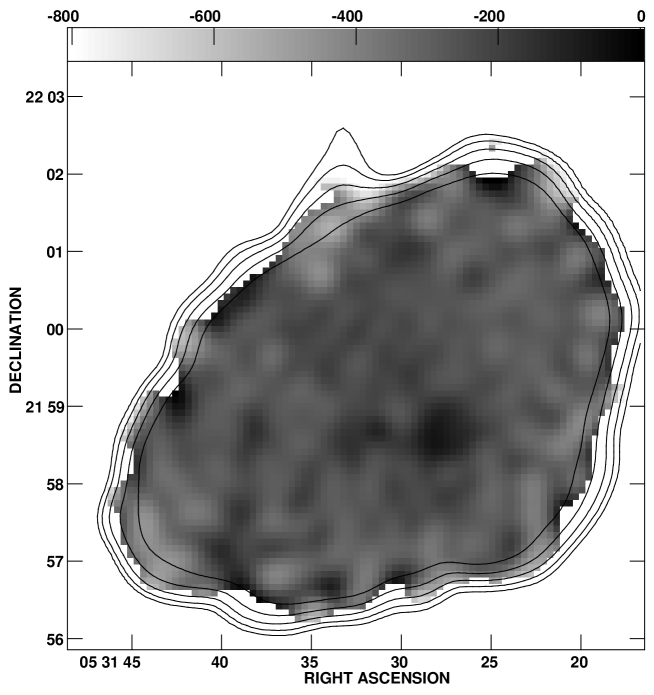
Fig. 5 shows the map of the spectral index between 74 MHz and 1.5 GHz (), this time at the slightly coarser resolution of . Because of the lower signal-to-noise of the 74 MHz map and because the correlator non-linearity is small at this lowest frequency, we expect the errors caused by not correcting for it will be less than the noise. The pulsar is, of course, not visible in the 74 MHz map, nor the map because it has already been removed from the 74 MHz data. However, some significant structure is visible in this map. The most distinct feature on this map is at RA = , DEC = and has spectral index flatter than the rest of the nebula. It is most likely a low frequency absorption feature because no corresponding feature is visible at frequencies above 327 MHz. Its reality was tested by deconvolving the 74 MHz data using an appropriately scaled, translated and convolved version of the 1.5 GHz map as a default — once again biasing the maps to be as similar as is allowed by the data, and it did not diminish in strength. Furthermore, since the 74 MHz data is derived from a number of observing runs, and the feature in question is not confined to only one of them, it is almost certainly neither an instrumental or a deconvolution effect.
4 Discussion
We see no steepening of the spectral index near the edge of the nebula, confirming the result of BK92. We find no support for the hypothesis proposed by Velusamy & Sarma (1977) that the emission near the edge of the nebula comes from a supernova shell which is superimposed on the plerionic emission from the rest of the nebula. On our very sensitive spectral index maps between 74 MHz and 5 GHz we find that the mean spectral index near the edge of the nebula333The region ’near the edge’ was defined as the region between the 2% and 20% contours of the 5 GHz total intensity map, on which the peak flux density was 5.2 Jy beam-1. The quoted uncertainties are the rms of per beamwidth over those regions. is flatter than that in the interior of the nebula. The spectral index between 74 MHz and 1.5 GHz () shows no steepening to the edge of the nebula either, so the spectrum near the edge maintains its power-law form at least down to 74 MHz. The uniformity of the spectral index throughout the nebula suggests that all the synchrotron-emitting electrons have the same origin, implying that they are all accelerated by the pulsar.
Velusamy et al. (1992) claim that the spectral index of the filaments () as opposed to that of the smooth continuum emission, steepens gradually towards the edge of the nebula, with increasing smoothly by 0.3 from the center to the edge of the nebula. Such a steepening would be apparent in our data even though we do not separate the filament emission from the continuum: Velusamy et al. (1992) find that the filaments account for 20% of the total flux density at 327 MHz, and since their filling factor is we estimate that their contribution to the surface brightness at filament locations should be . This would cause the of the combined emission from the continuum and filaments to change by at least 0.1 which is considerably larger than any spectral index change we observe.
A very slight and gradual steepening of the spectrum is observed as one moves away from the pulsar. The magnitude of this effect is about 0.02 in . While the reality of this feature was questioned in §3, we may expect some steepening to occur, since the radio-emitting electrons are moving outward and losing energy by synchrotron radiation. However, unlike in much longer-lived extragalactic sources, where synchrotron aging can dominate (Carilli et al. 1991), the magnitude of this effect may be too small to account for this slight observed steepening of 0.02 in : If we assume an (average) nebular field of 5 G and that the electrons radiate all their power at Gauss MHz we can estimate the change in spectral index of only over the lifetime of the nebula.
The visible Crab Nebula is an expanding bubble of thermal filaments and relativistic gas. It must, at some level, interact with the exterior medium into which it expands. This interaction would probably take the form of a shell. If it is expanding into the ISM, this shell would presumably be similar to other, shell-like supernova remnants. At 327 MHz, F95 detected no extended shell emission exterior to the nebula, and thus no evidence for a fast hydrogen envelope around the Crab. If there is no fast envelope around the visible nebula, however, then the interface between the nebula and the exterior medium is at the observed edge of the nebula. This interface presumably involves a shock which could accelerate particles. The emission from this interaction would thus be superposed on the visible nebula. Shock acceleration typically produces radio spectra steeper () than that of the pulsar-accelerated interior of the nebula, so if there were a significant quantity of shock-accelerated electrons near the outer boundary, a steepening of the radio spectral index would be expected. We find no such steepening or any “rim” around the outer edges of the nebula.
Taking the limit of the change in near the edge to be , we find that the maximum residual surface brightness with near edge of the nebula is Jy beam-1 at 327 MHz. This would represent Jy if spread evenly over the nebula, which would entail a fraction of less than 2% of the total radio luminosity of the Crab (integrated from to Hz); and even less if the emission displayed a shell morphology. This would correspond to a minimum relativistic particle energy in the putative shell of less than few ergs (using standard assumptions from Pacholczyk 1970). While shell-type supernova remnants typically convert between 1% and 10% of the blast energy into shock-accelerated synchrotron-emitting particles (Duric et al. 1995), the Crab’s blast wave is expected to have converted a far smaller fraction of its energy into particles for two reasons: Firstly, the Crab is not yet in the Sedov phase of its evolution, and calculations show the efficiency of particle acceleration is very low in the free-expansion phase (Drury Markiewicz & Völk 1989, Markiewicz, Drury & Völk 1990). In any case, since the shell is observed to be accelerating (Bietenholz et al. 1991) it cannot have converted a great deal of its original energy into relativistic particles. Secondly, the Crab supernova may well have been an anomalously low-energy event (Nomoto 1985, Nomoto 1987, Pols 1994, F95). In the case that the visible Crab is expanding into a halo of pre-SN wind or ejecta, as hypothesized by Hester et al. (1996), we would also expect of the energy of the expanding bubble to have been converted in accelerated particles since the relative velocity of the synchrotron bubble is lower relative to the exterior medium. Again, we would then not expect to see synchrotron emission from the shock-accelerated electrons at the edge of the synchrotron bubble.
The lane of steeper spectral index mentioned in §2 is about to the NW of the pulsar. This corresponds in position to the moving feature found in the radio by BK92, and to the moving ‘dark lane’ visible in the optical (Oort & Walraven 1956, Scargle 1969). This feature is moving outward, and in the radio, it seems to have a sharp outward edge (BK92). Since our 327 MHz data was taken several years after the data at 1.5 and 5 GHz, we would expect such a moving feature to generate spurious steeper spectral index feature. We can roughly estimate the feature’s proper motion to be about asec yr-1, representing a speed of kms-1. This is marginally consistent with the optical proper motion of asec yr-1 (Scargle 1969). Possibly, the feature is slowing down, since BK92 find a marginally slower speed (0.6 asec yr-1) in 1985. This is consistent with the feature being embedded in the large-scale flow in the nebula. Higher resolution observations would be needed to accurately determine the speed of the feature.
5 Low-Frequency Absorption
As discussed above, the significant feature SW of the pulsar on the spectral index map has an index 0.3 flatter than the rest of the nebula, and suggests there is low-frequency absorption towards this location. This feature has not been seen in prior spectral index maps, and it is the availability of a sub-arcminute resolution image at 74 MHz that has enabled its detection. Comparison with the three-dimensional [OIII] data of Lawrence et al. (1995) indicates that it corresponds to the location of the brightest optical knot with negative radial velocity. This places the knot on the near side of the nebula and thus supports our hypothesis that the flat spectral index feature is due to free-free absorption by thermal electrons in the line emitting filaments.
The rms variations of the spectral index relative to the mean are when excluding the aforementioned feature, indicating that there is real structure in the spectral index. A plot of the intensity of the [OIII] emission from the front of the nebula, i.e. that with negative radial velocity, against the spectral index (Fig. 6) shows that there is a weak correlation between the two, in the sense that the is flatter, i.e. the low-frequency absorption is higher at the locations where there is more [OIII] emission. This is what would be expected if the thermal material responsible for the [OIII] emission is causing free-free absorption at 74 MHz.
Assuming an electron temperature of K for the optically emitting thermal filaments, our measure of the free-free optical depth constrains the emission measure to be cm-6pc, the inequality arising because not all of the synchrotron emission will originate from behind the absorbing feature. Assuming a line-of-sight depth similar to the feature’s width, we calculate that the electron density in the filaments cm-3, is compatible with the values expected for the Crab’s filaments (Davidson & Fesen 1985). This is also compatible with densities derived from the depolarization of the Crab between 5 GHz and 1.5 GHz (Bietenholz & Kronberg 1991). In fact, a prominent depolarization feature can be seen at this location.
6 Summary
We have presented new, high-resolution 74 MHz observations of the Crab Nebula. Combining these with a large body of observational material at other radio frequencies up to 5 GHz, we have made sensitive radio spectral index maps of the Crab Nebula. We have carefully registered our maps at different frequencies, and we have taken steps to eliminate the effects of the correlator non-linearity, which will tend to contaminate data of bright objects taken at the VLA. In agreement with some earlier work, we find that the radio spectral index, , of the Crab is quite uniform over the nebula at frequencies above 300 MHz.
We also find that:
-
1.
There is no steepening of the spectral index near the edge of the nebula. There is thus no evidence for any steeper spectrum shell emission around the Crab. Such emission is expected to be faint since the Crab is still in the free-expansion phase.
-
2.
Any gradual steepening towards the edge of the nebula is small, being on the order of 0.02 in . This is much smaller than has been claimed in the past. Synchrotron radiation losses probably produce an effect somewhat smaller than this, although it is of about this order of magnitude, and hence they may be responsible.
-
3.
The spectral index of the filaments is no different from that of the body of the nebula for frequencies above 300 MHz, which suggests that the origin of the relativistic electrons in the filaments is the same as that in the body of the nebula.
-
4.
We confirm the existence of a moving radio feature in the NW quadrant of the nebula. It corresponds in position to the dark lane noted by Oort and Walraven (1956; see also Scargle 1969). It appears to be moving at km s-1.
-
5.
At frequencies below 300 MHz, we see evidence of the free-free absorption caused by the thermal material in the optical line emitting filaments. Estimates of the electron density in the line emitting filaments derived from the amount of free-free absorption we measure are compatible with other estimates derived from the optical spectra of the filaments.
Acknowledgements.
We would like to thank S. Lawrence for kindly supplying us with his [OIII] data. Research at York University was partly supported by NSERC. NRAO is operated under license by Associated Universities, Inc., under cooperative agreement with NSF. Basic research in radio astronomy at the Naval Research Laboratory is supported by the Office of Naval Research. Finally, we thank the referee, Dr. Richard Strom, for his useful comments.References
- (1) Agafonov, M. I., et al. 1987, Soviet Ast., 64, 60
- (2) Anderson, M. C., & Rudnick, L. 1993, ApJ, 408, 514
- (3) Baars, J. W. M., Genzel, R., Pauliny-Toth, I. I. K., & Witzel, A. 1977, A&A, 61, 99
- (4) Bietenholz, M. F., & Kronberg, P. P. 1991, ApJ, 368, 231
- (5) Bietenholz, M. F., & Kronberg, P. P. 1992, ApJ, 393, 206 (BK92)
- (6) Bietenholz, M. F., Kronberg, P. P.,Hogg, D. E., & Wilson, A. S. 1991, ApJ, 373, L59
- (7) Carilli, C. L., Perley, R. A., Dreher, J., W., & Leahy, J. P. 1991, ApJ, 338, 554
- (8) Cornwell, T. J. 1988, A&A, 202, 316
- (9) Cornwell, T. J., & Evans, K. F., 1985, A&A, 143, 77
- (10) Cox, C. I., Gull, S. F., & Greene, D. A. 1991, MNRAS, 250, 750
- (11) D’Addario, L. R. 1989, in ASP Conf. Proc. 6, Synthesis Imaging in Radio Astronomy, ed. R. A. Perley, R. R. Schwab, & A. H. Bridle (San Francisco: ASP), 59
- (12) Davidson, K., & Fesen, R. A. 1985, ARA&A, 23, 119
- (13) Dickel, J. R., Sault, R., Arendt, R. G., Matsui, Y., & Korista, K. T. 1988, ApJ, 330, 254
- (14) Drury, L. O’C., Markiewicz, W. J., & Völk, H. J. 1989, A&A, 225, 179
- (15) Duric, N., Gordon, S. M., Goss, W. M., Viallefond, F., & Lacey, C. 1995, ApJ, 445, 173
- (16) Frail, D. A., Kassim, N. E., Cornwell, T. J., & Goss, W. M. 1995 ApJ, 454, L129 (F95)
- (17) Hester, J. J. et al.. 1995, ApJ, 448, 240
- (18) Hester, J. J. et al.. 1996, ApJ, 456, 225
- (19) Kovalenko, A. V., Pynzar’, A. V., & Udal’tsov, V. A. 1994, Astr. Reports, 38, 110
- (20) Kassim, N. E., Perley, R. A., Dwarakanath, K. S., & Erickson, W. C. 1993, AJ, 106, 2218
- (21) Kronberg, P. P., Lesch, H., Ortiz, P. F., & Bietenholz, M. F. 1993, ApJ, 416, 251
- (22) Kulkarni, S. R., & Heiles, C. 1980, AJ, 85, 1413
- (23) Lawrence, S. S., MacAlpine, G. M., Uomoto, A., Woodgate, B. E., Brown, L. W., Oliversen, R. J., Lowenthal, J. D., & Liu, C. 1995, AJ, 109, 2653
- (24) Lorimer, D. R., Yates, J. A., Lyne, A. G., & Gould, D. M. 1995, MNRAS, 273 411
- (25) Markiewicz, W. J., Drury, L. O’C., & Völk, H. J. 1990, A&A, 487, 502
- (26) Nomoto, K. 1985, in The Crab Nebula and Related Supernova Remnants, eds. M. Kafatos & R. B. C. Henry (Cambridge: Cambridge University Press), 97
- (27) Nomoto, K. 1987, in The Origin and Evolution of Neutron Stars, IAU Symp. 125, ed. D. J. Helfland & J.-H. Huang (Dordrecht: Reidel), 281
- (28) Oort, J. H. & Walraven, Th. 1956, Bull. Astron. Inst. Netherlands, 12, 285.
- (29) Pacholczyk, A. G. 1970 Radio Astrophysics (San Francisco: W. H. Freeman) ‘
- (30) Perley, R. A. 1989, in ASP Conf. Proc. 6, Synthesis Imaging in Radio Astronomy, ed. R. A. Perley, R. R. Schwab, & A. H. Bridle (San Francisco: ASP), 287.
- (31) Pearson, T. J., & Readhead, A. C. S. 1984, ARA&A, 22, 97
- (32) Pols, O. R. 1994, A&A, 290, 119
- (33) Reynolds, S. P. 1988, ApJ, 327, 853
- (34) Scargle, J. D. 1969, ApJ, 156, 401
- (35) Strom, R. G., & Greidanus, H. 1992, Nature, 358, 654
- (36) Swinbank, E. 1980, MNRAS, 193, 451
- (37) Tan, S. M., & Gull, S. F. 1985, MNRAS, 216, 949
- (38) Trushkin, S. A. 1986, Soviet Astron. Lett., 12, 81
- (39) Velusamy, T., & Sarma, N. V. G. 1977, MNRAS, 181, 455
- (40) Velusamy, T., Roshi D., & Venugopal V. R. 1992 MNRAS, 255, 210
- (41) Wilson, A. S. 1972 MNRAS, 157, 229
TABLE 1
Details of the observing sessions
| Frequencies | epoch | VLA arrays used | Reference |
|---|---|---|---|
| (MHz) | |||
| 4885, 4625 | 1987 | BCD | Bietenholz & Kronberg 1991 |
| 1515, 1410 | 1987 | ABCD | Bietenholz & Kronberg 1991 |
| 327 | 1992 | BC | Frail et al. 1995 |
| 74 | 1993 | ABC | Kassim et al. 1993 |
Figures