The X–ray Cluster Dipole
Abstract
We estimate the dipole of the whole sky X–ray flux–limited sample of Abell/ACO clusters (XBACs) and compare it to the optical cluster dipole which is known to be well aligned with the CMB dipole and which converge to its final value at Mpc (Branchini & Plionis 1996 and references therein). The X–ray cluster dipole is well aligned () with the CMB dipole, while it follows closely the radial profile of its optical cluster counterpart although its amplitude is per cent lower. In view of the fact that the the XBACs sample is not affected by the volume incompleteness and the projection effects that are known to exist at some level in the optical parent Abell/ACO cluster catalogue, our present results confirm the previous optical cluster dipole analysis that there are significant contributions to the Local Group motion from large distances (Mpc). In order to assess the expected contribution to the X–ray cluster dipole from a purely X–ray selected sample we compare the dipoles of the XBACs and the Brightest Cluster Sample (Ebeling et al. 1997a) in their overlap region. The resulting dipoles are in mutual good aggreement with an indication that the XBACs sample slightly underestimates the full X–ray dipole (by 5 per cent) while the Virgo cluster contributes about 10 - 15 per cent to the overall X–ray cluster dipole. Using linear perturbation theory to relate the X–ray cluster dipole to the Local group peculiar velocity we estimate .
1 Introduction
A lively debate has been going on the recent years on which is the spatial extent of the distribution of mass inhomegeneities that cause the LG motion. Assuming gravitationally instability as the cause of cosmic motions and using as tracers of the matter distribution optical and IR galaxies, many studies (cf. Yahil, Walker & Rowan-Robinson 1986; Harmon et al. 1987; Lahav 1987; Lahav, Rowan-Robinson & Lynden-Bell 1988; Lynden-Bell, Lahav & Burstein 1989; Strauss et al. 1992; Hudson 1993) have shown that most, if not all, of the peculiar acceleration of the LG is induced within 40 - 50Mpc. Other analysis of galaxy samples have presented indications, of varying strength, for contributions from much larger depths, ranging from 100Mpc to 150Mpc (Plionis 1988; Rowan-Robinson et al. 1990; Plionis, Coles & Catelan 1993; Vasilakos & Plionis 1997). However the difficulty with such studies in providing a definite answer is that the galaxy samples are not volume limited but rather magnitude- or flux–limited which introduces an inherent uncertainty due to the rapid decrease of their selection function with distance from the observer.
Alternatively, galaxy clusters being the largest gravitationally-collapsed structures in the universe and luminous enough to be volume-limited out to large distances have also been used to probe the local acceleration field. Existing studies, all based on the optically selected Abell/ACO clusters (Abell, Corwin & Olowin 1989) provide strong evidence that the LG dipole has significant contributions from depths up to Mpc (Scaramella, Vettolani & Zamorani 1991; Plionis & Valdarnini 1991; Branchini & Plionis 1996). However, due to the the volume incompleteness of richness class R=0 clusters (cf. Peacock & West 1992) and to optical projection effects (enhancement of galaxy density along the direction of foreground rich clusters which cause inherently poor background clusters or groups to appear rich enough to be included in the sample), these results should be verified by well defined cluster samples, free of such biases.
In the X–ray band the physical reality of clusters is unquestionable due to their strong ICM X–ray emission. Two large X–ray cluster samples have been recently compiled; the XBACs sample by Ebeling et al. (1996), from carefully cross-correlating the ROSAT all-sky X–ray survey (Trmper 1990; Voges 1992) with the Abell/ACO cluster sample and the Brightest Cluster Sample (BCS) by Ebeling et al. (1997a) from an additional cross-correlation of the RASS sources with the Zwicky cluster catalogue but it also contains clusters purely selected in X-rays (for the complete definition see section 2.2). The XBACs sample provides, for the first time, a whole sky, flux–limited, sample of X-ray galaxy clusters suitable for investigating the local acceleration field (for an early attempt using mostly HEAO-1 data see Lahav et al. 1989). The BCS sample covers only the northern sky and it has been used to investigate the evolution of the X–ray cluster luminosity function (Ebeling et al. 1997b) while both samples will be useful for establishing, among other things, the cluster correlation function (Edge et al. in preparation). Nevertheless, both catalogues suffer from some degree of incompleteness at low galactic latitude (see also sections 2.3 and 3 for relative corrections). Apart from these two samples, other X–ray cluster samples, also based on ROSAT data, are under compilation, most notably the ESO KP catalogue for southern clusters (Collins et al. 1995; de Grandi 1996; Guzzo et al. 1995, 1996).
As in the case of all flux–limited samples, the use of these X–ray cluster samples to investigate the very distant contributions to the local acceleration field is limited exactly due to their flux–limited nature. In fact Kolokotronis et al. (1997) found, using numerical experiments, that such samples will underestimated the true underlying cluster dipole by 15 per cent on average if such distant contributions do exist. We further caution the reader that using clusters to estimate the local acceleration field maybe problematic because:
-
•
Clusters may not trace well the very local gravity field due to their large intercluster separation (Mpc) and unless the local velocity field is cold, which does seem to be the case (cf. Peebles 1988), attempts to relate the cluster dipole with the LG peculiar velocity could give erroneous results.
-
•
Existing cluster samples are incomplete in many different ways. For example the Virgo cluster is missing from the optical Abell/ACO catalogue and thus also from the XBACs sample. Furthermore, the present X–ray cluster samples may suffer from incompleteness in the nearby Universe due to problems in reliably detecting extended low-surface brightness emission.
These limitations will be investigated by comparing, in their overlap region, the XBACs and BCS dipoles, since the latter sample is nearer to being purely X–ray selected and it also contains the Virgo cluster.
The outline of this paper is as follows. The X–ray samples and various selection biases are discussed in section 2. The main dipole results are presented in section 3, while in section 4 we estimate the cosmological parameter. Finally, our main conclusions are presented in section 5.
2 X–ray samples & selection effects
Both X–ray samples consist of clusters identified in the ROSAT all sky survey (RASS) by a combination of two detection algorithms (the Standard Analysis Software System and Voronoi Tesselation Percolation; SASS and VTP hereafter) for fluxes above a particular flux limit (). The use of the VTP identification algorithm allows quite reliable cluster detections even at low redshifts and improves greatly the flux determination for the X–ray sources, initially misassessed by SASS (see Ebeling et al. 1996; 1997a and references therein for superiority of VTP over SASS technique).
Throughout this work we will be using the following definition of distance (Mattig’s formula):
with and km sMpc-1.
2.1 XBACs sample
The XBACs sample consists of the X–ray brightest Abell/ACO clusters that have been detected in the ROSAT all sky survey (RASS) for fluxes above erg scm-2 (0.1 - 2.4 keV) with redshifts limited by . The sample contains 253 clusters out of which 242 have and thus it is the largest X–ray flux–limited cluster sample to date (though not entirely X–ray selected). The X–ray fluxes measured initially by the SASS point source detection algorithm are superseded by VTP measurements that account for the extended nature of the emission. In addition, the difficulty of the SASS algorithm to actually detect nearby X–ray emission has been mostly corrected by running VTP on the RASS fields centered on the optical positions of all nearby Abell/ACO clusters (0.05) irrespective of whether or not they are detected by SASS. Ebeling et al. (1996) estimate, after a careful analysis of possible selection effects and biases that the overall completion rate of this X–ray sample is more than 80 per cent.
2.1.1 XBACs systematic effects
Due to the cross-correlation of the RASS with the Abell/ACO cluster positions, it is very probable that the systematic biases from which the latter suffer, could also creep in the XBACs sample. Ebeling et al. (1996) have shown that the XBACs flux–limited sample is free of the known volume incompleteness, as a function of distance, of the richness class R=0 Abell/ACO clusters, exactly because of the flux–limited property of the XBACs sample which is such, that it contains at large distances the inherently brighter and thus richer Abell/ACO clusters for which there is no volume incompleteness.
Another bias from which the optical clusters suffers and which could therefore affect also the XBACs sample, is the significant distance dependent density variations between the northern Abell and southern ACO parts of the combined cluster sample (cf. Batuski et al. 1989; Scaramella et al. 1990; Plionis & Valdarnini 1991). These density variations are most probably due to the higher sensitivity of the ACO IIIa-J emulsion plates which results in detections of inherently poorer nearby ACO clusters. As a first step to quantify the overall magnitude of the effect on the XBACs sample we estimate, for , the density ratio and its Poisson error between the Abell and ACO parts of the sample within the volume limited region of the optical cluster sample;
where each cluster has been weighted by , to account for the number density decrease due to Galactic absorption 111The amplitude of this function has been estimated from each individual cluster sample and it is consistent with the usually quoted values ( and ).. It is evident that the X–ray selection has corrected the significant systematic density variation seen in the optical sample. The lower X–ray detection rate of ACO clusters is probably because they are inherently poorer clusters (and thus weak X–ray emitters), revealed due to the higher sensitivity of the IIIa-J emulsion ACO plates.
As already mentioned, the apparent density variations between the Abell and ACO samples are distance dependent (Plionis & Valdarnini 1991) and since uncorrected systematic density differences between two parts of the sky can introduce spurious contributions to the dipole, we will statistically correct such variations by weighting each Abell cluster with:
| (1) |
The robusteness of our results will be checked by using a large number of bin sizes (). Note that due to small number statistics the density variations may be non-significant and thus we will be using whenever .
2.2 BCS sample
The BCS is the biggest X–ray selected, X–ray flux–limited compilation covering the extragalactic sky in the northern hemisphere (, ). It contains 199 clusters above erg s-1 cm-2, in the same energy band as the XBACs, with and with X–ray luminosities . The BCS list includes not only Abell clusters but also the brightest Zwicky clusters and others selected on the basis of their X–ray properties alone. It therefore has a significant overlap with XBACs (for ) as far as the Abell population is concerned. The above BCS sample is estimated to be 90 per cent complete (redshift completion is more than 96 per cent).
2.3 X–ray cluster selection functions
Necessary in estimating the local acceleration field from flux–limited samples is the use of the sample selection function which is determined in our case by the cluster X–ray luminosity function, . Ebeling et al. (1997c; 1997b) have recently fitted to the data a Schechter luminosity function (with parameters given in Table 1):
| (2) |
where is the characteristic luminosity measured in , being the overall normalization of the number–density measured in Mpc, and is the usual power–law index.
The selection function, defined as the fraction of the cluster number density that is observed above the flux limit at some distance , is:
| (3) |
with and erg s-1 (due to the form of the above integral is very insensitive to larger values of ). The mean number density of the underlying X–ray population of clusters is found by integrating the luminosity function from the lower to the upper luminosity limit of the sample:
| (4) |
Since , the absolute lower luminosity limit, for the XBACs sample is effectively unknown we can estimate it by relating the above equation with the observed number density of the optical Abell/ACO sample which can be considered as the ‘parent’ population of the XBACs sample. Using the weighted mean number density of Abell/ACO clusters, corrected for Galactic absorption () we obtain erg s-1; the uncertainty reflecting the density variations between the Abell and ACO samples. For the case of the BCS sample, for which , we obtain that the global mean number density of its parent X–ray cluster population is Mpc-3, a factor of 3 times larger than that of the XBACs sample.
The predicted number of X–ray clusters above and lying within a shell between and , is then:
| (5) |
Note that is independent of and thus of the uncertainty in . Fig. 1 shows the observed number of XBACs clusters as a function of distance and the predicted one from equation (5). The maximum of turns out to be around Mpc, in agreement with the observed distribution. If we choose to fit better only the region of reliable redshifts () we would obtain for the luminosity function parameters: and erg s-1 (dashed line in fig. 1), which although deviate from the nominal values of Table 1, they are within their 1 uncertainty. The insert of fig. 1 shows the corresponding of the optical Abell/ACO cluster, corrected for Galactic absorption (stars) and the theoretical curve for the range of Abell and ACO densities.
Fig. 2 presents the observed BCS distribution, for , and the corresponding theoretical one (equation 5). The maximum of the selection function turns out to be at Mpc, followed by a long tail towards larger depths. This early maximum ensures that the BCS function is dominated by relatively local clusters, more so than the corresponding XBACs sample.
Note that we will limit our dipole analysis within 240Mpc to avoid possible systematic effects due to the low number of the observed X–ray clusters and due to uncertainties in the based cluster redshifts that dominate above this depth.
3 Cluster Dipole
We will not present all the details of the method used to calculate the peculiar gravitational acceleration induced by some mass tracer on the observer since such can be found in many recent articles (cf. Tini-Brunozzi et al. 1995; Kolokotronis et al. 1996 and references therein). Briefly, we employ the method of moments to quantify the distribution of clusters around the LG and we correct them for the effects of galactic absorption using a spherical harmonic expansion of the cluster surface number density and a combined mask to take into account the depletion of clusters for and a cosec absortion law above this latitude limit (see Plionis & Valdarnini 1991 and the appendix of Tini-Brunozzi et al. 1995 for details). We then estimate the gravitational acceleration induced on the LG from the distribution of X–ray clusters (cf. Miyaji & Boldt 1990; Plionis et al. 1993) by:
| (6) |
where is the dipole, is the monopole, are the cluster weights with an estimate of the cluster mass, the cluster selection function and the Abell/ACO relative weight (see equation 1). is the dipole convergence depth, the depth beyond which the distant density inhomogeneities do not affect the dynamics of the observer and should therefore be within the effective depth of the catalogue in order to obtain the correct estimate of the local acceleration field. Using the definition of the monopole () and linear perturbation theory (cf. Peebles 1980) we can recover from equation (6) the more familiar form:
| (7) |
where and is the X–ray cluster to underlying mass bias factor. Note that we will be using two mass weighting schemes; one in which we will assume each cluster to contribute equally () and one in which the mass is proportional to the X–ray luminosity (). This relation results from the assumption of hydrostatic equilibrium, , and from GINGA observations which indicate that (cf. Arnaud 1994 and references therein).
The sparseness, however, with which the flux–limited sample of clusters trace their underlying parent cluster population introduces shot-noise (discreteness effects) in their dipole estimates which increase with distance. Kolokotronis et al. (1997) found that the enhancement of the underlying true cluster X–ray dipole due to shot-noise and the loss of dipole signal due to the flux–limited nature of the sample work in opposite directions, tending to counteract each other. Therefore, although we estimate the magnitude of the 1D shot-noise dipole, using the formalism developed in Strauss et al. (1992), i.e. , finding it to be about per cent of the dipole signal, we do not attempt to correct the raw XBACs dipole for such effects (see also Hudson 1993 and Kolokotronis et al. 1997 for alternative shot-noise definitions).
3.1 Dipole Results
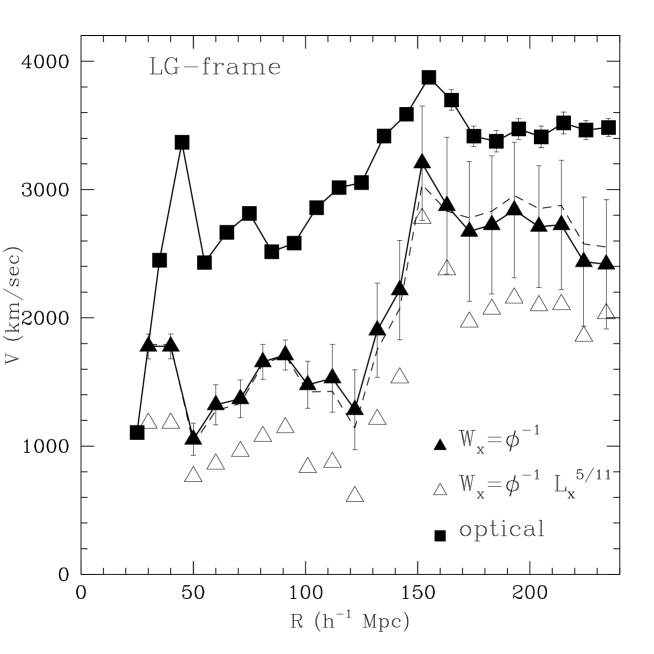
In fig. 3 we present the cluster dipole (based on both mass weighting schemes) for the XBACs sample (triangles) as well as for the optical Abell/ACO sample (squares). It is evident that both samples excibit a very similar dipole profile with significant contributions from depths Mpc, which validates the previous results based only on the optical sample (Plionis & Valdarnini 1991; Scaramella, Vettolanni & Zamorani 1991; Branchini & Plionis 1996). However, the XBACs dipole is systematically lower, by per cent (for the equal mass weighting case), than the optical cluster dipole. Although this could be intrinsic, implying that the optical dipole is artificially enhanced by projection effects (cf. Sutherland 1988; Peacock & West 1992), such an explanation is not corroborated by the correlation function analysis of the XBACs sample which provides a large correlation length, roughly consistent with that of the optical Abell/ACO sample (Edge, private communication). An alternative explanation of the lower XBACs dipole amplitude with respect to the optical one, is a possibly artificial exclusion from the XBACs catalogue of nearby clusters (Mpc) which naturally play a key role in shaping the local acceleration field. In fact, from the 8 Abell/ACO clusters within 60Mpc not included in the XBACs sample, three (A3565, A3574 and A347), although detected in RASS, have been excluded because of suspision that their X–ray emission is mostly of non-cluster origin. If we include by hand these three clusters, then the XBACs () dipole increases substantially, reducing the difference with the optical dipole from 20 to 10 per cent. This reduced discrepancy could be further gapped if we take into account the results of Kolokotronis et al. (1997) who found, using numerical experiments, that the cluster X–ray flux–limited and unity weighted () dipole will underestimate by 15 per cent the underline cluster dipole if it has significant contributions from large depths (Mpc).
However, using the more natural luminosity weighting scheme () we find an even lower amplitude of the XBACs dipole with respect to the unity weighted one, although their dipole profiles are very similar. The amplitude of the luminosity weighted X–ray cluster dipole is by 35 per cent less than its optical counterpart and although the per cent gap could be bridged, as discussed above, it seems that the X–ray cluster dipole is intrinsically less, by per cent, than the optical cluster dipole. This difference, if it is indeed intrinsic, corresponds to an optical to X-ray cluster bias factor .
In order to further investigate these points we will attempt to fill in the lack of local information by using the BCS clusters, which better trace the local volume (see fig. 2) and compare the XBACs and BCS dipoles in their common region (, ). One’s hope is that at the convergence depth of the XBACs dipole the relative fluctuation between the BCS and XBACs dipoles will reflect those of the whole-sky dipole, and therefore we could infer a better estimate of the final X–ray cluster dipole amplitude.
3.2 Comparing the XBACs and BCS dipoles
The northern XBACs sample (hereafter XBACs-n) contains 113 clusters out of which 112 belong to the BCS sample as well, with A2637 being the sole exception (for details see section 10 of Ebeling et al. 1997a). Furthermore, although 65 per cent of the clusters of the two samples are common, it is not straight-forward that they should trace similarly the northern hemisphere dipole since (a) the BCS is governed by a significantly different which results in a different distribution (see figs. 1 and 2) and (b) only and per cent of the clusters are common within the interesting regions ( and Mpc resepectively).
For this comparative work we will correct the raw dipole estimates for shot-noise errors since the two samples should trace the same underlying distribution but with different densities and selection functions. We plot in the lower panel of fig. 4 the fluctuations of the unity weighted XBACs-n and BCS dipoles () including (dashed line) and excluding Virgo (solid line). We also plot (upper panel) the misalignment angle between the XBACs-n and BCS dipoles at each distance bin for the the luminosity weighted one (solid line) and for the unity-weighted dipole case (long dashed line) excluding Virgo. The short dashed line corresponds to the luminosity weighted dipoles but including in the BCS sample the Virgo cluster.
The most significant results of this analysis are:
-
•
Comparing consistently the BCS and XBACs-n dipoles, i.e. excluding Virgo from the BCS sample since by construction it is absent from the XBACs, we find that both X–ray samples have very similar dipole shapes, with small amplitude differences () and at scales . Note that the values are uncorrected for the misalignment induced by the shot noise dipole, which is roughly .
-
•
If one takes into account the above value of the relative velocity difference between the BCS and the XBACs-n one would further reduce the apparent gap between the XBACs all-sky and the optical Abell/ACO dipole but by not more than per cent.
-
•
Similarly with the XBACs also in the BCS case the luminosity weighted dipole is by per cent lower than the corresponding unity weighted one.
-
•
Including Virgo in the BCS sample we find, as expected, that it plays a significant role in shaping the X–ray dipole, with relative contribution of per cent which corresponds to an average Virgocentric infall velocity of km/sec (were we have weighted twice the luminosity based results).
4 Estimating the density parameter
The good alignment (within ) between the XBACs and CMB dipoles indicate that the XBACs clusters trace the large-scale mass density field and that they can therefore be used to estimate the cosmological parameter by relating the X–ray cluster dipole to the Local Group peculiar velocity (equation 7). However since the Virgo cluster is not included in the Abell sample, due to its proximity and thus low surface density, we must exclude from the LG peculiar motion the Virgocentric Infall. Equation (7) then becomes:
| (8) |
Using we find , pointing towards .
The cluster redshift is related to its the comoving distance by:
| (9) |
and since the last term of this equation is , redshift-space distortions will tend to enhance the dipole amplitude (Kaiser 1987). In an attempt to derive the optical cluster dipole free of such distortions, Branchini & Plionis (1996) used a density reconstruction algorithm to predict the real-space positions of the optical Abell/ACO clusters. They found that redshift space distortions ( hereafter) enhance the real-space optical cluster dipole by 23 per cent. In order to correct the XBACs dipole for such effects we attempt to minimize using a simple model of the peculiar velocity field. Since we observe in the local Universe a coherent bulk flow of high amplitude (cf. Dekel 1994, 1997; Strauss & Willick 1995), we split the cluster peculiar velocities in a component of a bulk flow and a local non-linear component as follows:
| (10) |
Applying equation (10) to the Local Group and using equation (8) we have that from which it is evident that locally the bulk flow component dominates over that of the infall. This fact may be reversed for galaxies at large distances but in any case at such distances we have and thus r.s.d should not significantly affect the dipole. We therefore use the approximation , where the bulk flow profile, as a function of distance, is given by Dekel (1994, 1997) and by Branchini, Plionis & Sciama (1996), and its direction is taken to be that of . Note, however, that there have been measurments of the bulk velocity with very different results from the above in direction as well as in amplitude (Lauer & Postman 1994). The reality, however, of these results have been questioned by different studies (cf. Giovanelli et al 1996; Hudson & Ebeling 1996).
Our results are completely compatible with those of the full reconstruction of Branchini & Plionis (1996); the redshift-space XBACs dipole is enhanced by 20 per cent with respect to the corrected (real-space) dipole. The main dipole results and the corresponding values of (using equation 7) are presented in Table 2. Taking into account a possibile 20 per cent artificial decrease of the X-ray dipole (see discussion in 3.1) and averaging over the different determinations (weighting twice the more physical luminosity weighted results) we obtain
Note that from the optical Abell/ACO cluster dipole Branchini & Plionis (1996) found . Furthermore, Branchini et al. (1997) comparing the real-space optical cluster density field (within Mpc) with the corresponding POTENT-Mark III field found . The difference between their value and the present analysis could be attributed to an optical to X–ray cluster bias factor .
5 Conclusions
We have estimated the X–ray cluster dipole, using the whole-sky XBACs sample and the BCS sample which covers the northern hemisphere. We have found that:
-
(a)
The relative contributions to the LG acceleration field, from different depths, is readily provided by the XBACs dipole analysis and supports the conclusions drawn from the optical Abell/ACO cluster analysis of significant dipole contributions ( per cent of total) from scales Mpc. Furthermore, the XBACs and BCS clusters trace equally well the same dipole structure and thus the large-scale density field.
-
(b)
Using a model of the large-scale peculiar velocity field and correcting for redshift space distortions, we find that the real-space X–ray cluster dipole is reduced by 20 per cent, a value consistent with the outcome of a full reconstruction of the optical cluster density field.
-
(c)
Although the ‘zero-point’ of the X–ray cluster dipole cannot be unambigiously determined from the present analysis we find that the true underlying X–ray cluster dipole is intrinsically lower than the corresponding optical cluster dipole by to 30 per cent, depending on whether the X–ray clusters are weighted equally or and on whether one assumes that the observed X–ray emission of a few nearby clusters (A3565, A3574 and A347) is of non-cluster origin.
-
(d)
Relating the X-ray cluster dipole with the LG peculiar velocity we find , which combined with recent determinations based on comparing the optical cluster density and velocity fields with the corresponding POTENT-Mark III fields, imply a relative optical to X–ray cluster bias factor of .
-
(e)
The Virgo cluster contributes about per cent of the overall X-ray cluster dipole which corresponds to an average Virgocentric infall velocity of km/sec.
References
- (1) Abell G.O., Corwin, H.G., Olowin, R.P., 1989, ApJS, 70, 1
- (2) Arnaud, M., 1994, in W. Seitter ed., Cosmological Aspects of X–ray Clusters of Galaxies, NATO ASI Series, Vol.441, 197
- (3) Batuski D.J., Bahcall N.A., Olowin R.P., Burns J.O., 1989, ApJ, 341, 599
- (4) Branchini E., Plionis M., 1996, ApJ, 460, 569
- (5) Branchini E., Plionis M., Sciama D.W., 1996, ApJ, 461, L17
- (6) Branchini E., Plionis M., Zehavi I., Dekel A., 1997, in preparation
- (7) Collins C.A. et al., 1995, in Maddox S.J., Aragon-Salamanca A., eds, Wide field spectroscopy and the distant universe: The 35th Herstmonceux Conference. World Scientific, Cambrigde, United Kingdom, p. 213
- (8) de Grandi S., 1996, in Zimmermann H.U., Trmper J., eds, Rntgerstrahlung from the universe: International conference on X–rayAstronomy and Astrophysics. Wrzburg, Germany, p. 577
- (9) Dekel A., 1994, ARA&A, 32, 371
- (10) Dekel A., 1997, in L.da Costa ed. ‘Galaxy Scaling Relations: Origins, Evolution & Applications’, Springer, in press
- (11) Ebeling H. et al., 1995, in Maddox S.J., Aragon-Salamanca A., eds, Wide field spectroscopy and the distant universe: The 35th Herstmonceux Conference. World Scientific, Cambrigde, United Kingdom, p. 221
- (12) Ebeling H., Voges W., Bhringer H., Edge A.C., Huchra J.P., Briel U.G., 1996, MNRAS, 281, 799
- (13) Ebeling H., Edge A.C., Fabian A.C., Allen S.W., Crawford C.S., 1997b, ApJ, 479, L101
- (14) Ebeling H., Edge A.C., Bhringer H., Allen S.W., Crawford C.S., Fabian A.C., Voges W., Huchra J.P., 1997a, MNRAS, submitted
- (15) Ebeling H. et al., 1997c, in preparation
- (16) Edge A. et al., 1997, in preparation
- (17) Giovanelli R., Haynes M.,P., Wegner G., Da Costa L., Freudling W., Salzer J.J., 1996, ApJ, 464, L99
- (18) Guzzo L. et al., 1995, in Maddox S.J., Aragon-Salamanca A., eds, Wide field spectroscopy and the distant universe: The 35th Herstmonceux Conference. World Scientific, Cambrigde, United Kingdom, p. 205
- (19) Guzzo L., 1996, in Coles P., Martinez V.J., Pons-Borderia Maria-Jesus., eds, Mapping, measuring and modeling the universe. Astronomical society of the pacific, San Fransisco, California, p. 157
- (20) Harmon R.T., Lahav O., Meurs E.J.A., 1987, MNRAS, 228, 5p
- (21) Hudson M.J., 1993, MNRAS, 265, 72
- (22) Hudson M.J. & Ebeling H., 1996, ApJ, 479, 621
- (23) Kaiser N., 1987, MNRAS, 227, 1
- (24) Kolokotronis V., Plionis M., Coles P., Borgani S., Moscardini L., 1996, MNRAS, 280, 186
- (25) Kolokotronis V., Plionis M., Coles P., Borgani S., 1997, MNRAS, submitted
- (26) Lahav O., 1987, MNRAS, 225, 213
- (27) Lahav O., Edge A.C., Fabian A.C., Putney A., 1989, MNRAS, 238, 881
- (28) Lahav O., Rowan-Robinson M., Lynden-Bell D., 1988, MNRAS, 234, 677
- (29) Lauer, T.R. & Postman, M., 1994, ApJ, 425, 418
- (30) Lynden-Bell, D., Lahav, O. & Burstein, D., 1989, MNRAS, 241, 325
- (31) Miyaji T., Boldt E., 1990, ApJ, 353, L3
- (32) Peacock J.A., West M.J., 1992, MNRAS, 259, 494
- (33) Peebles, P.J.E., 1988, ApJ, 332, 17
- (34) Peebles P.J.E., 1980. The Large Scale Structure of the Universe, Princeton University Press, Princeton New Jersey
- (35) Plionis M., 1988, MNRAS, 234, 401
- (36) Plionis M., Valdarnini R., 1991, MNRAS, 249, 46
- (37) Plionis M., Coles P., Catelan P., 1993, MNRAS, 262, 465
- (38) Romer A.K., Collins C.A., Bhringer H., Cruddace R.G., Ebeling H., MacGillivray H.T., Voges W., 1994, Nature, 372, 75
- (39) Rowan-Robinson M. et al., 1990, MNRAS, 247, 1
- (40) Scaramella R., Zamorani, G., Vettolani, G., Chincarini, G., 1990, AJ, 101, 342
- (41) Scaramella R., Vettolani G., Zamorani G., 1991, ApJ, 376, L1
- (42) Sutherland W., 1988, MNRAS, 234, 159
- (43) Strauss M., Yahil A., Davis M., Huchra J.P., Fisher K., 1992 ApJ, 397, 395
- (44) Strauss M.A., Willick J., 1995, Phys. Rep., 261, 271
- (45) Tini Brunozzi P., Borgani S., Plionis M., Moscardini L., Coles P., 1995, MNRAS, 277, 1210
- (46) Trmper J., 1990, Phys. Bl., 46 (5), 137
- (47) Vasilakos S., Plionis M., 1997, in preparation
- (48) Voges W., 1992, Proseedings of Satellite Symposium 3, ESA ISY-3, p. 9
- (49) Yahil A., Walker, D. & Rowan-Robinson, M., 1986, ApJ, 301, L1
- (50) Yahil A., Strauss M., Davis M., Huchra J.P., 1991, ApJ, 372, 380
- (51)
Tables
| Parameters | XBACs | BCS |
|---|---|---|
| frame | (km/sec) | |||||
|---|---|---|---|---|---|---|
| -space | 1 | 2710 | 269 | 0 | 17∘ | 0.19 |
| -space | 2100 | 275 | 15 | 19∘ | 0.24 | |
| real-space | 1 | 2250 | 255 | -7 | 25∘ | 0.22 |
| real-space | 1750 | 251 | 10 | 15∘ | 0.29 |