3(11.06.2; 11.16.1; 11.19.2; 11.19.6; 11.19.7)
R. de Grijs; grijs@astro.rug.nl
The z-structure of disk galaxies towards the galaxy planes††thanks: Based on observations obtained at the European Southern Observatory, La Silla, Chile
Abstract
We present a detailed study of a statistically complete sample of highly
inclined disk galaxies in the near-infrared band. Since the
-band light is relatively insensitive to contamination by galactic
dust, we have been able to follow the vertical light distributions all
the way down to the galaxy planes.
The mean levels for the sharpness
of the -band luminosity peaks indicate that the vertical luminosity
distributions are more peaked than expected for the intermediate
sech(z) distribution, but rounder than exponential. After fitting
a generalized family of fitting functions characterised by an exponent
2/n ( for exponential, for sech and for
sech2; van der Kruit 1988) we find that the mean value for 2/n
in the band equals 2/n. Since projection of not completely edge-on galaxies onto the
plane of the sky causes vertical luminosity profiles to become rounder,
we have performed simulations that show that it is possible that all our
galaxies can have intrinsically exponential vertical surface brightness
distributions.
We find that the profile shape is independent of
galaxy type, and varies little with position along the major axis. The
fact that we observe this in all our sample galaxies indicates that the
formation process of the galaxy disks perpendicular to the galaxy planes
is a process intrinsic to the disks themselves.
keywords:
galaxies: fundamental parameters — galaxies: photometry — galaxies: spiral — galaxies: statistics — galaxies: structure1 Introduction
1.1 Motivation
It is well-known from optical observations that many disk galaxies show a universal, exponential behaviour of the vertical luminosity away from the galaxy planes. This observation, and the assumption that the mass-to-light ratio in the disk is constant, leads us to believe that galaxies have a universal, exponential vertical mass density profile (e.g., Tsikoudi 1979; van der Kruit & Searle 1981a).
This nearly universal vertical structure is likely the result of secular, internal evolution (van der Kruit & Searle 1981a; Carlberg 1987). As Carlberg (1987) states, the continuous variation of stellar kinematics from the youngest to the oldest disk stars strongly suggests that an ongoing dynamical evolution is indeed present.
We know from observations of our Galaxy that galaxy disks probably consist of multiple components of increasing age, velocity dispersion and scale height; the density is the sum of all these components. An exponentially decreasing density distribution with distance from the galaxy plane therefore puts interesting constraints on the star formation rate (SFR) and the dynamical evolution of the disk. Burkert & Yoshii (1996) have shown, that these exponential vertical density profiles are a natural result of disk evolution if gaseous protodisks settle into isothermal equilibrium prior to star formation. If the star formation and cooling rates are comparable, stellar exponential z-profiles arise due to the gravitational contraction of the gas towards the galaxy plane.
1.2 Observational status
Several models have been proposed and tested to account for the vertical distributions observed close to the galaxy planes.
Van der Kruit & Searle (1981a,b, 1982a,b) studied the surface brightness distributions of edge-on disk galaxies in optical passbands, which were significantly affected by dust contamination. From these studies, they proposed the self-gravitating isothermal sheet (Spitzer 1942) as a model for the description of the vertical light distribution:
| (1) |
where is the surface luminosity in the plane of the galaxy, is the vertical scale parameter and z is the distance from the galaxy plane, respectively. At large z heights, the vertical scale heights are equal for both the isothermal model and the exponential approximation, where equals twice the exponential scale height. At intermediate z, most galaxies are dominated by the thin disk luminosity, which is thought to be locally isothermal (van der Kruit & Searle 1981a).
The relations among the values for the density in the plane, , the vertical scale parameter, , and the vertical velocity dispersion for the solar neighbourhood show that the disk of our Galaxy is self-gravitating (van der Kruit & Searle 1981a). Based on the quite similar values for found by Van der Kruit & Searle (1981a) they argued that it may be reasonable to assume that the disks of other galaxies are also self-gravitating.
Near-infrared observations of edge-on disk galaxies have shown an excess of light over the isothermal model at small distances from the galaxy planes, where the optical photometry is strongly affected by dust absorption (e.g., Wainscoat et al. 1989; Aoki et al. 1991; van Dokkum et al. 1994). Wainscoat et al. (1989) show that the z-dependence of the light in the large southern edge-on IC 2531 demonstrates a more strongly peaked profile than expected from the isothermal sheet model, which appears to be better fitted by an exponential:
| (2) |
(where is the exponential vertical scale height), although their limited resolution does not unambiguously differentiate between the models. For the vertical K-band light distribution in NGC 891, Aoki et al. (1991) find that the exponential model fits the data remarkably well up to those z-distances where the seeing convolution becomes significant.
1.3 An intermediate solution
Although the exponential model is mathematically attractive because of its simplicity, there is no firm physical basis for such a model. An exponential vertical mass density distribution can be constructed by adding up multiple stellar disk components. This can only be done if the contributions from stars with larger velocity dispersions are increasingly dominating with increasing distance from the galaxy plane. However, a mechanism to account for such a process is as yet unknown (Burkert & Yoshii 1996).
As van der Kruit (1988) argues, a pure exponential distribution also has some undesired properties, the most important one being a sharp minimum of the velocity dispersion in the plane. Fuchs & Wielen’s (1987) results show moderate gradients, much smaller than required for the exponential distribution (Bahcall 1984a,b). Therefore, van der Kruit (1988) proposed that an intermediate distribution, such as the “sech(z)” distribution, could be a more appropriate one to use:
| (3) |
to account for the deviations from an isothermal sheet in the galaxy planes.
Wainscoat et al.’s (1989) near-infrared photometry of IC 2531 would agree with this model, as would star counts for our Galaxy (e.g., Gilmore & Reid 1983).
1.4 The Galaxy
Studies of the Galaxy provide valuable information on the vertical structure of galaxy disks. These studies, based on star counts, have the advantage over the studies of external galaxies that they are less affected by dust absorption (in the solar neighbourhood) and effects of the presence of a young stellar population. Moreover, studies of the vertical luminosity structure in our Galaxy benefit greatly from the higher spatial resolution compared to that in external galaxies. Gilmore & Reid (1983) and Pritchet (1983) conclude that the stellar z-distribution in our Galaxy is better approximated by an exponential rather than an isothermal profile.
On the other hand, Hill et al. (1979) derived density laws for A and F dwarfs towards the North Galactic Pole, which cannot be fit well by an exponential distribution, although they may be approximated as such in short distance bins. Although they find that the F stars are roughly consistent with a single exponential, the A stars can only be approximated by a single exponential closer to the Galactic Plane and with a significantly smaller scale height than the F dwarfs.
Based on observations in the near-infrared, Kent et al. (1991) concluded that the vertical light distribution (and hence probably also the mass distribution) follows an exponential law more closely than an isothermal sheet approximation. However, they did not compare the observed light distribution to other, intermediate models.
1.5 Near-Infrared Observations
The study of edge-on galaxies in the near-infrared is valuable to reveal the true stellar distributions, as the near-infrared wavelengths permit to study these even at small z.
In this paper we study the vertical luminosity profiles of a statistically complete sample of edge-on disk galaxies in the band. This sample is the largest of its kind available at the moment. For that reason we are able to study the structure of edge-on galaxies in a statistically consistent way, even down to very small distances from the galaxy planes.
The -band light (which is comparable to the standard Johnson K band) is likely to be dominated by the old disk, and the young disk contribution is relatively unimportant. Moreover, the mass-to-light ratio is almost independent of metallicity and age in this band. Rix & Rieke (1993) find, from monitoring the gravity-sensitive CO(2.3 m) index in the large disk galaxy M51, that young red supergiants do not distort the K-band image significantly. They find that at most small portions of the spiral arms at K have large contributions from young stars.
The K-band wavelength is too short for a substantial amount of direct emission from the dust. The high dust temperatures required to emit in K (800 – 1000 ∘K) are associated only with young stellar objects and compact Hii regions (see, e.g., Wainscoat et al. 1989).
The light in K is dominated by giants, which constitute only a small fraction of the stellar mass. However, old population giant stars have the same spatial distribution as the main-sequence stars (Rix & Rieke 1993).
Therefore, since neither dust nor young, luminous red stars strongly affect the K-band image, K-band imaging with infrared arrays is a reliable and efficient method to map surface mass variations through surface brightness variations (Rix & Rieke 1993)
In Sect. 2 we present the sample properties and describe the data reduction method used. The results of our detailed analysis of the vertical profiles are presented in Sect. 3, in which we also compare the results obtained in the optical I band to those from the band observations. In Sect. 4 we discuss the main observational results in the context of star formation and global galaxy structure parameters. Finally, we summarize and conclude the paper in Sect. 5.
2 Approach
2.1 Sample selection, observations and data reduction
To study the structural parameters of edge-on spiral galaxies we selected a statistically complete sample taken from the Surface Photometry Catalogue of the ESO-Uppsala Galaxies (ESO-LV; Lauberts & Valentijn 1989) with the following properties:
-
•
their inclinations are greater than or equal to 87∘;
-
•
the angular blue diameters () are larger than ;
-
•
the galaxy types range from S0 to Sd, and
-
•
they should be non-interacting.
The inclinations were determined following Guthrie (1992), assuming a true axial ratio , corresponding to an intrinsic flattening of 0.11. From this intrinsic flattening the inclinations i were derived by using Hubble’s (1926) formula
| (4) |
where is the observed axis ratio.
Of the total sample of 93 southern edge-ons, an arbitrary subsample of 24 galaxies was observed in the near-infrared band in two observing runs of 4 and 3 nights, respectively. The selection of these 24 observed sample galaxies depended solely on the allocation of telescope time; the galaxies cover the southern sky rather uniformly.
By applying a completeness test (e.g., Davies 1990; de Jong & van der Kruit 1994) we derived that the ESO-LV is statistically complete for diameter-limited samples with . To check the completeness of our subsample, we calculated, based on a limiting diameter , that , which implies statistical completeness.
The near-infrared observations were obtained with the IRAC2B camera at the ESO/MPI 2.2m telescope of the European Southern Observatory (ESO) in Chile. The IRAC2B camera is equipped with a Rockwell 256256 pixel NICMOS3 HgCdTe array. For both observing runs, in July 1994 and January 1995, we used the IRAC2B camera with Objective C, corresponding to a pixel size of (40 m) and a field of view of .
At both runs we used the filter available at ESO (central wavelength m, bandpass m). We chose to observe in rather than in K band (with m, and m), since the band is almost as little affected by dust as the K band, but has a lower sky background (Wainscoat & Cowie 1992).
We took sky images and object frames alternately, both with equal integration times (in sequences of 12 10s), and spatially separated by .
Supplementary observations in the Thuan & Gunn (1976) I band were obtained during a number of observing runs at ESO. Most of the I-band observations were obtained with the Danish 1.54m telescope, equipped with a 10811040 pixel TEK CCD with a pixel size of 24m (0.36 ′′/pix). The field of view thus obtained is . The TEK CCD was used in slow read-out mode in order to decrease the pixel-to-pixel noise. The Thuan & Gunn (1976) I-band characteristics match those of a Johnson I filter (Buser 1978). For all observed galaxies we determined the colour terms required for the calibration to the Cousins system using standard stars.
Gaps in the observed sample were filled in by service observations with the Dutch 0.92m telescope, equipped with a 512512 pixel TEK CCD. It has a pixel size of 27 m (0.44 ′′/pix), corresponding to a field of view of .
Both telescopes were used in direct imaging mode, at prime focus. Details of the specific observations can be found in Table 1.
Columns: (1) Galaxy name (ESO-LV); (2) Telescope used (Dan 1.5 = Danish 1.54m; Dut 0.9 = Dutch 0.92m; ESO 2.2 = ESO/MPI 2.2m); (3) Date of observation (ddmmyy) (4) Passband observed in; (5) Exposure time in seconds; (in the band the same integration time was spent to observe sky images) (6) Seeing FWHM in arcsec
| Galaxy | Telescope | Date | Band | Exp.time | Seeing |
|---|---|---|---|---|---|
| (1) | (2) | (3) | (4) | (5) | (6) |
| 026G-06 | Dan 1.5 | 090794 | 2900 | 1.6 | |
| ESO 2.2 | 110794 | 21210 | 1.5 | ||
| 033G-22 | Dan 1.5 | 120194 | 2900 | 0.9 | |
| 041G-09 | Dan 1.5 | 100794 | 2900 | 1.4 | |
| ESO 2.2 | 090794 | 31210 | 1.5 | ||
| 074G-15 | Dan 1.5 | 110794 | 2900 | 1.3 | |
| 138G-14 | Dan 1.5 | 080794 | 2900 | 1.6 | |
| 141G-27 | Dan 1.5 | 090794 | 2900 | 1.2 | |
| ESO 2.2 | 090794 | 21210 | 1.4 | ||
| 142G-24 | Dan 1.5 | 110794 | 2900 | 1.4 | |
| ESO 2.2 | 090794 | 21210 | 1.4 | ||
| 157G-18 | Dan 1.5 | 100194 | 2900 | 1.2 | |
| ESO 2.2 | 240295 | 21210 | 1.1 | ||
| 201G-22 | Dan 1.5 | 090194 | 2900 | 1.2 | |
| ESO 2.2 | 240295 | 21210 | 1.1 | ||
| 202G-35 | Dut 0.9 | 061094 | 2900 | 1.2 | |
| 235G-53 | Dan 1.5 | 120794 | 600 | 1.5 | |
| Dut 0.9 | 170396 | 21200 | 1.3 | ||
| 240G-11 | Dut 0.9 | 051094 | 21200 | 1.6 | |
| 061094 | 21200 | 1.6 | |||
| 263G-15 | Dan 1.5 | 090194 | 900 | 1.0 | |
| 100194 | 600 | 1.1 | |||
| 120194 | 900 | 1.0 | |||
| ESO 2.2 | 240295 | 1210 | 1.4 | ||
| 250295 | 1210 | 1.4 | |||
| 263G-18 | Dut 0.9 | 190194 | 2900 | 1.2 | |
| 269G-15 | Dut 0.9 | 130396 | 21200 | 1.3 | |
| 280G-13 | Dut 0.9 | 140396 | 21200 | 1.4 | |
| 286G-18 | Dan 1.5 | 090794 | 2900 | 1.3 | |
| ESO 2.2 | 090794 | 1210 | 1.6 | ||
| 110794 | 1210 | 1.2 | |||
| 288G-25 | Dut 0.9 | 051094 | 21200 | 1.3 | |
| 311G-12 | Dan 1.5 | 120194 | 2900 | 1.0 | |
| ESO 2.2 | 240295 | 21210 | 0.9 | ||
| 315G-20 | Dan 1.5 | 090194 | 2900 | 1.7 | |
| ESO 2.2 | 240295 | 21210 | 1.1 | ||
| 321G-10 | Dut 0.9 | 280493 | 300 | 1.2 | |
| 322G-73 | Dut 0.9 | 230396 | 21200 | 1.2 | |
| 322G-87 | Dut 0.9 | 270493 | 300 | 1.3 | |
| 340G-08 | Dan 1.5 | 100794 | 2900 | 1.3 | |
| 340G-09 | Dut 0.9 | 140396 | 21200 | 1.4 | |
| ESO 2.2 | 090794 | 21210 | 1.5 | ||
| 358G-26 | Dan 1.5 | 120194 | 2900 | 1.0 | |
| 358G-29 | Dan 1.5 | 100194 | 2900 | 1.3 | |
| ESO 2.2 | 260295 | 21210 | 1.5 | ||
| 377G-07 | Dut 0.9 | 100396 | 21200 | 1.2 | |
| 383G-05 | Dan 1.5 | 080794 | 2900 | 1.3 | |
| ESO 2.2 | 090794 | 21210 | 1.1 | ||
| 416G-25 | Dan 1.5 | 130194 | 2900 | 1.0 | |
| ESO 2.2 | 260295 | 21210 | 1.4 | ||
| 435G-14 | Dut 0.9 | 201293 | 2900 | 1.0 | |
| ESO 2.2 | 240295 | 21210 | 1.5 |
| Galaxy | Telescope | Date | Band | Exp.time | Seeing |
|---|---|---|---|---|---|
| (1) | (2) | (3) | (4) | (5) | (6) |
| 435G-25 | Dut 0.9 | 230493 | 600 | 1.7 | |
| 231293 | 2900 | 1.3 | |||
| 060194 | 2900 | 1.2 | |||
| ESO 2.2 | 240295 | 21210 | 1.6 | ||
| 435G-50 | Dan 1.5 | 100194 | 2900 | 1.1 | |
| 437G-62 | Dut 0.9 | 040195 | 21200 | 1.0 | |
| ESO 2.2 | 260295 | 21210 | 1.1 | ||
| 444G-21 | Dut 0.9 | 230396 | 21200 | 1.2 | |
| 446G-18 | Dan 1.5 | 090794 | 2900 | 1.1 | |
| ESO 2.2 | 090794 | 21210 | 1.3 | ||
| 120794 | 21210 | 1.0 | |||
| 446G-44 | Dut 0.9 | 140396 | 21200 | 1.2 | |
| ESO 2.2 | 090794 | 21210 | 1.4 | ||
| 460G-31 | Dan 1.5 | 080794 | 2900 | 1.5 | |
| ESO 2.2 | 090794 | 21210 | 1.5 | ||
| 487G-02 | Dan 1.5 | 090194 | 2900 | 1.1 | |
| ESO 2.2 | 240295 | 21210 | 1.1 | ||
| 500G-24 | Dan 1.5 | 130194 | 2900 | 1.0 | |
| ESO 2.2 | 250295 | 2430 | 1.6 | ||
| 505G-03 | Dut 0.9 | 010496 | 21200 | 1.3 | |
| 506G-02 | Dut 0.9 | 280493 | 300 | 1.0 | |
| 509G-19 | Dan 1.5 | 100794 | 2900 | 1.0 | |
| ESO 2.2 | 100794 | 21210 | 1.2 | ||
| 531G-22 | Dut 0.9 | 270994 | 21200 | 1.5 | |
| 555G-36 | Dan 1.5 | 130194 | 2900 | 1.1 | |
| 564G-27 | Dut 0.9 | 211293 | 2900 | 1.4 | |
| 221293 | 2900 | 1.3 | |||
| ESO 2.2 | 240295 | 21210 | 0.9 | ||
| 575G-61 | Dut 0.9 | 230396 | 21200 | 1.2 |
During the reduction of the near-infrared observations, each sky frame was compared with the two sky frames taken nearest in time in order to detect stars in the sky frames. These stars were filtered out by using a median filter and thus the resulting cleaned sky images are very similar to the actual sky contributions.
To circumvent the effects of bad pixels and to obtain accurate flatfielding we moved the object across the array between subsequent exposures. Therefore, for most galaxies mosaicing of either 4 or 8 image frames was required to obtain complete galaxy images. The mosaicing was done by using common stars in the frames to determine the exact spatial offsets. In the rare case that no common stars could be determined, we used the telescope offsets as our mosaicing offsets. The overlapping area was used to determine the adjustment of sky levels needed by means of a least squares fit.
Bad pixels and bad areas on the array were masked out and not considered during the entire reduction process. Only after mosaicing was finished, the areas that still did not contain any valid observations were interpolated by a 2-dimensional linear plane fit (see Peletier [1993] for a detailed description of the reduction method used).
The calibration of the near-IR observations was done by using the SAAO/ESO/ISO Faint Standard Stars (Carter & Meadows 1995). We used the corrections published by Wainscoat & Cowie (1992) to transform the measurements to the K band. The accuracy of the -band zero-point offsets we could reach was mag at both observing runs. The limiting factors here were flatfielding errors.
The I-band images were reduced following standard reduction procedures (see de Grijs & van der Kruit 1996); for the calibration of these observations Landolt fields were used (Landolt 1992). The I-band calibration could be done to an accuracy of mag, depending on the telescope and observing run.
Both our I-band observations and the -band data were taken at photometric (parts of) nights.
2.2 Vertical profiles
We extracted vertical luminosity profiles at a number of positions along the major axes of the sample galaxies. A semi-logarithmic binning algorithm was applied to the galaxies both radially and vertically, in order to retain an approximately constant overall signal-to-noise (S/N) ratio in the resulting vertical profiles. Since the most significant differences between our models become clear at small z, no vertical binning was applied close to the galaxy planes.
We rejected those profiles with low S/N ratios (generally the outermost profiles) and those that were clearly affected by artifacts in the data or foreground stars. For all galaxies we have been able to sample the vertical light distribution at various positions along the major axis outside the region where the bulge contribution dominates. For galaxies of types we could determine these distributions for at least 4 of these independent positions.
The positions of the galaxy planes were determined by folding the vertical profiles and under the assumption of symmetrical light distributions with respect to the planes, in the near-infrared -band observations.
In Fig. 1 we present the I–K colour maps of the galaxies discussed in this paper.
2.3 Comparison to published luminosity profiles
Surface brightness profiles of edge-on galaxies observed with modern detectors are scarcely available in the recent literature.
In the near-infrared K band we compared our observations of the large southern edge-on galaxy ESO 435G-25 with those of Wainscoat et al. (1989), obtained using a raster scan technique with an aperture of 5′′. Although our observations of ESO 435G-25 are of a much higher quality and were taken with a much higher resolution, we find remarkably good agreement between Wainscoat et al.’s (1989) and our K-band observations, as can be seen in Fig. 2. We have extracted vertical profiles from our calibrated K-band image at exactly the same positions and in the same way as was done by Wainscoat et al. (1989). The distinct drop in the difference profiles at the position of the galaxy plane is caused by the difference in resolution between both data sets.

A large and homogeneous set of I-band observations of southern Sb–Sc galaxies has recently been published by Mathewson et al. (1992) and Mathewson & Ford (1996).
Azimuthally averaged luminosity profiles were obtained by fitting ellipses to the galaxy isophotes, whose intensity, ellipticity and position angle were allowed to vary with each ellipse. Bad pixels, cosmic rays and foreground stars were masked out, so that these would not affect the results from the ellipse-fitting routine. Although this method works sufficiently well for low and moderately-inclined galaxies, when dealing with highly-inclined or edge-on galaxies the ellipse fitting is severely influenced by the presence of a central dust lane and the non-elliptical outer galaxy isophotes. Unfortunately, since Mathewson et al. (1922) and Mathewson & Ford (1996) did not tabulate the ellipticities nor the position angles used for the individual ellipses obtained for each galaxy, we can at best compare azimuthally averaged profiles which were obtained with the same free parameters. A comparison between the azimuthally averaged I-band luminosity profiles of Mathewson et al. (1992) and Mathewson & Ford (1996) and those obtained from our observations is shown in Fig. 3.
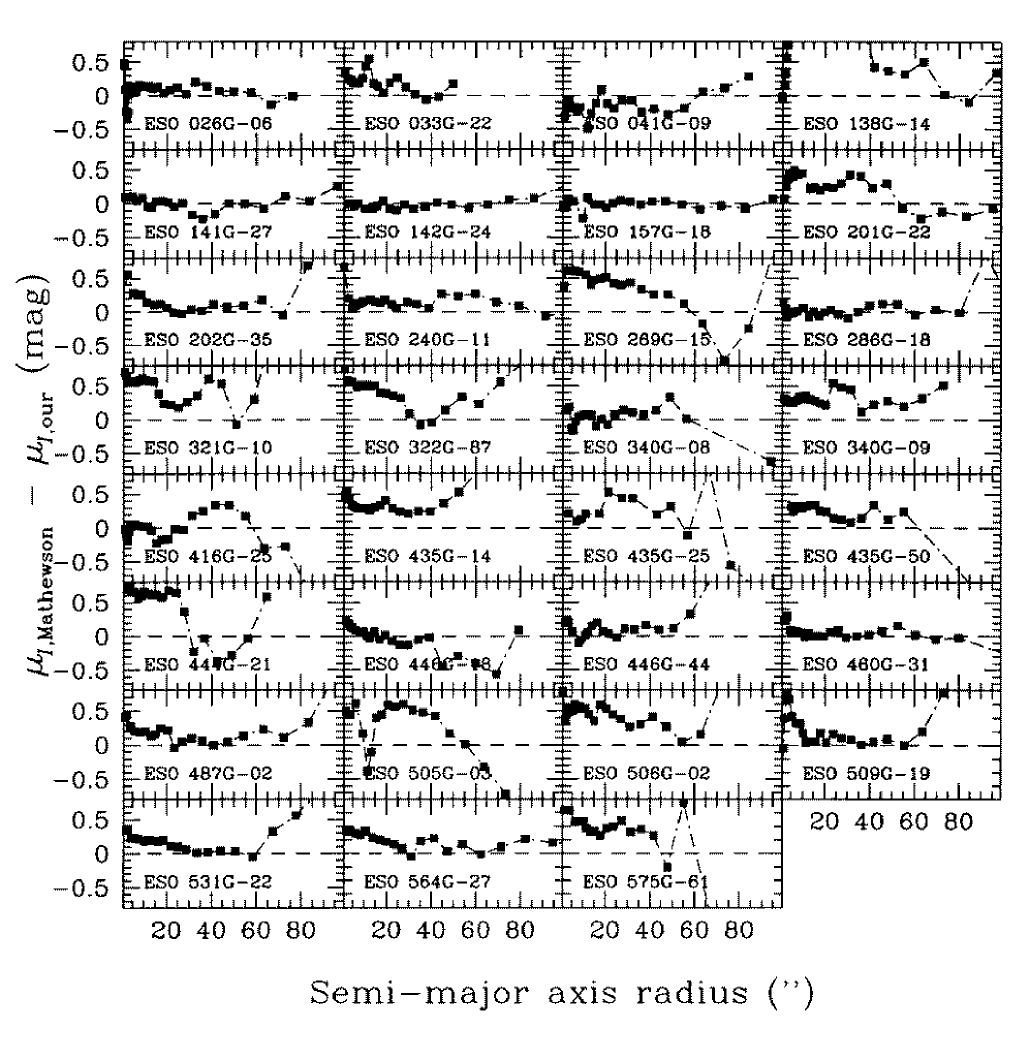
In general, we find that the differences between our and Mathewson’s measurements are small, although clear deviations are appreciated in a number of cases. In particular for those galaxies for which the difference between our and Mathewson’s profiles is relatively large (e.g., ESO 138G-14), we used observations obtained on different nights or with a different telescope to check our results. It was found that the features shown in Fig. 3 can be reproduced to within the observational errors. The main cause of deviations between Mathewson’s and our profiles, in particular at small semi-major axis radii, is the unpredictable influence of dust, which greatly affects the ellipse fitting in the inner galaxy regions.
From this comparison to previously published surface brightness profiles, we conclude that our observations reproduce both the photometric zero points and the behaviour of the galaxy light as a function of position across the galaxy disk to within the observational errors.
2.4 Extinction correction
As was shown by Aoki et al. (1991), the inner contours of the K-band image of NGC 891 are asymmetric. This shows that absorption is not completely negligible, even at these near-infrared wavelengths.
To correct for this small absorption effect at K, we used the I–K colour index as an extinction indicator, following Knapen et al. (1995). We assumed that deviations from an average I–K colour are due to dust only and that the Galactic extinction law applies also in external galaxies (see, e.g., Jansen et al. 1994). Although the exact use of this law requires a detailed knowledge of the geometry of the mixture of dust and stars, any errors caused by our assumptions are of second order, since the K extinction due to dust is small.
As an example, in NGC 891, Aoki et al. (1991) pointed out that the southwest part of the K-band image is rather patchy along the major axis, compared to the northeast part. The most likely explanation for this patchiness is that it is due to dust associated with spiral arms, as can be deduced from colour images.
In our assumptions, we ignore two kinds of systematic errors, as was pointed out by Knapen et al. (1995): a contribution of smoothly distributed dust, which does not alter the galaxy’s morphology, and effects due to population changes, which are believed to be small. In general I-K colours of stellar populations are very similar. For example stellar population models (e.g., Vazdekis et al. 1996) only show a small range for models of different ages and metallicities. Although population gradients probably are present, the errors made by not taking them into account are likely to be so small that it is better to apply this extinction correction than not to apply it.
Summarized, we corrected our profiles as follows:
| (5) |
where and are the corrected and observed profiles, and are the observed and mean colours, and and are the extinction in I and K, respectively. We used (Rieke & Lebofsky 1985). This extinction correction amounts to 0.55 mag in K at maximum, thus showing that we are dealing with optically thin regions in our galaxies. Therefore, by applying this correction, the errors that are caused by the incorrect underlying assumption that the dust is distributed in a foreground screen, are small.
2.5 A generalized family of density laws
By analyzing these -band images of our sample of edge-on disk galaxies we should be able to distinguish statistically between the various models for the vertical luminosity and mass density distribution.
As it seems reasonable to take the isothermal and exponential distributions as the two extremes, van der Kruit (1988) proposed to use the family of density laws
| (6) |
where K(z) is the observed K-band vertical density profile, is the extrapolated outer surface density in the galaxy plane, z is the distance from the plane, and is the vertical scale parameter. The isothermal model is the extreme for n = 1, and the exponential is the other extreme for . For comparison, for the isothermal sheet , where is the exponential vertical scale height. Therefore, the sharpness of the peak in a luminosity profile is determined by the exponent 2/n of this family of density laws (6).
In Fig. 4 we plot a few model luminosity distributions, with the exponential and the isothermal functions as the two extremes. We have adopted identical central surface brightnesses and vertical scale heights for each of these models.

The family of density (luminosity) laws (6) with the isothermal (2/n = 2.0) and the exponential (2/n = 0.0) distributions as the two extremes. The difference in 2/n between two successive model distributions is 0.125; for clarity, the sech(z) model distribution (2/n = 1.0) is shown as the dashed profile ( is the central surface brightness).
3 Results
3.1 Near-infrared profiles
In order to quantitatively distinguish between the various models, we tried to fit the extinction-corrected vertical light profiles in the K band with the extrapolated central surface brightness, the vertical scale parameter and the exponent 2/n as free parameters. To check the validity of the best-fitting 2/n thus obtained, we also tried to fit the vertical luminosity profiles with a continuous series of fixed values for the 2/n parameter. We compared the minimum in the distribution as a function of 2/n with the best-fitting n value resulting from the three-parameter fits. From this comparison, we concluded that resulting 2/n values from the three-parameter fits could reproduce the minima in the distribution with sufficient accuracy to be reliable indicators of the profiles’ shapes.
To show the accuracy of our fits, in Fig. 5 we have compiled all our vertical K-band profiles. We show the best-fitting model luminosity distributions obtained with the three-parameter fitting routine for those profiles that are sufficiently symmetric. The vertical luminosity profiles for each galaxy are shown in two separate panels, representing either side of the galaxy with respect to the galaxy center; for comparison, the central profiles are shown in each panel. In Table 2 we have listed the positions along the major axis at which the vertical luminosity profiles were extracted.
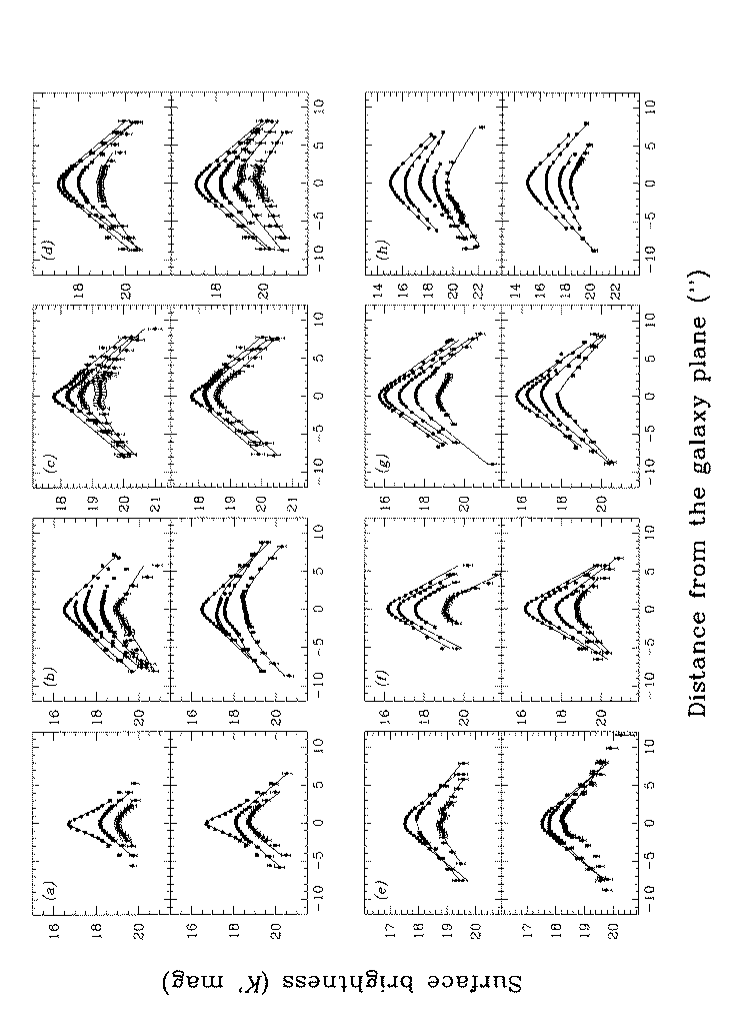
Vertical K-band luminosity profiles
for the sample galaxies: (a) ESO026G-06; (b) ESO041G-09;
(c) ESO141G-27;
(d) ESO142G-24; (e) ESO157G-18; (f) ESO201G-22; (g) ESO263G-15; (h) ESO286G-18.
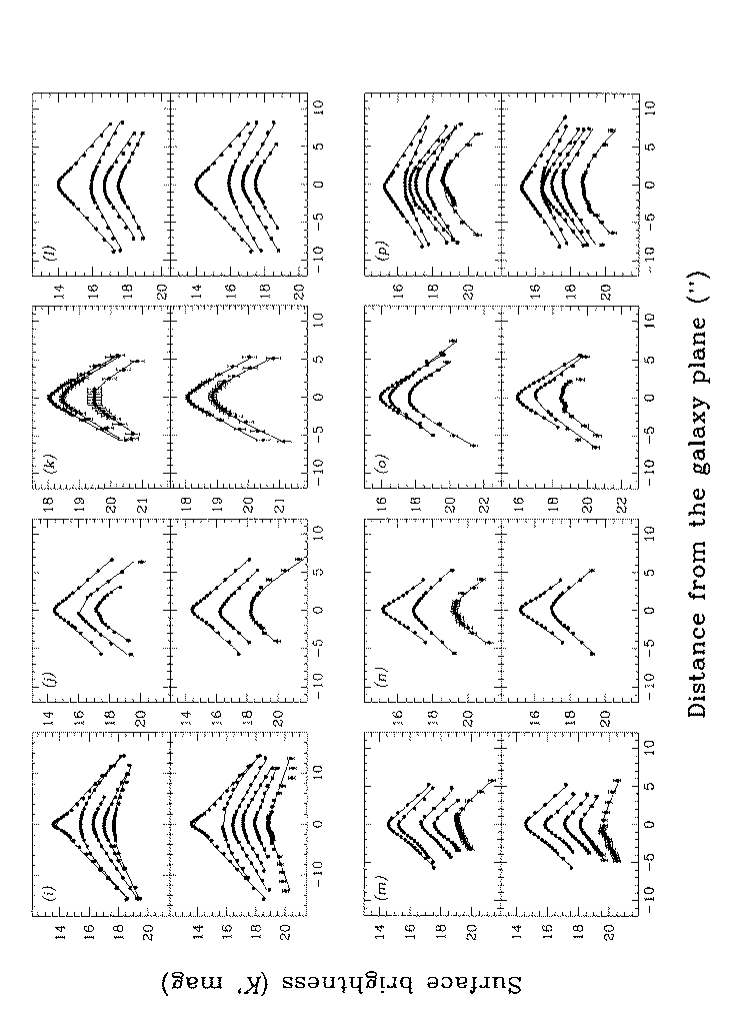
(Continued) (i) ESO311G-12; (j) ESO315G-20; (k) ESO340G-09; (l) ESO358G-29; (m) ESO383G-05; (n)
ESO416G-25;
(o) ESO435G-14; (p) ESO435G-25.
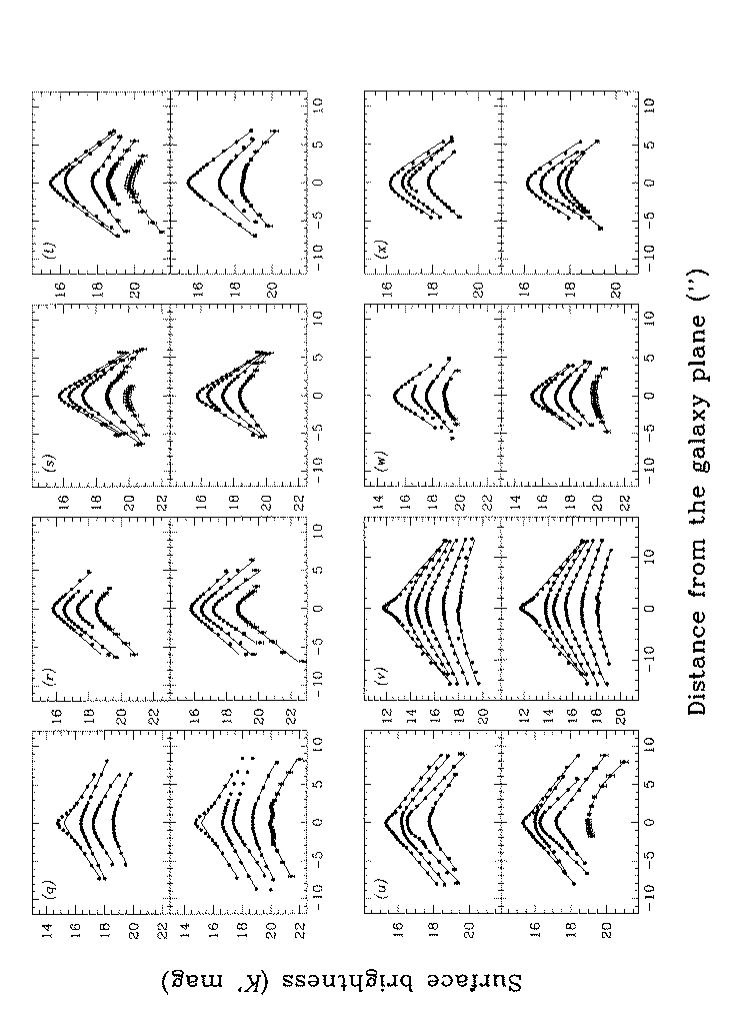
(Continued) (q) ESO437G-62; (r) ESO446G-18; (s) ESO446G-44; (t) ESO460G-31; (u) ESO487G-02; (v)
ESO500G-24;
(w) ESO509G-19; (x) ESO564G-27.
Columns: (1) Profile number (on either side of the galaxy center; 1 = central profile); (2) center position of radially averaged bin along the major axis (arcseconds); (3) bin width (arcseconds).
| Profile number | Center position | Bin width |
|---|---|---|
| (1) | (2) | (3) |
| 1 | 0.0 | 10.8 |
| 2 | 11.8 | 12.9 |
| 3 | 26.0 | 15.4 |
| 4 | 43.1 | 18.7 |
| 5 | 63.5 | 22.3 |
| 6 | 88.0 | 26.6 |
In Fig. 6 we present the distribution of the best-fitting values for the exponent of the family of luminosity laws (6) for our total sample of -band images.

Best-fitting exponents determining the sharpness of the peak in the galaxies’ vertical luminosity profiles. The galaxies are ordered by revised Hubble type, which is shown in the upper right corner of each panel. The dotted lines indicate the levels corresponding to an exponential profile (2/n = 0), an isothermal profile (2/n = 2), and the intermediate sech(z) distribution (2/n = 1). The dash-dotted line represents the mean best-fitting value for the galaxies’ disks, obtained by averaging the filled data points; the open circles were not taken into account when determining these levels, because of either bulge light contamination or an excessively high value. The positions along the major axis at which the luminosity profiles were extracted are expressed in units of their K-band radial scale length, .
We notice that, apart from the rather unpredictable behaviour in the central areas, where the disk luminosity is contaminated by a non-negligible bulge light contribution, the vertical luminosity profiles generally exhibit little variation of 2/n with position along the major axis. As has been shown by Andredakis et al. (1995), the early-type bulges are characterized by very steeply peaked luminosity profiles, whereas in the later-type galaxies the bulge profiles become closer to exponential. Therefore, we argue that the dominant bulge light contribution causes an increase of the cuspiness of the profiles, especially in the earlier-type galaxies.
In all panels of Fig. 6, we have indicated an estimated mean level of the best-fitting 2/n values by a dash-dotted line. These values are given in Table 3. In determining these mean levels, we have excluded both those fits that were substantially affected by bulge light contamination and those fits for which the resulting values of the minimization routine were excessively high, due to either a low signal-to-noise ratio or foreground stars superimposed on the galaxy. Especially in the (radially) outer parts of the galaxy disks our observations are rather noisy and therefore unreliable.
Columns: (1) Galaxy name (ESO-LV); (2) Revised Hubble Type (T); (3) and (4) Mean 2/n values and the (1 ) error obtained from the -band observations.
| Galaxy | Type | (2/n) | |
|---|---|---|---|
| (1) | (2) | (3) | (4) |
| ESO026G-06 | 7.0 | 0.39 | 0.10 |
| ESO041G-09 | 5.7 | 0.64 | 0.17 |
| ESO141G-27 | 6.0 | 0.27 | 0.10 |
| ESO142G-24 | 6.7 | 0.53 | 0.10 |
| ESO157G-18 | 6.6 | 0.27 | 0.09 |
| ESO201G-22 | 5.0 | 0.74 | 0.24 |
| ESO263G-15 | 6.0 | 0.31 | 0.13 |
| ESO286G-18 | 4.0 | 0.93 | 0.30 |
| ESO311G-12 | 0.0 | 0.51 | 0.15 |
| ESO315G-20 | 1.0 | 0.86 | 0.34 |
| ESO340G-09 | 7.0 | 0.65 | 0.16 |
| ESO358G-29 | –1.6 | 0.40 | 0.08 |
| ESO383G-05 | 3.7 | 0.17 | 0.04 |
| ESO416G-25 | 3.0 | 0.67 | 0.21 |
| ESO435G-14 | 5.0 | 0.79 | 0.27 |
| ESO435G-25 | 5.3 | 0.51 | 0.12 |
| ESO437G-62 | 3.0 | 0.48 | 0.16 |
| ESO446G-18 | 3.0 | 0.51 | 0.08 |
| ESO446G-44 | 6.0 | 0.52 | 0.14 |
| ESO460G-31 | 4.5 | 0.53 | 0.21 |
| ESO487G-02 | 3.5 | 0.38 | 0.13 |
| ESO500G-24 | –1.0 | 0.71 | 0.13 |
| ESO509G-19 | 4.0 | 0.76 | 0.22 |
| ESO564G-27 | 6.3 | 0.39 | 0.16 |
In general, we find that the mean levels for the sharpness of the band luminosity peaks indicate that the vertical luminosity distributions are more peaked than expected for the intermediate sech(z) function, proposed by van der Kruit (1988), though less peaked than exponential.
To study the variation of the cuspiness of the vertical profiles as a function of position along the major axis, we have averaged the data points of our -band observations in radial bins of 0.5 scale length, both for our total sample and for subsamples in certain ranges of revised Hubble type, T. The results are shown in Fig. 7. The central values for 2/n, , were used for normalisation; the positions along the major axis are expressed in units of the K-band radial scale lengths, . We determined the scale lengths by fitting ellipses to the two-dimensional galaxy isophotes in the regions away from the central dust lane, roughly between 1 and 4 radial scale lengths, depending on the bulge influence.
We chose to look at the galaxies in the type range (4 galaxies) because of their clear bulge contribution, and those in the range (13 galaxies), since they are well-behaved late-type galaxies without prominent bulges. The intermediate type range, with , is shown as well. For these galaxies the bulge influence is generally small, though not negligible. In order to reduce the noise in the earliest-types bin, the radial binning was done in intervals of 1.0 scale length.
We notice that the distribution of the sharpness of the vertical profiles remains, within the errors, constant as a function of position along the major axis, irrespective of galaxy type. Some of the (radially) outermost profiles show a slight increase of 2/n, corresponding to a rounder vertical profile, but in those regions the number of useful profiles is small and hence the errors are large. The innermost profiles, especially those in the earliest-types bin, are affected by bulge light and should therefore be left out of the analysis.

Averaged distributions of the sharpness of the vertical profiles as a function of position along the major axis, both for the total -band sample and for specific bins in revised Hubble type, T.
3.2 Effects of seeing
Since we are particularly interested in the behaviour of the vertical light distributions in edge-on disk galaxies at small z, we have to be careful to account for the effects of atmospheric smearing. No matter what the exact light distribution is, atmospheric seeing causes the profiles to show a flat-topped distribution in the galaxy planes. In order to circumvent this problem, we have to convolve our models with the seeing profile. Assuming that the actual point spread function can be adequately described by a Gaussian, the seeing convolved model profile is:
| (7) |
where and K(z) are the corrected and intrinsic model intensity profiles, is the dispersion of the seeing Gaussian and is the zeroth-order modified Bessel function of the first kind (Pritchet & Kline 1981; Andredakis & Sanders 1994).
The importance of atmospheric smearing on a particular vertical profile depends on the ratio of the seeing FWHM and the vertical scale height of the profile. The effects are most noticeable for (nearly) exponential profiles. In the case of an exponential light distribution, the seeing convolution becomes non-negligible for those observations with seeing FWHM , see Fig. 8a. In the present study of near-infrared observations, the seeing FWHM varies between 0.12 and 0.57 . Therefore we conclude that the (variation of the) cuspiness of the observed vertical profiles is real rather than an artifact of the method applied. This conclusion is supported by the fact that, in some of the earliest-type galaxies, we see a variation of the 2/n parameter along the major axis due to bulge light contamination, causing more sharply peaked vertical profiles, which is likely to be real.

(a) The influence of atmospheric smearing on an exponential vertical luminosity profile. The difference between the true and the observed distributions is shown as a function of the seeing FWHM, in units of the profile’s scale height; (b) Distribution of absolute magnitude versus 2/n, the typical error size is indicated in the lower left corner.
3.3 Comparison with I-band observations
To be able to compare our results with those published previously, we applied this method to our total sample of I-band observations, thereby using the same fitting ranges as for the -band data. It is immediately obvious that the I-band results are much noisier than those obtained in the band, largely due to the presence of clear dust lanes along the galaxies’ major axes. In those galaxies that show a well-behaved dependence of the 2/n value as a function of position along the galaxy’s major axis, we cannot distinguish statistically between the best-fitting 2/n values in the I band and those obtained in the band, within the errors. This is made clear in Fig. 9, where we compare the distributions of best-fitting 2/n levels between the two passbands. If we approximate the distributions of 2/n in the I and bands by a Gaussian, we find 2/n and 2/n. However, -band observations are clearly preferable to determine the sharpness of the peak of the vertical luminosity profiles unambiguously, because of their relative insensitivity to contamination by galactic dust. In the presence of a central dust lane, i.e. a deep trough in the vertical light distribution, one has to remove the central regions from the fit to get meaningful answers. While doing this, one often ends up only with the exponential outer parts of the vertical distribution, forcing the fitting routine to yield a more sharply peaked solution. Although we tried to fit the vertical profiles over the same range in z for both the I and -band observations, this was not always possible due to the disturbing effects of dust in the I-band data. Therefore the best-fitting I-band 2/n values are not very reliable. In the best-fitting 2/n value is hardly affected by a different fitting range, since the fit is dominated by the inner data points, which represent the luminosity distribution in the galaxy plane.

Comparison between the best-fitting exponents (2/n) obtained from both -band observations (left panel) and I-band observations (right panel). In the right panel, we show the subsample corresponding to the subsample shaded differently. Statistically, these two distributions are indistinguishable.
From Fig. 9 it can be seen that the median of the best-fitting 2/n value lies in between the exponential (2/n = 0.0) and the intermediate sech(z) model (2/n = 1.0). It is therefore not surprising to note that in previously published papers by, e.g., Wainscoat et al. (1989) for the large southern edge-on galaxy IC 2531, and Gilmore & Reid (1983) for the Galaxy, the exponential and the sech(z) models were found to fit the data equally well (van der Kruit 1988).
When studying the relation between the sharpness of the peaks and various global parameters for our sample galaxies, little correlation was detected, although it seems that the smallest galaxies generally show a more sharply peaked vertical distribution than the larger galaxies. In other words, for those galaxies with the faintest absolute magnitudes ( or ), we find a lack of “rounder” profiles () compared with those galaxies with brighter absolute magnitudes, as can be seen in Fig. 8b.
Although we do not find clear correlations with global galaxy parameters, we argue that the radial distribution of 2/n is universal (i.e., we do not find any significant variations as a function of galaxy type), exhibiting only local variations due to, e.g., residual dust contamination (see, e.g., Wainscoat et al. 1989; Aoki et al. 1991).
3.4 Extinction analysis
In Fig. 10 we show the central profiles of all sample galaxies in both I and band, and their corresponding I–K colour, to give an indication of the importance of contamination by dust in the I-band observations.
The vertical colour profiles seem to indicate strong extinction in the plane of the galaxy, and no extinction in the outer parts. We therefore define the constant colour in the outer parts to be the colour of the stars in the galaxy, and the maximum I–K difference to be the I–K colour excess, .
In Table 4 we give, on the first line, crude estimates for the maximum (edge-on) I–K colour excess, , in the galaxy planes, at various positions along the galaxies’ major axes. We obtained these estimates by averaging our vertical colour profiles on both sides of the galaxy centers. In deriving these colour excesses we assume that there is little or no dust mixed in with the stellar population outside the dust lane region, as seems likely from the smooth vertical colour profiles. From a comparison with published colours of moderately inclined Sc galaxies, Kuchinski & Terndrup (1996) have shown that there is indeed little or no reddening away from the dust lane. Secondly, we have neglected any change in intrinsic colour due to a stellar population gradient by assuming that the intrinsic colours of the dominant stellar population in the dust lane region are identical to those away from the dust lane. Kuchinski & Terndrup (1996) argue that a population gradient would result in a very small colour change compared to the total colour change across the dust lane and that we can therefore assume that the colour exces is largely due to dust extinction.
By using the Galactic extinction law we derive that , the maximum (edge-on) I-band extinction. From this, one can derive the optical depth, and the optial depth in V: .
In all our sample galaxies, remains constant or decreases as a function of projected galactocentric distance, which could be a characteristic of an exponentially decreasing dust contribution. Jansen et al. (1994) find, for a small sample of highly inclined spiral galaxies, that the maximim extinction in the dust lane () decreases rapidly with increasing galactocentric distance.
For each position for which we give the maximum I–K colour excess, we also tabulate the inferred maximum I-band optical depths, , assuming a uniform mixture of dust and stars in the galaxy planes, taken from Walterbos & Kennicutt (1988):
| (8) |
For the same optical depth, the uniform mixture of dust and stars causes less I-band extinction, , than the classical foreground screen model, because part of the extinction lies behind the source. In Table 4 we have also listed the inferred face-on optical depth estimates. For face-on galaxies we have assumed the galaxies to be 9 times less opaque than in the highly-inclined case, which reflects the difference in path length through the disk at both positions. Of course, the face-on optical depth can only be estimated in a rough way; in reality the optical depth depends on the geometry of the dust and stars (which we have assumed to be uniformly mixed), the filling factor of the disk components (in our approximation we have neglected the possibility of a patchy dust distribution and the presence of spiral arms), and the major-to-minor axis ratio, which does not need to be 9 for all our sample galaxies.
Columns: (1) Galaxy name; (2)–(4) first line: Extinction estimates at the galaxy center, at 1 and at 2 radial (-band) scale lengths. The accuracy of the numbers is indicative of the quality of the colour profile; second line: Inferred maximum I-band optical depths, , assuming a uniform mixture of dust and stars (edge-on and face-on values).
| Galaxy | R = 0 | ||
|---|---|---|---|
| (1) | (2) | (3) | (4) |
| ESO 026 G- 06 | 0.50 0.05 | 0.5 0.1 | 0.4 0.1 |
| 1.01 0.11 | 1.01 0.11 | 0.79 0.09 | |
| ESO 041 G- 09 | 1.15 0.15 | 1.0 0.2 | 0.9 0.2 |
| 2.69 0.30 | 2.25 0.25 | 1.97 0.22 | |
| ESO 141 G- 27 | 0.0 0.1 | 0.0 0.1 | 0.0 0.1 |
| 0.00 0.00 | 0.00 0.00 | 0.00 0.00 | |
| ESO 142 G- 24 | 0.65 0.10 | 0.6 0.1 | 0.3 0.1 |
| 1.35 0.15 | 1.23 0.14 | 0.58 0.06 | |
| ESO 157 G- 18 | 0.30 0.10 | 0.25 0.15 | 0.0 0.1 |
| 0.58 0.06 | 0.48 0.05 | 0.00 0.00 | |
| ESO 201 G- 22 | 0.9 0.1 | 0.9 0.1 | |
| 1.97 0.22 | 1.97 0.22 | ||
| ESO 263 G- 15 | 1.30 0.10 | 0.85 0.10 | 0.6 0.1 |
| 3.18 0.35 | 1.86 0.20 | 1.23 0.14 | |
| ESO 286 G- 18 | 1.30 0.10 | 0.9 0.1 | 0.5 0.1 |
| 3.18 0.35 | 1.97 0.22 | 1.01 0.11 | |
| ESO 311 G- 12 | 0.7 0.1 | 0.4 0.1 | 0.0 0.1 |
| 1.46 0.16 | 0.79 0.09 | 0.00 0.00 | |
| ESO 315 G- 20 | 2.1 0.1 | 1.4 0.2 | 0.7 0.2 |
| 6.91 0.76 | 3.52 0.39 | 1.46 0.16 | |
| ESO 340 G- 09 | 0.20 0.05 | 0.25 0.10 | 0.0 0.1 |
| 0.38 0.04 | 0.48 0.05 | 0.00 0.00 | |
| ESO 358 G- 29 | 0.60 0.05 | 0.0 0.1 | 0.0 0.1 |
| 1.23 0.14 | 0.00 0.00 | 0.00 0.00 | |
| ESO 383 G- 05 | 2.70 0.05 | 2.3 0.1 | 1.4 0.1 |
| 12.02 1.32 | 8.32 0.92 | 3.52 0.39 | |
| ESO 416 G- 25 | 1.6 0.1 | 0.9 0.1 | 0.5 0.1 |
| 4.31 0.47 | 1.97 0.22 | 1.01 0.11 | |
| ESO 435 G- 14 | 0.8 0.1 | 0.8 0.1 | 0.8 0.1 |
| 1.71 0.19 | 1.71 0.19 | 1.71 0.19 | |
| ESO 435 G- 25 | 2.3 0.1 | 1.8 0.1 | 1.3 0.1 |
| 8.32 0.92 | 5.20 0.58 | 3.18 0.35 | |
| ESO 437 G- 62 | 2.00 0.05 | 1.0 0.1 | 0.4 0.1 |
| 6.29 0.69 | 2.25 0.25 | 0.79 0.09 | |
| ESO 446 G- 18 | 1.2 0.1 | 1.2 0.1 | 0.8 0.1 |
| 2.85 0.31 | 2.85 0.31 | 1.71 0.19 | |
| ESO 446 G- 44 | 1.50 0.10 | 1.10 0.10 | 0.7 0.1 |
| 3.91 0.43 | 2.54 0.28 | 1.46 0.16 | |
| ESO 460 G- 31 | 1.0 0.1 | 0.4 0.2 | 0.4 0.1 |
| 2.25 0.25 | 0.79 0.09 | 0.79 0.09 | |
| ESO 487 G- 02 | 1.50 0.05 | 0.9 0.1 | 0.4 0.1 |
| 3.91 0.43 | 1.97 0.22 | 0.79 0.09 | |
| ESO 500 G- 24 | 0.0 0.1 | 0.0 0.1 | 0.0 0.1 |
| 0.00 0.00 | 0.00 0.00 | 0.00 0.00 | |
| ESO 509 G- 19 | 1.00 0.10 | 0.8 0.1 | 0.4 0.1 |
| 2.25 0.25 | 1.71 0.19 | 0.79 0.09 | |
| ESO 564 G- 27 | 1.20 0.05 | 0.8 0.1 | 0.4 0.1 |
| 2.85 0.31 | 1.71 0.19 | 0.79 0.09 |
Note: I–K colour profile too noisy.
In Fig. 11a we present the mean values for the maximum I-band edge-on optical depth as a function of Hubble type and for different positions. The scatter in this figure is large due to the small number of data points available, but also because of the uncertainties in the galaxy classification inherent to edge-on galaxies. Therefore, we can only draw qualitative inferences from the behaviour of the optical depth as a function of galaxy type. This behaviour suggests an increasingly important dust contribution from the lenticular and early spiral galaxies towards later types, although for the latest galaxy types the dust content seems to diminish relative to the intermediate types.
This result is in qualitative agreement with that of Peletier et al. (1994), and Peletier & Balcells (1997) (see also Peletier & Balcells 1996), who studied the type dependence of the R and I vs. radial scale length ratios of a sample of some 70 disk galaxies, both face-on and edge-on. From Fig. 11b it is clear that the radial colour gradients, indicated by deviations from unity of this ratio, are smallest for the early-type sample galaxies, whereas in the later types they vary considerably.
Peletier et al. (1994) have shown that scale length ratios due to stellar population changes are of order 1.1–1.2 in the blue – near-infrared range; in the I vs. range this contribution is likely to be less. Therefore, the observed scale length ratios largely represent the galaxies’ dust content.
Although the scale length ratios indicate a more or less constant dust content for galaxy types later than about (Sb), the data suggests that the ratios decrease towards later types, as is also found from the optical depth measurements.
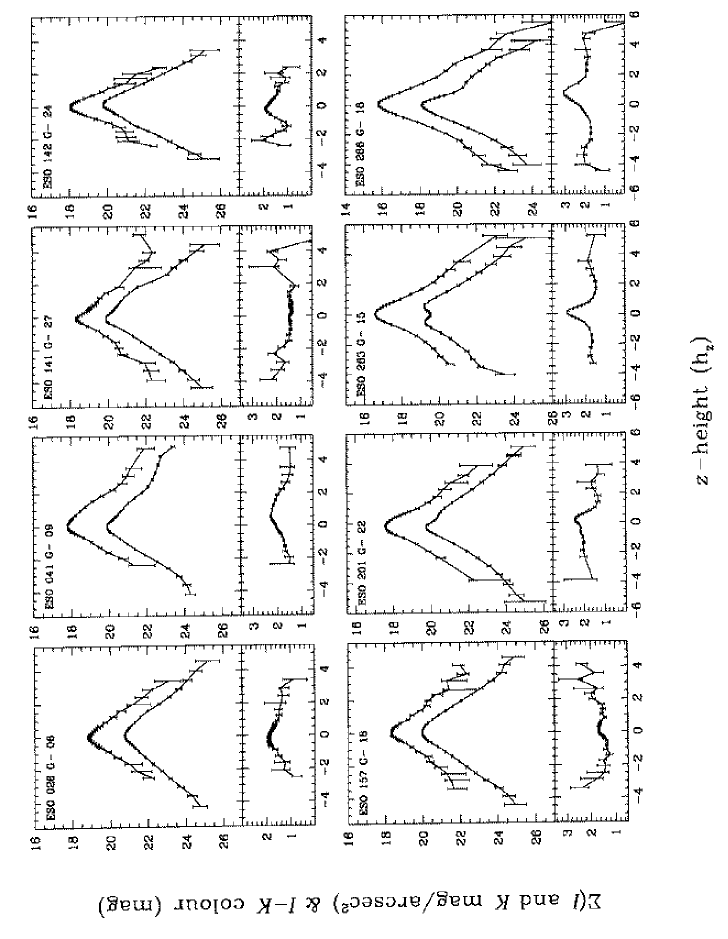
Central I and K-band vertical profiles for the total sample, and their corresponding I–K colours
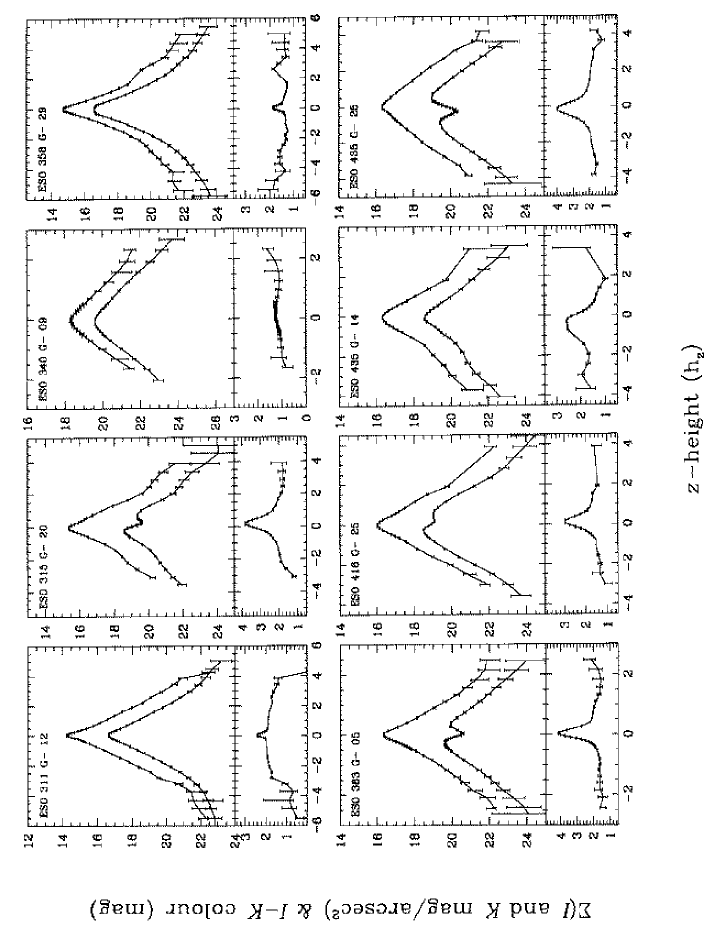
(Continued)
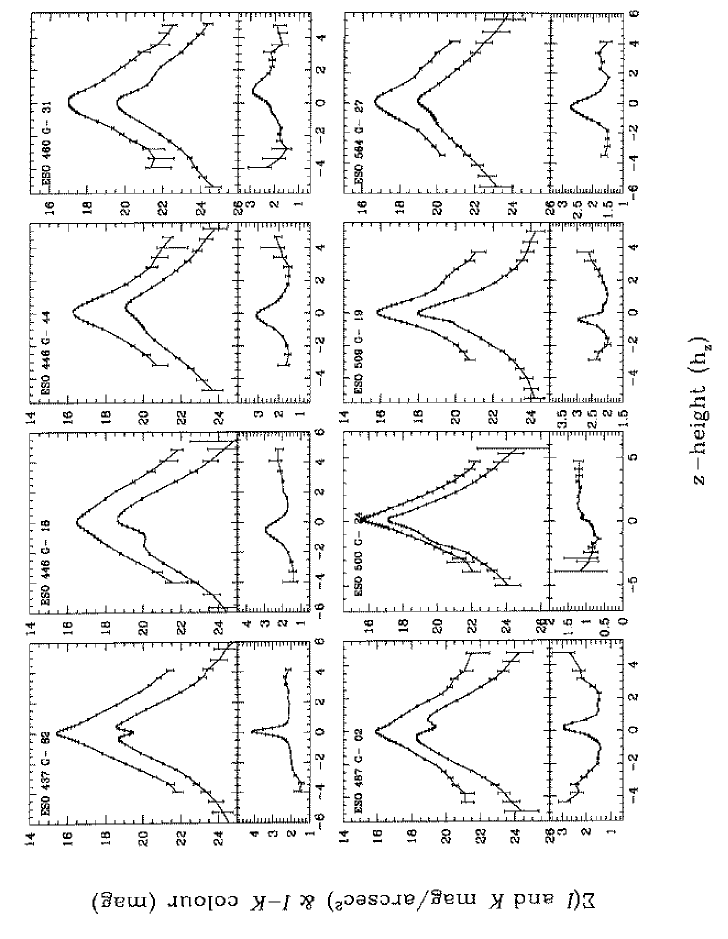
(Continued)

(a) Maximum I-band optical depths as a function of galaxy type. The errors are statistical errors; where no error bars are given, only one data point was available in the specific type bin, indicated by the bars; (b) Type dependence of the I vs. scale length ratio. The filled circles are from the observations presented in this paper, the open circles from Peletier et al. (1994), and the crosses from Peletier & Balcells (1997).
4 Discussion
4.1 Main observational results
As shown in the previous section, our main observational results are the following:
-
•
The mean levels for the sharpness of the -band luminosity peaks indicate that the vertical luminosity distributions are more peaked than expected for the intermediate sech(z) distribution, but rounder than exponential.
-
•
In the majority of our sample of edge-on disk galaxies, we find that the sharpness of the peak of the vertical profiles, characterized by the exponent 2/n of the generalized family of fitting functions (6) (van der Kruit 1988), varies little with position along the major axis. This result is independent of galaxy type.
-
•
Due to the unpredictable contamination by in-plane dust, -band observations are preferred to I-band measurements, although statistically we cannot distinguish between the results obtained in either of the two passbands. In general, the I-band determinations of the best-fitting 2/n values are much noisier than those obtained in the near-infrared.
-
•
The behaviour of the maximum I-band optical depth as a function of galaxy type suggests an increasingly important dust contribution from the lenticular and early spiral galaxies towards later types, although for the latest galaxy types the dust content seems to diminish relative to the intermediate types.
-
•
For those galaxies with the faintest absolute magnitudes, we find a lack of “rounder” profiles compared to those galaxies with brighter absolute magnitudes.
4.2 Projection effects
In interpreting the observed surface brightness distributions as surface density representations, we should be cautious: different stellar populations may have both different mass-to-light ratios and different velocity dispersions. Moreover, the observed galaxy surface brightness distributions are line-of-sight integrations of the light contributions and therefore include contributions from very different locations in the disk. However, as noted by, e.g., Dove & Thronson (1993), these effects are normally considered to be small.
Kylafis & Bahcall (1987) showed that the main effects of scattering are the reduction of the extinction in the dust lane due to forward scattering and an apparent thickening of the central layer of high luminosity. This would not lead to a more sharply peaked profile if the underlying light (or density) distribution were isothermal. Moreover, scattering is not expected to be important in the near-infrared for edge-on galaxies (Kuchinski & Terndrup 1996).
Since the differences between the models discussed here are small, we have investigated the effects of projection. Projection effects lead to an apparent thickening of the high-luminosity midplane of the galaxy. Deviations from an inclination of 90∘ cause a slight increase of the scale height, as can be seen in Fig. 12a. The effect is comparable for the exponential and the isothermal models. We are confident that none of our sample galaxies have inclinations lower than .
The effect on the 2/n values of deviations from a inclination is shown in Fig. 12b for an exponential distribution at the galaxy center, at 1 and at 2 radial scale lengths, respectively. For exponential distributions the effects of projection are most noticeable, compared to more flattened vertical luminosity distributions. In fact, the effects of projection can be so large, that all our galaxies can have intrinsically exponential vertical surface brightness distributions.

Importance of projection effects on the results obtained. An intrinsic axis ratio of was assumed (Guthrie, 1992). Projection effects are shown for a vertical surface brightness profile at the galaxy center (short-dashed line), at 1 radial scale length (dotted line) and at 2 radial scale lengths (long-dashed line). (a) Projection effects cause an increasing scale height with increasing deviations from a inclination; (b) The influence of projection effects on the 2/n parameter.
4.3 Disk heating
In this paper we show that the universal vertical structure that is observed away from the galaxy planes is maintained even when going all the way down to very low z distances. Models that aim to explain this observational fact should also be able to account for intrinsically exponential vertical surface brightness or density distributions.
As Dove & Thronson (1993) warn, if the vertical distribution of stars cannot be fit well by the isothermal sheet approximation, which model is based on physical principles, then rather than invoking an arbitrary alternative function, a more physical function should be that of a nonisothermal stellar distribution. A nonisothermal distribution of stars can be represented by a linear combination of isothermal components (Oort 1932).
It is possible that once a coeval population of stars has been formed, they do not (or only over a long period of time) interact with other components and are therefore quasi-independent isothermal components (Dove & Thronson 1993). Such a model would be physically realistic, since if stars have formed at different times with different velocity dispersions and have not yet reached an equilibrium state, or if the stars are dynamically heated during their evolution, the resulting distribution of stars would not be well approximated by a single isothermal model. From observational evidence we know that stellar subpopulations of different ages have different velocity dispersions. Star formation is generally believed to be a continuous process. Therefore, a more accurate model for a galaxy disk is a superposition of a very large number of components, or, as Kuijken (1991) proposed, an integral representation.
The observations presented in this paper indicate that the physical process responsible for the vertical luminosity profiles is probably both global and universal in nature, since we do not find any significant radial variations of the cuspiness of the profiles, nor large variations as a function of galaxy type.
This puts interesting constraints on the dominant vertical heating mechanism in galaxy disks.
Although the dominant perturbations in a disk are the spiral waves, they have a close relationship with the giant molecular clouds (GMCs). Julian & Toomre (1966) and Julian (1967) suggested that the GMCs must acquire large wakes of material, thus increasing the effective mass of the combined spiral and GMC perturbation. These wakes can be very strong, but will also spread over a large area of the disk, which makes it more difficult to assess the importance of such wakes in enhancing the scattering efficiency. Moreover, at present there is no satisfactory explanation as to how disk heating, the rate of which must vary greatly with radius from the observed distribution of GMCs in our own and other galaxies, can naturally lead to a global and universal vertical density distribution and a constant scale height with galactocentric distance (i.e., is independent of R) (e.g., Jenkins 1992).
4.4 Isothermal versus exponential distributions
Jenkins (1992) finds, that his model disk heating process, i.e., combined spiral and GMC perturbations enhanced by disk accretion, together with constant star formation, always leads to a closely isothermal stellar population. Wielen (1977) reached a similar conclusion based on observational data.
Burkert & Yoshii (1996) show, based on realistic hydrodynamical calculations of disk evolution processes, that – if one starts from a non-equilibrium gaseous state – the final vertical stellar density profile depends strongly on the initial distribution of the protodisk gas, as opposed to the GMC heating process described in the previous section.
On the other hand, if they assume that the gas settles into isothermal equilibrium prior to star formation and gas cooling, then always an exponential density profile is formed, although the vertical scale height increases as a function of decreasing surface brightness. In fact, in de Grijs & Peletier (1997) we presented the results of a detailed study of the vertical scale height distributions in the present sample, for which we found an increasing scale height with galactocentric distance, in particular for the earlier-type galaxies. An interesting result from the calculations of Burkert & Yoshii (1996) is that when the ratio of the star formation time scale to the cooling time scale lies in the range between 0.3 and 3, the vertical stellar density distribution becomes exponential, independent of the free parameters in their modeling and also independent of the initial (isothermal) disk temperature and the initial surface density.
Therefore, the process of crucial importance is that the SFR is adjusted sooner or later to balance with the local cooling rate (Burkert & Yoshii 1996).
Just et al. (1996) find that if the SFR decreases with time, exponential luminosity profiles also grow naturally. They state that since the mass-to-light ratio of a stellar population increases with age, an exponential luminosity profile corresponds to a density profile that is slightly flattened to the galaxy plane. However, an isothermal density distribution is too thick to explain exponential light profiles. For a constant SFR an obvious luminosity excess near the plane would show up in the optical bands, when assuming a heating mechanism of the type observed in the solar neighbourhood.
The fact that we observe a more strongly peaked vertical light distribution than a sech(z) model in all our sample galaxies, independent of galaxy type, indicates that the process at work here is a process intrinsic to the disks themselves, rather than a type-dependent mechanism. The variations in the cuspiness of our profiles along the galaxies’ major axes are probably due to some local mechanism, e.g. the contamination by residual dust. Although we observe a similar behaviour in S0s as in later-type galaxies, this does not necessarily mean that they all possess young populations, although the young population contributes also in the near-infrared. The dominant stellar population in is the old population, with ages of several Gyrs, which is likely present in both early and late-type galaxies. Therefore our observational result of a universal vertical density profile in the near-infrared is not incompatible with no type dependence.
Finally, the fact that we observe a lack of “rounder” profiles in the smaller galaxies compared with the larger ones, may indicate that we are hindered by an underlying dust component, which is concentrated towards the galaxy planes, and more extended in the larger galaxies than in the smaller ones, at least to an outside observer. It may be that in the smaller galaxies this dust component affects relatively fewer data points than in the larger ones, thus causing a bias towards more sharply peaked vertical profiles.
5 Summary and Conclusions
In this paper we have studied the sharpness of the peaks of the vertical luminosity and density distribution in a statistically complete sample of edge-on disk galaxies. The results obtained in this paper are based on near-infrared -band observations. The main results obtained in this study are the following:
-
•
In the majority of our sample of edge-on disk galaxies, we find that the sharpness of the peak of the vertical profiles, characterized by the exponent 2/n of the generalized family of fitting functions (6) (van der Kruit 1988), varies little with position along the major axis. This result is independent of galaxy type.
-
•
The mean levels for the sharpness of the -band luminosity peaks indicate that the vertical luminosity distributions are more peaked than expected for the intermediate sech(z) distribution, but rounder than exponential. Since projection of a galaxy causes the profile to be flattened near the galaxy plane, our result is consistent with the hypothesis that all spiral galaxies have exponential vertical profiles. The fact that we observe this in all our sample galaxies indicates that the process at work here is a process intrinsic to the disks themselves.
-
•
For those galaxies with the faintest absolute magnitudes, we find a lack of “rounder” profiles compared with those galaxies with brighter absolute magnitudes. This may indicate that we are hindered by an underlying dust component, which is concentrated towards the galaxy planes, and more extended in the larger galaxies than in the smaller ones, at least to an outside observer. It may be that in the smaller galaxies this dust component affects relatively fewer data points than in the larger ones, thus causing a bias towards more sharply peaked vertical profiles.
Acknowledgements
- We would like to thank Kor Begeman and Yiannis Andredakis for their assistance in the development of the necessary software to carry out this statistical study. We also acknowledge the discussions with colleagues at the Kapteyn Institute, notably Rolf Jansen and David Fisher.
References
- [] Andredakis, Y.C., Sanders, R.H., 1994, MNRAS 267, 283
- [] Andredakis, Y.C., Peletier, R.F., Balcells, M., 1995, MNRAS 275, 874
- [] Aoki, T.E., Hiromoto, N., Takami, H., Okamura, S., 1991, PASJ 43, 755
- [] Bahcall, J.N., 1984a, ApJ 276, 169
- [] Bahcall, J.N., 1984b, ApJ 287, 926
- [] Burkert, A., Yoshii, Y., 1996, MNRAS, 282, 1349
- [] Buser, R., 1978, A&A 62, 411
- [] Carlberg, R.G., 1987, ApJ 322, 59
- [] Carter, B.S., Meadows, V.S., 1995, MNRAS 276, 734
- [] de Grijs, R., Peletier, R.F., 1997, A&A 320, L21
- [] de Grijs, R., van der Kruit, P.C., 1996, A&AS 117, 19
- [] de Jong, R.S., van der Kruit, P.C., 1994, A&AS 106, 451
- [] Davies, J.I., 1990, MNRAS 244, 8
- [] Disney, M., Davies, J., Phillipps, S., 1989, MNRAS 239, 939
- [] Dove, J.B., Thronson, Jr., H.A., 1993, ApJ 411, 632
- [] Fuchs, B., Wielen, R., 1987, in: The Galaxy, eds. G. Gilmore, R. Carswell, Reidel, Dordrecht, p. 375
- [] Gilmore, G., Reid, N., 1983, MNRAS 202, 1025
- [] Guthrie, B.N.G., 1992, A&AS 93, 255
- [] Hill, G., Hilditch, R.W., Barnes, J.V., 1979, MNRAS 186, 813
- [] Hubble, E., 1926, ApJ 64, 321
- [] Jansen, R.A., Knapen, J.H., Beckman, J.E., Peletier, R.F., Hes, R., 1994, MNRAS 270, 373
- [] Jenkins, A., 1992, MNRAS 257, 620
- [] Julian, W.H., 1967, ApJ 148, 175
- [] Julian, W.H., Toomre, A., 1966, ApJ 146, 810
- [] Just, A., Fuchs, B., Wielen, R., 1996, A&A 309, 715
- [] Kent, S.M., Dame, T.M., Fazio, G., 1991, ApJ 378, 131
- [] Knapen, J.H., Beckman, J.E., Shlosman, I., Peletier, R.F., Heller, C.H., de Jong, R.S., 1995, ApJ 443, L73
- [] Kuchinski, L.E., Terndrup, D.M., 1996, AJ 111, 1073
- [] Kuijken, K., 1991, ApJ 372, 125
- [] Kylafis, N., Bahcall, J.N., 1987, ApJ 317, 637
- [] Landolt, A.U., 1992, AJ 104, 340
- [] Lauberts, A., Valentijn, E.A., 1989, The Surface Photometry Catalogue of the ESO-Uppsala Galaxies (ESO-LV), ESO
- [] Mathewson, D.S., Ford, V.L., Buchhorn, M., 1992, ApJS 81, 413
- [] Mathewson, D.S., Ford, V.L., 1996, ApJS 107, 97 (AAS CD-ROM Series, Vol. 7)
- [] Oort, J.H., 1932, Bull. Astron. Inst. Netherlands 6, 249
- [] Peletier, R.F., 1993, A&A 271, 51
- [] Peletier, R.F., Valentijn, E.A., Moorwood, A.F.M., Freudling, W., 1994, A&AS 108, 621
- [] Peletier, R.F., Balcells, M., 1996, in: Spiral Galaxies in the Near-IR, eds. Minnitti, D., Rix, H.-W., ESO/MPA Workshop, Springer: Heidelberg, p. 48
-
[]
Peletier, R.F., Balcells, M., 1997, New Astr. 1, 349
(http://www1.elsevier.nl/journals/newast/jnl/articles/ S138410769700002X/) - [] Pritchet, C., 1983, AJ 88, 1476
- [] Pritchet, C., Kline, M.I., 1981, AJ 86, 1859
- [] Rieke, G.H., Lebofsky, M.J., 1985, ApJ 288, 618
- [] Rix, H.-W., Rieke, M.J., 1993, ApJ 418, 123
- [] Spitzer, L., 1942, ApJ 95, 329
- [] Thuan, T.X., Gunn, J.E., 1976, PASP 88, 543
- [] Tsikoudi, V., 1979, ApJ 234, 842
- [] van der Kruit, P.C., 1983, Proc. Astron. Soc. Aust. 5, 136
- [] van der Kruit, P.C., 1988, A&A 192, 117
- [] van der Kruit, P.C., Searle, L., 1981a, A&A 95, 105
- [] van der Kruit, P.C., Searle, L., 1981b, A&A 95, 116
- [] van der Kruit, P.C., Searle, L., 1982a, A&A 110, 61
- [] van der Kruit, P.C., Searle, L., 1982b, A&A 110, 79
- [] van Dokkum, P.G., Peletier, R.F., de Grijs, R., Balcells, M., 1994, A&A 286, 415
- [] Vazdekis, A., Casuso, E., Peletier, R.F., Beckman, J.E., 1996, ApJS 106, 307
- [] Wielen, R., 1977, A&A 60, 263
- [] Wainscoat, R.J., Cowie, L.L., 1992, AJ 103, 332
- [] Wainscoat, R.J., Freeman, K.C., Hyland, A.R., 1989, ApJ 337, 163
- [] Walterbos, R.A.M., Kennicutt, R.C., 1988, A&A 198, 61