An Anisotropic Illumination Model
of Seyfert I Galaxies
Abstract
We develop a self-consistent model of Seyfert galaxies continuum emission. The high energy source is assumed to be an optically thin plasma of highly relativistic leptons (), at rest at a given height on the disk axis. Such a geometry is highly anisotropic, which has a strong influence on Compton process. Monte-Carlo simulations allow the superposition of a reflected component to the UV to X-ray spectrum obtained with our model, leading us to a first comparison with observations by fitting the high energy spectra of NGC4151 and IC4329a.
Introduction
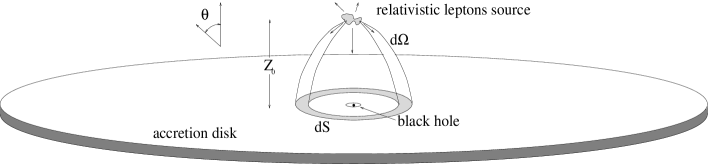
We propose a new model, for Seyfert galaxies, involving a point source of relativistic leptons located above the disk (that could be physically realized by a strong shock terminating an aborted jet) emitting hard radiation by Inverse Compton (IC) process on soft photons produced by the accretion disk. The disk itself radiates only through the re-processing of the hard radiation impinging on it, i.e. we do not suppose any internal energy dissipation (cf Fig. 1). Such a geometry is highly anisotropic, which takes a real importance in the computation of IC process (Ghi91 , Hen* ). We treat both Newtonian and general relativistic cases Pet* , deriving a self-consistent solution in the Newtonian case. We have recently added Monte-Carlo calculations to take into account, in the high energy part of our synthetic spectra, the compton reflection component and the fluorescent iron line Pou90 . We present here the most important results supplied by the model.

Angular distribution of the hot source
It appears that the anisotropy of the soft photon field at the hot source level, leads to an anisotropic Inverse Compton process, with much more radiation being scattered backward than forward. Such an anisotropic re-illumination could naturally explain the apparent X-ray luminosity, usually much lower than the optical-UV continuum emitted in the blue bump WalF93 . It can also explain the equivalent width observed for the iron line, which requires more impinging radiation than what is actually observed Nan97 . We plot in Figure 2 the angular distribution of the power emitted by the hot source in Newtonian metrics and for different values of the source height in Kerr metrics. It appears that the closer the source to the black hole is, the less anisotropic the high energy photon field is. This is principally due to the curvature of geodesics making the photons emitted near the black hole arrive at larger angle than in the Newtonian case.
Disk temperature profile
The radiative balance between the hot source and the disk allows to compute the temperature profile on the disk surface. It is, in fact, markedly different from “standard accretion disk model” as shown in Figure 2. Indeed, even if at large distances, all models give the same asymptotic behavior , in the inner part of the disk, it keeps increasing in “standard model” whereas, in our model, for , the temperature saturates around a characteristic value . The differences between Newtonian and Kerr metrics come only from Gravitational and Doppler shifts, which are only appreciable for .

Influence of the inclination angle
The overall UV to X-ray spectra can be deduced from this model. The bulk of the energy coming from the disk gives the well-known “blue-bump”. On the other hand, in order to avoid run-away electrons, the relativistic particle distribution is supposed to be a power law with an exponential cut-off about 300 keV, giving the high energy part of the spectrum. One can see on Figures 3a Newtonian spectra for different inclination angles for . For all inclination angles, the Kerr spectra are always weaker in UV and brighter in X-ray than the Newtonian ones. These effects are much less pronounced for high values because the emission area is much larger, and thus is less affected by relativistic corrections.
Influence of the hot source height
Figure 3b shows the overall spectrum, for different values of in Kerr metrics for . The relativistic effects become important for values of smaller than about . They produce a variation of intensity lowering the blue-bump and increasing the hard X-ray emission. The change in the UV range is due to the transverse Doppler effect between the rotating disk and the observer, producing a net red-shift. In the X-ray range, the variation is due to the high energy dependence on (cf Figure 2). The observed X/UV ratio can then be strongly altered by these effects. Quantitatively, the luminosity ratio between the maximum of the blue-bump and the X-ray plateau goes from in the Newtonian case, to for .
Scaling laws
With some further assumptions, the model predicts scaling laws quite different from the standard accretion models. If one assumes a constant high energy cut-off (possibly fixed by the pair production threshold) and a constant solid angle subtended by the hot source, then the following mass scaling laws apply:
The first equality could explain the weak variations of the blue bump component, even though the luminosity L ranges over 6 orders of magnitude from source to source WalF93 . The second one is in agreement with the results of Col91 where they find in a sample of Seyfert I and quasars a correlation between the mass and the luminosity under the form with .
The reflection component
We considered an infinite disc of neutral matter with solar abondances (
opacities given by Mor83 ), and hydrogen column density of
. We found that about 10 % of the total energy emitted
toward the disc is reflected and does not contribute to the disc heating.
However, the reflection component has important effects on the shape of the
observed spectrum. Due to the strong anisotropy of the primary source,
the ratio of the reflected to the primary component can be very high. The
spectrum strongly depends on the viewing angle with respect to
the disc normal. For nearly edge on inclinations, the reflection
contribution is weak. As the inclination decrease the reflection
component increase Mag95 . Conversely, the primary
spectrum decreases with decreasing . So that, for a face on
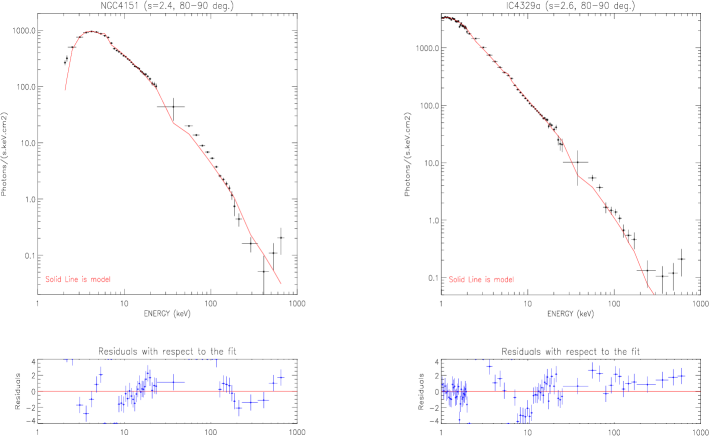
inclination, reflection dominates the hard X-ray spectrum. A rough
comparison to IC4329a and NGC 4151 spectra shows that
our model is reasonnably close to the data if the orientation is nearly
edge-on (cf. fig 4).
We can note that the anisotropic illumination model
predicts a weak UV component for high inclination angles which is in
qualitative agreement with the observed UV to soft X-ray luminosity ratio
in these two objects.
Acknowledgment : We are very grateful to A. Zdziarski for providing
us the NGC4151 and IC4329a data.
References
- (1) Collin-Souffrin S., Joly M., Disks and Broad line regions, In: Duschl W.J., Wagner S.J. (eds) Physics of AGN. Springer-Verlag, 1991, p. 195
- (2) Ghisellini G., George I.M., Fabian A.C., Done C., MNRAS 248, 14, (1991).
- (3) Henri, G., Petrucci, P.O., A&A in press
- (4) Madejski G.M. et al, ApJ 438, 672 (1995)
- (5) Magdziarz P. , Zdziarski A.A., MNRAS 273, 837 (1995)
- (6) Morrisson R., McCammon D.,ApJ 270, 119 (1983)
- (7) Nandra K., GeorgeI.M., Mushotzky R.F., Turner T.J., Yaqoob T., ApJ 477, 602 (1997)
- (8) Petrucci, P.O., Henri, H., A&A in press
- (9) Pounds, K. A., Nandra, K., Stewart, G. C., George, I. M., Fabian, Nature 344, 132 (1990)
- (10) Walter R., Fink, H.H., A&A 274, 105 (1993)
- (11) Zdziarski A.A., Johnson W.N., Magdziarz P., MNRAS 283, 193 (1996)