PLANETARY NEBULA ABUNDANCES, STELLAR YIELDS, AND THE GALACTIC EVOLUTION OF 12C AND 14N
Abstract
A project which aims to understand the abundance patterns of He, C, N, O, Ne, S, and Ar for a small sample of planetary nebulae is described. Abundance ratios of O/H, C/O, and N/O especially show a broad range relative to their solar values, and AGB stellar evolution models used to interpret the patterns indicate that reasonable ranges in progenitor mass and metallicity are adequate to explain the observed abundance spread. Chemical yields of intermediate-mass stars inferred from these same models are used to calculate chemical evolution models of the solar neighborhood. These models indicate that intermediate-mass stars account for roughly half of the 12C and almost all of the 14N in that region.
RESUMEN
A project which aims to understand the abundance patterns in He, C, N, O, Ne, S, and Ar for a small sample of planetary nebulae is described. Abundance ratios of O/H, C/O, and N/O especially show a broad range relative to their solar values and AGB models used to interpret the patterns indicate that progenitor ranges in mass and metallicity are adequate to explain the observed abundance ranges. Chemical yields of intermediate-mass stars are inferred from these same models and are used to calculate chemical evolution models of the solar neighborhood. These models indicate that intermediate-mass stars account for roughly half of the 12C and all of the 14N in that region.
Key words: ISM: ABUNDANCES — PLANETARY NEBULAE: GENERAL — STARS: EVOLUTION — GALAXY: ABUNDANCES
1 Introduction
Intermediate-mass stars (0.8M8.0M⊙; hereafter IMS) are thought to contribute significantly to the production of carbon and nitrogen in the Galaxy (Tinsley 1978; Sarmienta & Peimbert 1985). After stars within this mass range leave the main sequence, they pass through one or more stages when material synthesized during core and shell-burning is mixed into the outer envelope and subsequently expelled as a planetary nebula (PN) is formed. Numerous PN abundance studies indicate that mass fractions of He, C, and N are often enhanced relative to solar and interstellar values in these objects (Henry 1990; Perinotto 1991). The frequency of PN formation further implies that IMS may contribute significantly to the buildup of C and N in the Galaxy. Currently, we are attempting to quantify this picture by coupling detailed abundance studies of planetary nebulae with stellar and chemical evolution models.
Our PN abundance study focuses on a small number of carefully chosen galactic objects for which spectral information is available between 1150-9600Å. Abundances of He, C, N, O, Ne, S, and Ar are determined through a detailed analysis. The aim of the stellar evolution study is to interpret PN abundance patterns by calculating models of thermally pulsating asymptotic giant branch (AGB) stars as well as the chemical composition of their ejecta as they produce PNe. In the process, yields (production rates) of elements such as C and N are inferred from the models. These yields in turn are employed in chemical evolution models to understand the sources of carbon and nitrogen in the solar neighborhood. In this paper, we provide an update of the project along with some preliminary results. Sections 2, 3, and 4 describe the three phases of the project, while section 5 is a summary.
2 Planetary Nebula Abundance Study
We have chosen for our study 22 PNe to span wide progenitor mass and metallicity ranges. Inferring abundances of the elements listed above requires that we have spectral coverage both in the UV and optical. UV spectral data are taken from the IUE Final Archive, a repository for data which have recently been re-reduced using standardized reduction algorithms that have resulted in improved spectral resolution and S/N. We then combine the UV data with optical spectra available in the literature or (lately) spectra we have acquired ourselves. We are currently working to extend spectral coverage for all of our objects out to around 9600Å. When completed, we will have spectra available from 1150 to 9600Å for each of our objects.
Prior to performing an abundance analysis, we correct the spectra for effects of interstellar reddening and then merge the UV and optical data using line ratios comprised of lines occuring in each of the two spectral regions and whose values can be predicted from theory. Two ratios we have found useful for this purpose are He II 1640/4686 and C III] 1909/C II 4267.
The abundance of an element is then determined using the relation:
where is the measured intensity of a spectral feature produced by an ion of element , is the energy production rate per ion of the spectral feature . Quotients for all observable ions are summed together. Then, is the ionization correction factor, i.e. the ratio of the sum of abundances of all ions to the sum of observed ions of , and
The factor is determined by first calculating a detailed photoionization model to reproduce the observed values of numerous diagnostic line ratios which are sensitive to physical conditions along the line-of-sight, and then applying a modified version of the above abundance method to the output spectrum of a photoionization model to determine an “apparent” abundance. Then, by comparing this quantity with the “true” model input value for the same element, is obtained.
Results for the 16 objects analyzed thus far are presented in Fig. 1, where we plot values of He/H, O/H, C/O, N/O, and Ne/O, all normalized to the sun (linear scale for He/H; logarithmic scale for all others). Work on S and Ar abundances is currently in progress, and results for these are not included here. Abundance ratios for sample PNe are indicated with open circles. Local interstellar values from Snow & Witt (1996) are shown with plusses. Because of the difficulty of showing detailed abundance information for individual objects in a plot such as this, we refer the reader to our papers where these results are presented in more detail: Henry, Kwitter, & Howard (1996), Kwitter & Henry (1997), and Kwitter & Henry (1998). What we wish to point out here is the broad range in abundances which is apparent among the 16 PNe. For example, C/O and N/O for our sample span roughly 3 and 2 orders of magnitude, respectively. We want to emphasize that this scatter is for the most part real and cannot be explained by abundance uncertainties from the procedure itself, which are roughly 0.3 dex. Understanding this variation in abundance is one of the principal goals of the stellar evolution models described in the next section.
3 AGB Models
Intermediate-mass stars go through as many as three important stages in their post main sequence evolution which result in synthesized material from their interiors being brought to the surface and eventually expelled by wind or during PN formation. These stages are:
-
•
1st dredge-up, which occurs during the red giant phase when convection reaches into the H-exhausted core, bringing up 4He and 14N.
-
•
2nd dredge-up, which occurs in stars of M5M⊙, early in the AGB phase, when additional 4He and 14N are brought up.
-
•
3rd dredge-up, which occurs during the thermally pulsing AGB phase when convection associated with the interpulse phases reaches into the He-burning shell, bringing up triple-alpha products. Subsequent burning can also occur at the base of the convective envelope when 12C is converted to 14N and 22Ne, a process known as hot bottom burning.
Thermally pulsing AGB models have been computed by J. Buell as part of his PhD thesis research at the University of Oklahoma. Buell has acquired the code used in Renzini & Voli (1981) and made significant updates, including the introduction of an Ṁ-period relation and the opacities of Rogers & Iglesias (1992). The code assumes a set of envelope abundances from first and second dredge-ups and proceeds to calculate a model of a thermally pulsing AGB envelope which includes the effects of 3rd dredge-up and hot bottom burning. The calculation follows the evolution of 4He, 12C, 13C, 14N, and 16O during each interpulse, eventually predicting the masses of these isotopes which are lost due to winds or ejected during PN formation. The predicted PN abundances are then compared with abundances inferred from observations, as described in the previous section.
Results of Buell’s study are presented in Buell (1997). Briefly, the models explain the large range in abundances shown in Fig. 1 as being due to ranges in progenitor mass and metallicity. Buell’s models also predict a set of chemical yields which are used in the next section to estimate the contribution of IMS to the chemical evolution of 12C and 14N in the solar neighborhood.
4 Chemical Evolution of 12C and 14N
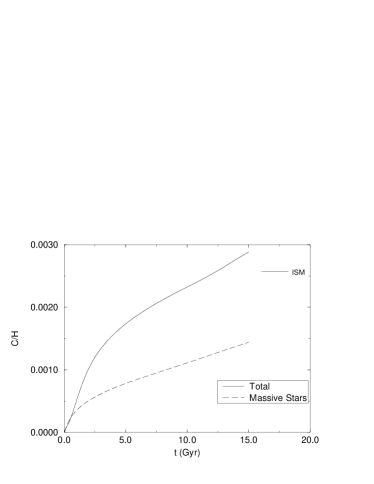
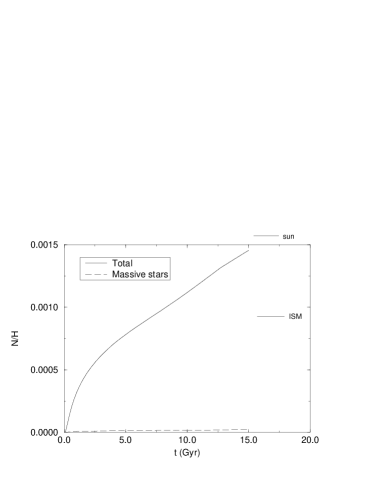
We have calculated evolution models for 12C and 14N for the solar neighborhood following prescriptions described in detail by Timmes et al. (1995). Our models take account of production time delays due to the significant main sequence life times of IMS, i.e. instantaneous recycling is not assumed. In addition, we assume a star formation rate (SFR) such that where and are total and gas mass, respectively. An infall rate was assumed to be exponentially decreasing with time, with a characteristic time scale of 4 Gyr. The age of the Galaxy was taken to be 15 Gyr. IMS yields were taken from Buell (1997) while yields for massive stars (M13M⊙) and Type Ia supernovae were taken from Nomoto (1997a,b).
The chemical evolution model results for 12C and 14N are presented in Fig. 2, where the mass ratios of C/H and N/H are plotted versus time in Gyr. Total mass ratios as well as contributions from massive stars only are represented with bold and dashed lines, respectively. The model results indicate that intermediate-mass and massive stars contribute equally to the buildup of 12C. However, IMS are apparently responsible for most of the 14N in the solar neighborhood. These results will be presented in greater detail in a future paper.
5 Summary
Careful abundance analysis of a small sample of planetary nebulae reveals large and real scatter in abundance ratios He/H, O/H, C/O, and N/O. Using detailed AGB models calculated with a newly-updated code, this scatter is in turn explained by broad ranges in mass and metallicity of the progenitor stars. Carbon and nitrogen yields inferred from these same models are employed in chemical evolution models to show that IMS produce most of the nitrogen and roughly half of the carbon in the solar neighborhood.
REFERENCES
Anders, E., & Grevesse, N. 1989, Geochim. Cosmochim. ACTA, 53, 197
Buell, J. 1997, PhD thesis, University of Oklahoma
Henry, R.B.C. 1990, ApJ, 356, 229
Henry, R.B.C., Kwitter, K.B., & Howard, J.W. 1996, ApJ, 458, 215
Kwitter, K.B., & Henry, R.B.C. 1997, ApJ, 473,304
Kwitter, K.B., & Henry, R.B.C. 1998, ApJ, submitted
Nomoto, K. 1997a, Nucl. Phys. A, A616, 79c
Nomoto, K. 1997b, Nucl. Phys. A, in press
Perinotto, M. 1991, ApJS, 76, 687
Renzini, A., & Voli, M. 1981, A&A, 94, 175
Rogers, F.J. and Iglesias, C.A. 1992, ApJS, 79, 507
Sarmiento, A., & Peimbert, M. 1985, Rev. Mexicana Astron. Af., 11, 73
Snow, T.P., & Witt, A.N. 1996, ApJ, 468, L65
Timmes, F.Q., Woosley, S.E., & Weaver, T.A. 1995, ApJS, 98, 617
Tinsley, B.M. 1978, in IAU Symp. 76, Planetary Nebulae (Dordrecht:Reidel), 341