Galaxy clusters in the Perseus–Pisces region —
II.
The peculiar velocity field
Abstract
We have measured the mean peculiar motions of 103 early-type galaxies in 7 clusters in the Perseus–Pisces (PP) ridge or PP background, and a further 249 such galaxies in 9 calibrating clusters from the literature, using the inverse Fundamental Plane relation. This relation is found to have a distance error of 20% per galaxy. None of the 6 clusters in the PP ridge has a significant motion with respect to the cosmic microwave background (CMB) frame, but the PP background cluster J8 shows marginal evidence of ‘backside infall’ into the PP supercluster. We find that the full 16 cluster sample has a mean CMB-frame bulk motion of km s-1 towards , . This result is consistent both with no bulk motion in the CMB frame and with the km s-1 bulk motion found by Courteau, Faber, Dressler and Willick. It is inconsistent at the 98% confidence level with the km s-1 bulk flow found by Lauer & Postman. The PP ridge clusters are found to have a small and statistically insignificant mean radial motion with respect to the CMB frame: km s-1. Our error analysis fully accounts for the uncertainties in the mean Hubble flow, as well as the errors due to the merging of different spectroscopic datasets. A comparison between our cluster peculiar velocities and the predicted peculiar velocities from the IRAS 1.2 Jy density field, smoothed on a 500 km s-1 scale, yields , consistent with previous results. We find agreement between our peculiar motions and published Tully-Fisher results for the same clusters. The disagreement between the 11 clusters common to our sample and that of Lauer & Postman, based on brightest cluster galaxies (BCGs), is statistically significant at the % confidence level indicating that the errors of one or both of these data sets are underestimated. When the BCG distances corrected for the X-ray luminosity of the host cluster are used, the disagreement is reduced to the 94% confidence level.
keywords:
galaxies: distances and redshifts — galaxies: elliptical and lenticular, cD — galaxies: clusters: general — cosmology: observations — large-scale structure of Universe1 Introduction
The two dominant concentrations of galaxies in the nearby Universe are the Great Attractor (hereafter GA) supercluster complex and the Perseus–Pisces (hereafter PP) supercluster. The GA appears to be extended along the line of sight at , , with its densest region at and behind the Centaurus cluster in the distance range – km s-1 (Hudson 1993). On the opposite side of the sky, the main ridge of PP is extended perpendicular to the line of sight with km s-1 (Giovanelli and Haynes 1985; Wegner, Haynes and Giovanelli 1993). The only way to measure the distribution of mass on these large scales is by measuring the peculiar velocities of galaxies and of clusters of galaxies.
Studies of the peculiar flow field around these dominant concentrations can be traced from Shaya (1984) and Tammann & Sandage (1985) who found that, after having accounted for Virgo infall, nearby galaxies showed a residual motion with respect to the frame of the Cosmic Microwave Background (hereafter CMB) in the direction of Hydra-Centaurus. A tidal shear of the flow field in this direction was also noted by Lilje, Yahil & Jones (1986). Strong infall into a Great Attractor behind the Centaurus cluster at km s-1 was first claimed by Lynden-Bell et al. (1988). While it is now evident that there is a strong streaming motion of galaxies in the direction of Centaurus, it remains unclear whether this motion is generated locally, e.g. by Centaurus or the GA, or whether it is due to more distant sources. For example, the claim by Mathewson, Ford and Buchhorn (1992) that ‘backside infall’ is not observed behind the Great Attractor, argues for coherent streaming motions generated at very large distances.
In practice, the flow field is likely to be complex, being dominated by attractors and voids on a range of scales. Nevertheless, to first order, the mean motion of the PP supercluster allows a test of whether the flow is due to local or distant sources since, in combination with peculiar velocity data near the GA, both the bulk motion and the shear of the peculiar velocity field can be measured. If the large bulk motion of nearby galaxies is due to local sources, then the peculiar velocity of PP will be small: . Alternatively, if the source of the motion is more distant, then PP should participate in a large-scale coherent bulk flow and have a peculiar velocity of km s-1 with respect to the CMB.
Previous work on the motion of PP has been based mainly on the spiral galaxy Tully-Fisher (TF) relation, the PP region not being well-sampled in the elliptical galaxy survey of Faber et al. (1989). Willick (1990, 1991), reported a mean radial motion of km s-1 for PP field spirals with redshifts 3800 6000 km s-1 based on r-band TF data. The small quoted error on this result includes only the random error from the TF scatter. The result is subject also to a systematic calibration error of 2%, or 100 km s-1 at PP (Willick 1991). Courteau et al. (1993) added further r-band TF data and found that the PP region participated in a uniform bulk flow of km s-1 towards , . Using I-band TF peculiar velocities of clusters in PP, Han & Mould (1992, hereafter HM) claimed a motion of –400 km s-1. In contrast, the recent TF field survey of Giovanelli et al. (1996; da Costa et al. 1996) indicates no net motion of PP.
The PP supercluster is at least as overdense in galaxies if not more so than the GA (Saunders et al. 1991; Hudson 1993; Strauss & Willick 1995). If PP is as massive as implied by its overdensity in galaxies, then strong infall of galaxies into the PP supercluster is predicted. The infall signature is difficult to detect unambiguously using field samples because individual galaxies scatter out of the filament, creating a spurious infall signature. This inhomogeneous Malmquist bias (Hudson 1994a; Dekel 1994) is particularly severe in the PP region due to the sharpness of the density contrast between the supercluster filament and the foreground and background voids. While cluster distances are far less severely affected by Malmquist biases, the clusters typically reside along the ridge line of the PP filament itself, so that they are not efficient tracers of the infall pattern.
In this paper, we use the Fundamental Plane (hereafter FP) distance indicator to measure the peculiar velocities of early-type galaxies in clusters in and behind the PP filament. The use of a cluster sample minimises the Malmquist bias problems which plague field samples (Strauss & Willick 1995). Furthermore, since the cores of clusters are rich in early-type galaxies, cluster-elliptical samples are less prone to contamination than spiral samples.
The outline of this paper is as follows. In Section 2, we discuss the cluster and galaxy samples. In Section 3, we derive the FP relation for our combined data sample. In Section 4, we present the distances and peculiar velocities of individual clusters, and in Section 5 we model the flow field and measure the bulk motion of the sample and the mean flow of the clusters in the PP filament. Section 6 discusses potential systematic effects. In Section 7 we compare our results to previous work. Finally, in Section 8 the paper is summarized.
Note that distances – either the estimated distance or the true position – are quoted in units of km s-1. Radial peculiar velocities, , are with respect to the CMB frame unless otherwise noted.
2 Data
The principal goal of this work is to determine the motion of the PP supercluster and compare this motion with the predictions of flow models. In order to derive distances to the PP clusters we must adopt a distance indicator zero-point. The approach often used is to adopt one cluster, usually Coma, as a calibrator which is assumed to be at rest with respect to the CMB. However, individual clusters will have peculiar velocities with respect to the CMB of order km s-1 (Grammann et al. 1995). For the case of Coma, this would translate to a zero-point uncertainty of 4%, and hence to an uncertainty of km s-1 in any derived motion of the PP supercluster. In order to reduce this uncertainty, we use here a set of clusters as calibrators and simultaneously fit for the distance indicator zero-point and a flow model. To break the degeneracy between the zero-point and a bulk motion, we require a sample of clusters with good sky coverage.
In Smith et al. (1997, hereafter PPI), we reported the spectroscopy and R-band photometry for early-type galaxies in seven clusters in the PP region. This includes the six clusters (7S21, Pisces, HMS0122, A262, A347 and Perseus[A426]) in the PP ridge ( km s-1) and the background cluster J8 at km s-1. Our ‘calibration’ clusters are from the published studies of Lucey and collaborators (Lucey & Carter 1988, hereafter LC88; Lucey et al. 1997, hereafter LGSC) and Jørgensen, Franx & Kjærgaard (1995a, 1995b, 1996, hereafter JFK95a, JFK95b, JFK96). We exclude the poor clusters from these studies, i.e. Pavo II, S639, S753, Doradus(Grm13) and Grm15. The Centaurus cluster is also excluded. Centaurus has a complicated internal structure, i.e. the Cen30 and Cen45 components, and is located in the GA foreground, so that it is not likely to be a good calibrator. This culling restricts our calibration sample to nine clusters, viz. A194, A539, Hydra(A1060), Coma(A1656), A2199, A2634, A3381, A3574(K27) and DC2345-28(A4038K44). Details of all 16 clusters considered here, including the data sources used, are given in Table 1. Note that in our analysis, we solve for the distances of all 16 clusters simultaneously and hence the term ‘calibration sample’ is somewhat artificial.
| Cluster | n | Subsample | Spec. | Phot. | Band | |||||
|---|---|---|---|---|---|---|---|---|---|---|
| 7S21 | 7 | 113.8 | -40.0 | 5860 | 5517 | 189 | PP ridge | PPI | PPI | Kron-Cousins R |
| Pisces | 25 | 126.8 | -30.3 | 5011 | 4714 | 100 | PP ridge | PPI | PPI | Kron-Cousins R |
| HMS0122 | 9 | 130.2 | -27.0 | 4914 | 4636 | 167 | PP ridge | PPI | PPI | Kron-Cousins R |
| A262 | 10 | 136.6 | -25.1 | 4782 | 4528 | 158 | PP ridge | PPI | PPI | Kron-Cousins R |
| A347 | 8 | 140.7 | -18.1 | 5528 | 5312 | 177 | PP ridge | PPI | PPI | Kron-Cousins R |
| Perseus | 31 | 150.5 | -13.7 | 5202 | 5040 | 245 | PP ridge | PPI | PPI | Kron-Cousins R |
| J8 | 13 | 150.3 | -34.4 | 9664 | 9425 | 177 | PP backgd. | PPI | PPI | Kron-Cousins R |
| A2199 | 36 | 62.9 | 43.7 | 8922 | 8947 | 106 | Calib. | LGSC | LGSC | V |
| A2634 | 35 | 103.5 | -33.7 | 9505 | 9158 | 132 | Calib. | LGSC | LGSC | V |
| Coma | 71 | 57.6 | 88.0 | 6931 | 7200 | 113 | Calib. | LGSC | LGSC | V |
| A194 | 19 | 142.2 | -62.9 | 5428 | 5122 | 115 | Calib. | LC88/JFK95b | JFK95a | Gunn-r |
| A539 | 22 | 195.6 | -17.6 | 8612 | 8615 | 190 | Calib. | JFK95b | JFK95a | Gunn-r |
| A3381 | 14 | 240.3 | -22.7 | 11369 | 11471 | 134 | Calib. | JFK95b | JFK95a | Gunn-r |
| A3574 | 7 | 317.4 | 31.0 | 4604 | 4873 | 189 | Calib. | JFK95b | JFK95a | Gunn-r |
| DC2345-28 | 27 | 25.3 | -75.8 | 8772 | 8473 | 148 | Calib. | LC88 | JFK95a | Gunn-r |
| Hydra | 18 | 269.6 | 26.5 | 3632 | 3976 | 152 | Calib. | LC88/JFK95b | JFK95a | Gunn-r |
For the Coma, A2199 and A2634 clusters, we use the spectroscopic and V-band photometric data as tabulated in LGSC. The spectroscopic data is from several systems, including a few measurements from our PP runs, but excludes the erroneous ‘FLEX’ velocity dispersion data of Lucey et al. (1991). The data for the remaining 6 rich clusters are from LC88 and JFK. For these six clusters we take the spectroscopic measurements of LC88 and JFK95b, and the photometry from JFK95a’s r-band measurements. Our full sample consists of 352 galaxies in 16 clusters.
All spectroscopic data have been corrected for aperture effects following JFK95b and brought onto a common system using the derived offsets and weightings given in PPI. The effective surface brightnesses, , are k-corrected, corrected for surface brightness dimming and for Galactic extinction. For the latter, we use the Burstein & Heiles (1982) values of multiplied by the factors 2.35, 3.02 and 2.50 to obtain extinctions in the R, V and Gunn r bands, respectively. Surface brightnesses are transformed from the V and Gunn-r bands to the Kron-Cousins R band by subtracting 0.57 magnitudes and 0.33 magnitudes respectively (see PPI). Uncertainties in these transformations introduce only 0.5% distance errors and so are neglected.
From all sources, we exclude galaxies with morphological type S0/a and later or which are classified as morphological rejects (type R) in PPI. The following background galaxies were also excluded: A01094 in A262 ( km s-1), ZH56 in A194 ( km s-1) and RMH30 in Hydra ( km s-1). Finally, the galaxies RB28 in A2199, B03C in A347 and R338 in Hydra are outliers (at the level) in the FP relation found below. They are excluded from the analysis in this paper.
The recession velocity adopted for each cluster is the mean redshift of the observed sample of galaxies in the cluster. In Table 1, the parameter gives the error in the mean sample redshift, where is set to 500 km s-1 for clusters with members, and is set to the measured cluster dispersion or 500 km s-1, whichever is larger, for clusters with . We find that our mean sample redshifts and published mean redshifts for the same clusters agree to within .
3 The Fundamental Plane
The methodology adopted in this paper is to fit cluster FP relations a priori without the use of redshift information, then to convert the cluster zero-points into cluster distances and finally to fit flow models a posteriori. Following Strauss & Willick (1995), we refer to this procedure as ‘Method I’. In this section we describe the FP fits. The Malmquist bias corrections and cosmological corrections needed to transform the FP zero-points into cluster distances are deferred to Section 4.
3.1 Method of fit
The Fundamental Plane can be described by either a ‘forward’ or an ‘inverse’ fit, depending on whether the slopes are obtained by regressing on the distance dependent parameter — the logarithm of the effective radius, — or by regressing on the distance independent parameter, . Note that, in the inevitable presence of selection effects and scatter, the slope of the inverse relation is not simply the inverse of the forward relation slope.
Galaxies in cluster samples are typically selected according to their morphological properties and either surface brightness, magnitude, diameter or some combination of these. The inverse relations have the advantage that they are unbiased by selection on the dependent variables. For the FP, this means that any selection in , or any function of these quantities (e.g. total magnitude) will not bias the inverse FP fit.
For the PP clusters, galaxies were selected from photographic plates, and are limited by APM or GSC photographic magnitudes. From the candidate lists, spectra were obtained typically from brightest galaxy on down. There are, however, cases were the photographic magnitude was re-estimated by eye (e.g. due to contamination by a nearby star or galaxy) or where fainter galaxies were preferentially observed because they could be placed on the same spectrograph slit as a brighter galaxy. Therefore, the selection criteria are likely to be somewhat fuzzy and are difficult to quantify precisely. As a result it is difficult to apply the forward-relation bias-correction scheme described by Willick (1994). Because the inverse distance indicator relations are insensitive to photometric selection, we shall consider only the inverse FP distance indicator in this paper. Of course the inverse relation is sensitive to explicit selection on velocity dispersion, but such selection is not present in our sample because we have not thrown out any galaxies a posteriori based on their velocity dispersions. There is one exception to this rule: the Coma sample of LGSC explicitly excludes all galaxies with km s-1. For this cluster we make a bias correction for the cut which is exactly analogous to the bias correction prescription of Willick (1994) for the calibration of the forward Tully-Fisher relation from a magnitude-limited sample of cluster galaxies. In practice, this correction has only a very small effect due to the large range of in the Coma sample.
The inverse FP relation used here is:
| (1) |
We minimise the residuals over the galaxies in all clusters simultaneously, assuming the same slopes (, )111Our definition of differs by a factor –2.5 from that of JFK96. Here is the coefficient of whereas for JFK96 it is the coefficient of for all clusters but allowing individual zero-points () for each cluster to vary independently. In order to determine the errors on the zero-points, the slope of the FP relation are held fixed. Note that our slopes, derived from an inverse fit, will not be the same as those obtained from the “orthogonal fit” of JFK96.
3.2 Results of FP fits
| FP | ||
| – | ||
| 0.062 | 0.065 | |
| 0.198 | 0.213 |
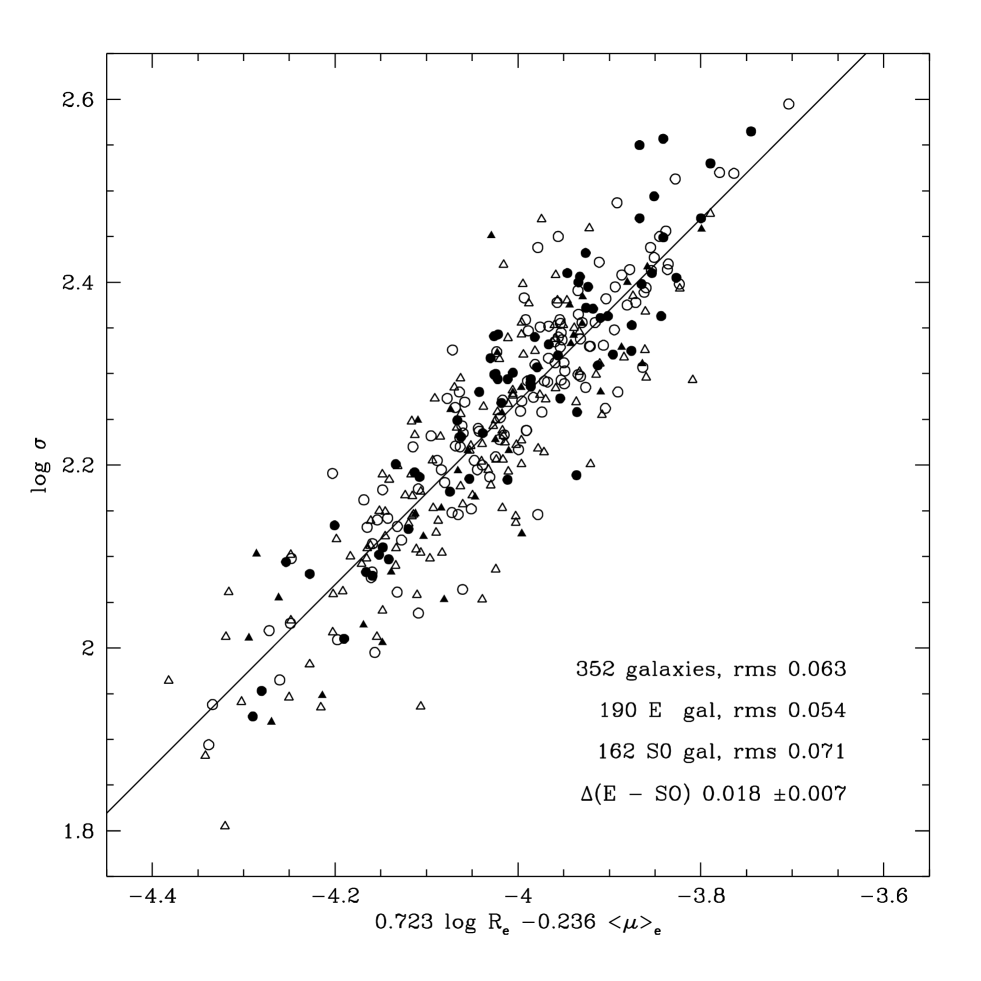
The FP relation for the 16 cluster sample is shown in Fig. 1. Here, the mean CMB redshifts of the clusters have been used to shift all galaxies to the distance of the Coma cluster.
Table 2 gives the slopes, scatter in velocity dispersion, , and the fractional inverse distance error, , for the FP relation. Note that the distance error per galaxy is larger than that found from the orthogonal fits of JFK96, through the influence of the larger slope, . For comparison, we give also the slope and scatter of the inverse relation, for the same data. This distance indicator has slightly larger scatter than the FP, and is not used in the analysis to follow.
Figures 2–3 show the data for each cluster in separate panels. The solid line shows the distance indicator relation using the slope derived from all galaxies. The dotted line shows the median fit to the residuals. The difference between the mean and median zero-point is always , with the exception of A262 for which they differ at the level. The scatter around the mean (solid) line is indicated in the lower right-hand corner of each panel. The individual cluster scatters are all consistent with the global scatter, with the exception of Coma, the scatter for which is marginally smaller: 0.046 versus the global scatter 0.062. This difference is only marginally significant (at the % confidence level). Note that since Coma is traditionally the standard cluster for FP/ studies, its galaxies have been observed many times. Thus their mean velocity dispersions will have smaller random errors than galaxies in less frequently observed clusters. The dashed line in each panel shows the individual fit with free slope to the cluster in question. The slopes (relative to the slope of best fit) are given in the top left hand corner. None of these slopes are significantly different from unity, except for Pisces, for which the difference is marginal ().


4 Distances and Peculiar velocities
4.1 Bias corrections
We argued in Section 3 that the inverse fits were insensitive to selection on , or functions thereof. As discussed above, we perform in this paper a Method I peculiar velocity analysis. Whenever a Method I procedure is used, the distances will be affected by Malmquist bias, which depends on the density field of the peculiar velocity tracer population, before selection. For a Method I analysis using forward distance indicator relations, this would be the only source of bias. In contrast, a Method I analysis using inverse relations is affected, in general, both by Malmquist bias and by ‘object selection bias’. For samples of field galaxies, the object selection bias is strong, particularly at the distance where the selection function peaks and beyond. For samples consisting of rich clusters, as is the case here, the probability that an entire cluster will drop out is a very weak function of distance and hence the object selection bias is negligible, leaving only the Malmquist bias. For further discussion of these issues the reader is referred to Strauss & Willick (1995).
One of the advantages of a cluster sample is that the corrections for Malmquist bias are smaller than for field galaxies. The fractional distance error for each cluster is , where is the number of observed galaxies in the cluster. The homogeneous Malmquist correction, which assumes that the underlying density field of clusters is uniform, is a multiplicative factor . For our sample, the largest homogeneous Malmquist correction is 2% (or km s-1 at the distance of the PP ridge) for the cluster 7S21 which has 7 observed members. The correction for the Perseus and Pisces clusters, which dominate the flow by virtue of their small random errors, is only or km s-1. The correction due to the fact that the underlying cluster density field is inhomogeneous (Hudson 1994a; Dekel 1994; Strauss & Willick 1995) is expected to be smaller than the homogeneous Malmquist correction, which itself is quite small, as demonstrated. We therefore neglect the inhomogeneous correction in this paper.
4.2 Distance calibration
In order to obtain cluster distances, we shall initially fix the distance and peculiar velocity of Coma to be 7200 km s-1 and zero, respectively, and calculate cluster distances relative to Coma. In the flow model fits to follow, we will allow this zero-point to be rescaled by a free parameter. We shall see below that this free parameter is close to unity, thus justifying our calibration a posteriori.
The difference between the zero-point of a cluster and that of Coma is the logarithm of relative apparent angular diameters of galaxies (at the same ). We iteratively solve the angular diameter distance equation with in order to convert the zero-point offsets to distances, i.e. the that the cluster would have if it were following the Hubble flow. For , the distance of clusters in the PP ridge changes by only 10 km s-1.
4.3 Results
| Cluster | ||||||
|---|---|---|---|---|---|---|
| km s-1 | km s-1 | km s-1 | km s-1 | |||
| 7S21 | 5517 | 5448 | 409 | 69 | 450 | -201 |
| Pisces | 4714 | 4583 | 182 | 131 | 208 | 108 |
| HMS0122 | 4636 | 4680 | 310 | -44 | 352 | 159 |
| A262 | 4528 | 4787 | 300 | -259 | 340 | 226 |
| A347 | 5312 | 5589 | 392 | -277 | 430 | -210 |
| Perseus | 5040 | 5176 | 185 | -136 | 307 | 180 |
| J8 | 9425 | 10457 | 576 | -1032 | 602 | -706 |
| A2199 | 8947 | 9289 | 307 | -342 | 325 | -29 |
| A2634 | 9158 | 10118 | 339 | -960 | 364 | -127 |
| Coma | 7200 | 7200 | 170 | 0 | 204 | -64 |
| A194 | 5122 | 4379 | 199 | 743 | 230 | 295 |
| A539 | 8615 | 8381 | 355 | 234 | 403 | 644 |
| A3381 | 11471 | 10893 | 578 | 578 | 593 | -80 |
| A3574 | 4873 | 4218 | 316 | 655 | 369 | -126 |
| DC2345-28 | 8473 | 8647 | 330 | -174 | 362 | -129 |
| Hydra | 3976 | 3946 | 185 | 30 | 239 | 147 |
The Malmquist-corrected FP distances, , and radial peculiar velocities, , are given in Table 3. The distance error, , is due to the error in fitting the zero-point. The peculiar velocity error, , is the distance error added in quadrature with the cluster mean redshift error, .
Figures 4 and 5 show the CMB redshifts and the FP-inferred distances of individual galaxies in each cluster. Note that there is no tendency for galaxies to lie along the Hubble line, in contrast with some spiral-cluster samples (Willick et al. 1995). By observing early-type galaxies, we have efficiently selected galaxies in the virialized cluster cores.
The Hubble diagram for all 16 clusters in shown in Fig. 6. Note that most clusters have a peculiar velocity in the CMB frame which is not different from zero by . The exceptions are A2634 and A194.


Figures 7 and 8 show the flow field of the PP clusters studied here. The large circles show the FP distance to each cluster, while the tip of each arrow lies at its mean redshift in the CMB frame. The length of the vector thus gives the peculiar velocity. The horizontal lines bracketing each cluster position indicate the distance errors. The small points are plotted at the (redshift-space) positions of galaxies from the CfA ZCAT compilation (Huchra et al. 1993), and are shown to illustrate the PP structure as traced by galaxies. It is clear from these figures that the mean CMB-frame motion of the PP ridge is small, and that the motion of PP ridge clusters with respect to the mean motion of the ridge is quiet. Note also that the cluster J8 shows some evidence of backside infall into the PP supercluster.
5 The flow field
5.1 Flow models
In order to model the peculiar velocities, we will consider flow models composed of a combination of pure Hubble flow, a uniform bulk flow and/or the peculiar velocity predicted from the IRAS 1.2Jy redshift survey (Fisher et al. 1995a).
In order to allow for a possible ‘thermal’ component in the peculiar velocity of Coma, our adopted calibrating cluster, we allow the zero-point of the distance scale to float by including a monopole (or Hubble) term
| (2) |
The bulk flow is modelled as a uniform dipole motion, independent of distance: .
If light traces mass, then the most reasonable flow models are those in which the galaxy density field is used to predict peculiar velocities. There is usually one free parameter for these models, . This allows us to fit a degenerate combination of , which affects the peculiar velocity field for a given mass fluctuation field, and the biasing parameter which relates the observed density fluctuation field of galaxies to that of the mass. Note that different tracers of the galaxy density field (e.g. IRAS galaxies versus optically-selected galaxies) will have different bias parameters and hence different values of .
In this paper, we use predicted peculiar velocities derived from the IRAS 1.2 Jy redshift survey density field, which was kindly provided to us by M. Strauss. The IRAS density field extends to 12000 km s-1, which allows us to make predictions for all of the clusters in our sample222All-sky density fields of optical galaxies (e.g. Hudson 1993; Santiago et al. 1995 ) are not sufficiently deep for our purposes.. Rich clusters of galaxies have collapsed from scales , so we expect that their peculiar velocities are accurately described by the predictions of linear theory:
| (3) |
where is the IRAS density fluctuation field, smoothed with a 500 km s-1 radius Gaussian filter and processed with a Weiner filter in order to reduce the effects of shot noise. The smoothing scale is approximately equivalent to an 8Mpc top-hat, and so is a good match to the scale from which the clusters collapsed. Note that linear theory has been used to transform iteratively the IRAS galaxy positions from redshift space to real space. The adopted for this iterative scheme is , which is not significantly different from the value obtained from fits to our peculiar velocity data below. Note that the effect of the used in the redshift-to-real space iteration procedure on the derived is typically very small (Hudson 1994b; Hudson et al. 1995).
Errors in the IRAS predicted peculiar velocities can be estimated from the results of Fisher et al. (1995b). Those authors generated mock IRAS 1.2 Jy surveys from N-body simulations. Although they used a different redshift-to-real space reconstruction scheme (based on a spherical harmonic decomposition), in common with the case here they also used the Weiner filter to suppress shot noise. We therefore expect their IRAS predictions to have similar error properties to those used here. Fisher et al. estimated that the errors in the IRAS-predicted radial peculiar velocities of individual galaxies were km s-1 within 6000 km s-1, growing to approximately 250 km s-1at 11000 km s-1. We expect that the errors for predicted peculiar velocities of clusters should be somewhat smaller than these values.
In general, the predicted peculiar velocity is then
| (4) |
Note that for those cases in which we use the IRAS predictions as part of the flow model, should be interpreted not as the mean bulk flow of the sample, but as a residual bulk flow due to mass fluctuations beyond the limit of the IRAS density field.
Given the model predictions at the estimated distances of each cluster, we minimise, with respect to the free parameters , and , the statistic
| (5) |
where allows for an additional ‘thermal’ peculiar velocity of the cluster with respect to the flow model. We set km s-1, so that the reduced values are approximately unity. Note that we neglect errors in the IRAS predicted peculiar velocities, but these are expected to be km s-1. The error in the measured radial peculiar velocity is typically twice this value; we therefore expect that the derived will not be significantly biased if errors in the IRAS predictions are neglected.
The formal random errors are obtained from the covariance matrix in the usual way. This procedure, however, neglects an important source of error, namely the systematic effects introduced by errors in matching the different velocity dispersion systems. In PPI, we determined the corrections which were applied to the raw measurements to bring them onto a common system, and described the bootstrap resampling method which was used to determine the uncertainty in these corrections. In order to quantify the effect that these uncertainties have on our results, we perform the following procedure. For each of 200 bootstrap samples, we obtain a realization of offsets. These are then used to generate new merged spectroscopic data sets for the 352 galaxies in this paper. The new data are then passed through the flow analysis above. In this way, we determine the covariance matrix which is due solely to system matching errors. This covariance matrix is then added in quadrature to the random error covariance matrix to obtain the total error covariance matrix. The bulk motion errors quoted in the following subsection include these systematic contributions.
5.2 Results
| Row | /d.o.f. | |||||
|---|---|---|---|---|---|---|
| 1 | 0.00 | 262.6 | -25.3 | 15.51/12 | ||
| 2 | 0.00 | 0.000 | 264.7 | -25.5 | 15.52/13 | |
| 3 | 313.2 | -26.4 | 11.63/11 | |||
| 4 | 0.000 | 312.7 | -26.5 | 11.63/12 |
| Row | |||||||||||
|---|---|---|---|---|---|---|---|---|---|---|---|
| 1 | 310.7 | 50.7 | 264.6 | -29.5 | 188.7 | 23.4 | 2.27 | 0.52 | |||
| 2 | 312.7 | 46.9 | 288.3 | -40.5 | 209.1 | 12.4 | 2.47 | 0.48 | |||
| 3 | 305.9 | 51.0 | 281.4 | -36.4 | 20.5 | -12.1 | 2.01 | 0.57 | |||
| 4 | 308.2 | 47.2 | 294.8 | -42.0 | 30.9 | -6.7 | 2.42 | 0.49 |
We fit the bulk flow and IRAS-predicted flow models to two samples of clusters: the full sample of 16 clusters, and the 6 PP ridge clusters alone. Table 4 lists the values of , and the amplitude and direction of bulk flow for the full cluster sample. For the first two parameters, entries without a quoted error indicate that the value was held fixed in the fit. The of the fits and the number of degrees of freedom are given in the last column.
When the covariance matrix of the bulk flow components is diagonalized, we find that one direction has much smaller errors than the others. Hereafter this direction will be referred to as the DME for “direction of minimum error”. This effect occurs because the fits are dominated by the PP clusters, which are concentrated in a small patch on the sky. The rows of Table 5 give, for each solution in the corresponding row in Table 4, the directions of the three eigenvectors of the covariance matrix and the projections of the bulk motion along the these directions. The last columns give the significance of bulk flow compared with zero: (to be compared with three degrees of freedom) and the corresponding probability that the there is no bulk motion in the CMB frame. The first eigenvector, denoted by the subscript “1” is the DME. For the full cluster sample, the DME is , , which is within 20° of the of the bulk motion found by Lauer & Postman (1994, hereafter LP) and is close to the directions of the GA (Faber & Burstein 1988) and the Shapley Concentration (Raychaudhury 1989). Thus, despite the large errors in the other eigendirections, this sample can be used to test the predictions of a number of interesting flow models.
The first row of Table 4 indicates that the mean bulk motion of the entire sample with respect to the CMB frame is km s-1 towards , , which is not significantly different from zero.
The fits with a free Hubble term, , (Rows 1 and 3 in Table 4) indicate that the best fitting is very small and consistent with zero. Thus, by chance, it would appear that Coma has a small peculiar velocity with respect to the best fitting flow model. We therefore fix for the fits to the PP ridge sample.
For the PP ridge sample, the axis of the DME runs between , and , , i.e. along the mean radial direction of the PP clusters, near A262. The total peculiar velocity error of 220 km s-1 in this direction can be broken down as 161 km s-1 (random error), 125 km s-1 (system matching error) and 85 km s-1 (the error arising from uncertainty in the distance scale zero-point from column 2, row 1 of Table 4). Thus the system-matching error accounts for 18% of the total error. The errors on the components of the mean motion in the two other transverse directions are very large ( km s-1 and km s-1), so the motion of the PP ridge is only well-determined in the radial direction. The mean radial peculiar motion of the PP ridge clusters is km s-1. The PP ridge is thus consistent with having no radial peculiar motion in the CMB frame.

Fig. 9 shows the peculiar velocities projected along the DME as a function of their distance from the LG (with the PP direction taken to be negative and the GA direction positive). Only clusters within 30° of the DME are shown. The predictions of the GA, LP and IRAS flow models are shown schematically by the hatched regions, which indicate the range of predicted peculiar velocities within the cone. Note that the GA and IRAS predictions overlap in the region where the GA model was first defined, km s-1. The IRAS predictions are more complex elsewhere, in particular infall around PP is expected. Note that the PP ridge clusters do not lie in the foreground or background infall regions, but right along the centre of mass of the supercluster where . Finally, note that this diagram is intended to show the qualitative behaviour of the data and flow models near the DME. It should not be used to compare the observed and predicted peculiar velocities of individual clusters since the predictions are only the mean within the cone and not the value at the position of the cluster itself.

We now consider in more detail the predictions of the IRAS density field. Fig. 10 plots the observed peculiar velocities of individual clusters against the IRAS predictions at their estimated positions, with . The slope of the line of best fit thus gives the value of : the result is . This is a marginally significant detection of , but the errors are too large to place useful constraints on its value. In principle, however the comparison of cluster peculiar velocity fields with the predictions from a deep all-sky redshift survey should lead to a determination of which is more reliable than most other methods. The advantage of our approach is that inhomogeneous Malmquist bias, smoothing effects and the effects of non-linear bias and gravity are all small for cluster peculiar velocities.
For the fits with , the quoted bulk motion is the residual CMB-frame motion due to sources not modelled by the IRAS density field, i.e. beyond 12000 km s-1 or due to shot noise errors within that distance (see Willick et al. 1997b for a discussion of these errors). It is interesting to note that the prediction for the error-weighted mean motion of the PP ridge clusters is km s-1 away from the LG. This has a direction opposite to the prediction of the GA model. Presumably the effects of other structures, such as the foreground void, are important for the dynamics of the PP ridge. The residual motions of both the full sample and the PP ridge sample are small and consistent with zero. Finally, we note that the IRAS-predicted peculiar velocity for J8 is km s-1 in good agreement with the observed value km s-1. However, for A2634, the IRAS prediction is only km s-1, which appears to be marginally inconsistent with the observed km s-1. Note, however, that the shot-noise error in the IRAS prediction is km s-1 and the systematic uncertainty in the peculiar velocity of A2634 is km s-1.
We have considered fits to the GA model of Faber & Burstein (1988). Our sample is not ideal, however, for constraining the GA model, since it contains few clusters in the regions where the GA model predicts strong infall. In particular the Cen30 and Cen45 clusters have been excluded from our sample. In performing fits of this type, we find poor agreement with the model. The disagreement does not arise from the small infall motion of the PP ridge, which is in rough agreement with the GA model, but is instead partly due to A3574 which has a peculiar velocity of km s-1 near the centre of the GA, where its peculiar velocity should be km s-1. This result should be taken with some caution since the peculiar velocity of A3574 may be biased by a low galaxy which is an outlier in the FP relation (see Section 6.1 below).
We have also considered models involving infall to the Shapley Concentration (Raychaudhury 1989). We find that the results are statistically indistinguishable from a pure bulk motion in the same direction, because we have no clusters close enough to the Shapley Concentration for its tidal shear to be important.
Finally, we can use our results to constrain the thermal component of the clusters’ peculiar velocity with respect to a given flow model. We do this by varying and requiring that the resulting (equation (5)) lie in an acceptable range. For the full cluster sample, we find that km s-1 at the 95% confidence level, with the most likely value being km s-1. This agrees well with the typical values seen in N-body simulations (Gramann et al. 1995). The flow field of the 6 clusters in the PP ridge seems to be particularly cold: the 95% upper limit on their rms peculiar velocity is km s-1.
6 Tests of potential systematic effects
Systematic errors are often a major concern for distance measurements. In the analysis above, we have considered the uncertainty introduced by errors in matching the different velocity dispersion datasets. In this section we explore other effects that might lead to biases in our peculiar velocity results.
6.1 Effect of low-dispersion galaxies
Galaxies with velocity dispersions below 100 km s-1 can have large systematic and random errors in the measured velocity dispersion (JFK95b). Our PP target sample contains only 5 galaxies with velocity dispersions smaller than 100 km s-1, and the full sample of 16 clusters contains only 16 such galaxies. We have tested the effect these galaxies might have on our solutions by explicitly excluding them, and correcting for the cut in a manner exactly analogous to the bias correction prescription of Willick (1994) for the calibration of the forward Tully-Fisher relation from a magnitude-limited sample of cluster galaxies. We find that none of our results (the slopes of the FP relation, the peculiar velocities of individual clusters or the global flow model fits) change by an amount larger than the random error, with the exception of the peculiar velocity of A3574, which drops from 655 km s-1 to 66 km s-1 when the galaxy W69 is excluded.
6.2 Effects of galaxy morphology
We have assigned galaxies to morphological categories using their appearance on our CCD frames, and their radial profiles derived from the aperture photometry. The classifications for PP galaxies is given in PPI. Note that the categories are broad: E ; S0; Q (unclassified or unclassifiable; there are only two galaxies with this classification).
To assess the validity of the equal treatment of E and S0 galaxies in our analysis, we can compare the relative offset of elliptical galaxies (E, E/S0, cD or D) and S0s (S0, S0/E) with respect to the mean inverse FP relation. Elliptical galaxies have slightly higher at the same values of than S0 types by . Using a sample which has a large number of galaxies in common with that considered here, JKF96 found a difference of in the opposite sense. Our sample includes about twice as many galaxies as that considered by JFK and we have adopted an optimal correction scheme for combining the different velocity dispersion datasets. The scatter, , of the elliptical galaxies is 0.054 compared to 0.073 for the S0 galaxies. This difference may be due to the fact that S0 galaxies tend to have lower velocity dispersions which carry with them larger observational errors. We conclude that there is marginal evidence of a difference between FP relations of E and S0 galaxies. We have investigated the effects of this difference on our flow results and find that, because most clusters have similar proportions of E and S0 galaxies, none of our results are sensitive to this offset.
6.3 Stellar population effects and the FP-Mg2 relation
The presence of a small percentage of stars with intermediate ages would increase the scatter of the FP relation, and cause systematic biases in the derived distances. Since the distance-independent Mg2 index is also sensitive to stellar populations, the use of Mg2 as an additional parameter in the FP relation had been advocated (Gúzman & Lucey 1993). There are, however, several practical reasons why we prefer not to use Mg2 in our distance indicator. We shall see that for inverse fits, including Mg2 decreases the scatter in but actually increases the random distance error, due to the change in slope . Furthermore, by including Mg2, the total system matching distance errors increase (by about a third) due to the addition of the Mg2 system matching errors and due to the velocity dispersions system matching errors, again because of the change in slope . Finally, only 315 of the 352 galaxies in our sample have Mg2 measurements, and we are required to drop the cluster DC2345-28 which has only one Mg2 measurement amongst the spectroscopic systems considered in this paper.
Nevertheless, in order to investigate the effects of stellar populations on our results, we have proceeded with fits to an FP-Mg2 relation of the form
| (6) |
We find the results , and with and . This highly significant detection of the Mg2 correlation arises as a result of the inverse nature of the fit. The –Mg2 relation has a scatter of only 0.086 in , which is only slightly larger than the scatter in the inverse FP. The inverse fit thus gives considerable weight to Mg2 as a predictor of , in contrast to the forward FP. The distances of individual clusters typically change by , except for Coma which shows an offset at the level. Because Coma was our nominal calibrator, all distances require rescaling by 5% with the result that Coma has a peculiar velocity of km s-1 and the remaining clusters follow the Hubble flow in the mean. The best fitting bulk flow of the full cluster sample is in fact somewhat smaller than that of the FP solution but well within the errors. The motion of the PP ridge towards the LG increases slightly to km s-1, which again differs by from the FP solution.
We conclude that the residuals of individual galaxies from the inverse FP relation are weakly correlated both with galaxy morphology and with Mg2 index. However, when averaged over all galaxies in a given cluster, there is a negligible net effect of such correlations on derived cluster distances, and hence the flow results are robust against such effects.
7 Comparison with other work
7.1 Bulk flow and the motion of Perseus–Pisces
For the full 16 cluster sample, we find a bulk motion which is consistent with these clusters being at rest in the CMB frame. In order to compare our bulk motion, , with covariance matrix with an independent sample with bulk motion and covariance matrix , we calculate
| (7) |
and compare the result to a distribution with 3 degrees of freedom (following Hudson & Ebeling 1997, hereafter HE)333Note that when comparing two peculiar velocity samples with different sky coverage and effective depth, we do not expect the measured bulk flows, and , to be identical even in the limit of no measurement errors due to the different window functions (Watkins & Feldman 1995). Therefore, the confidence with which we conclude that two samples are inconsistent will in general be slightly overestimated.. We find that the bulk motion of our sample is consistent with the km s-1 motion found by Courteau et al. (1993). However, the bulk motion found in this paper is inconsistent at the 98% confidence level with the result of LP, who used the photometry of brightest cluster galaxies (BCGs) as a distance indicator. Our result is also inconsistent at the 94% confidence level with bulk motion obtained by HE, who applied a correction for the X-ray luminosity of the host cluster to the BCG distance indicator of LP.
We find a negligible mean radial motion for the PP ridge ( km s-1), which is, at face value, marginally inconsistent with the result of Willick (1990) who found a mean peculiar velocity of km s-1 (random error) from a TF study of PP field spirals in the redshift range km s-1. Note, however, that the systematic calibration error on this result is km s-1 (Willick 1991). Furthermore, the two samples probe different parts of the PP supercluster: the PP ridge clusters studied here range from RA whereas the volume probed by Willick covers a wider range of redshifts and extends farther to the west, from RA . Willick (1991) noted that the western half of his sample had a greater infall toward the LG. It is not clear then that the two results are in significant disagreement.
Our result is also marginally inconsistent with the result of HM who found a PP radial motion of –400 km s-1 from a TF cluster survey. However, it should be noted here that the HM and Willick (1990, 1991) results are not independently calibrated. Both studies use Aaronson et al. (1986) linewidths for the calibrating cluster sample, and linewidths from the work of Giovanelli, Haynes and collaborators (e.g. Giovanelli & Haynes 1985; Giovanelli et al. 1986) for the PP sample. HM also adopt the prescription of Willick (1991) to transform between the two systems. The transformation is based on a sample of 58 galaxies in common between the two linewidth sources.
7.2 Individual cluster distances and peculiar velocities
In order to understand the above-mentioned conflicts between our results and those of Han & Mould, Lauer & Postman and Hudson & Ebeling, we now turn to a comparison of distance and peculiar velocities of individual clusters.
We have compared our cluster distances and peculiar velocities with the inverse TF cluster distances and peculiar velocities of HM, as rederived by Willick et al. (1997a) for the 7 clusters in common to the two samples. The results are shown in the upper panels of Fig. 11 and peculiar velocities are tabulated in Table 6.


| Fundamental Plane | Tully–Fisher | Brightest Cluster Galaxy | |||||||||||
| Cluster | Comments | ||||||||||||
| km s-1 | km s-1 | km s-1 | km s-1 | km s-1 | km s-1 | ||||||||
| Pisces | — | — | — | ||||||||||
| HMS0122 | — | — | — | ||||||||||
| A262 | — | see text | |||||||||||
| A347 | — | — | — | — | |||||||||
| A2199 | — | — | |||||||||||
| A2634 | — | see text | |||||||||||
| Coma | |||||||||||||
| A194 | — | — | |||||||||||
| A539 | — | ||||||||||||
| A3381 | — | — | — | ||||||||||
| A3574 | — | ||||||||||||
| DC2345-28 | — | — | |||||||||||
| Hydra | |||||||||||||
The two sets of cluster distances are marginally inconsistent at the 90% confidence level. However, we find that there is good agreement between cluster peculiar velocities. Note that elliptical and spiral galaxies in the same nominal cluster do not necessarily sample the same kinematic object. In particular, spiral cluster samples typically extend to larger radii, and may be more prone to contamination from the field, or from infalling groups.
For example, for the most discrepant cluster, A262, we find km s-1, km s-1, and hence km s-1 whereas Willick et al. (1997a) find km s-1, km s-1 and hence km s-1 Furthermore, the nominal cluster centres differ by 1°. It is not clear, therefore, whether our A262 cluster is the same object as that of HM. A similar situation holds for the next most discrepant cluster, A2634, in which the treatment of the companion cluster A2666 affects the comparisons. Scodeggio et al. (1995) present a full discussion of the contamination problems for this cluster. If we remove either one of these two clusters from both samples, the distances are compatible.
In contrast to the TF results of Willick (1990,1991), Courteau et al. (1993) and HM, the recent I-band Tully-Fisher cluster (Giovanelli et al. 1997a, b, hereafter SCI) and field (Giovanelli et al. 1996) data suggest no net motion for PP. The lower panels of Fig. 11 compare our distances with the cluster distances of Giovanelli et al. (1997a,b). We have computed the mean CMB redshifts of cluster members from Giovanelli et al. (1997a) using galaxies denoted by “c” in column 7 of their Table 2, corresponding to their “in” samples) and peculiar velocities determined from their incompleteness-corrected TF magnitude offsets from column 5 of Table 3 of Giovanelli et al. (1997b). Note that their NGC 383 Group corresponds to Pisces and their NGC 507 group corresponds to HMS0122. While the two samples of cluster distances disagree at the 99% confidence level, this disagreement is mainly due to A2634 for which the mean redshifts differ by 650 km s-1. If this cluster is removed from the comparison, the distances are consistent.
The data used to determine the peculiar velocities of A2199 and A2634 are the same as that used by LGSC. Whereas we derive values of km s-1 and km s-1 respectively, LGSC derived km s-1 and km s-1. These relatively small differences arise from the application of the FP distance indicator. In this paper we have used the ‘inverse’ relation whereas LGSC used the ‘forward’ relation with an allowance for the different selection functions in the clusters.
Scodeggio, Giovanelli & Haynes (1996) have recently reported new FP results for Coma and A2634. Using Coma as the calibration cluster, they derive a distance for A2634 of km s-1. While their photometric parameters are from a new set of I-band data, they used velocity dispersion data from several sources. For the Coma cluster these are mostly taken from the literature, while for A2634 they use mainly new velocity dispersion measurements from the Hale 5m telescope. They have only a small overlap between their measurements and the literature values. Their quoted error in the A2634 distance does not include the uncertainty in linking their velocity dispersion values onto the ‘literature’ system. In PPI we showed that different spectroscopic datasets typically differ at the level of 0.01 dex. Using the new measurements from PPI and LGSC, we find that the Scodeggio et al. velocity dispersions are dex smaller than our standard system. While a more extensive analysis is required to place the Scodeggio et al. data accurately onto a ‘standard’ system, such a systematic offset would translate into increasing their derived distance for A2634 by 500 km s-1. After allowing for this correction the Scodeggio et al. distance for A2634 is not in conflict with the value reported here, i.e. km s-1 versus km s-1.
Our non-detection of a bulk motion is in disagreement with the result of LP, who studied BCGs in 119 Abell/ACO clusters within km s-1. They used a distance indicator based on the photometry of BCGs and concluded that their sample had a bulk motion with respect to the CMB frame of km s-1 towards , . The 16 cluster sample studied here is much smaller than theirs, but the distance error per cluster is typically much smaller in this work. The results of comparing individual cluster distances for the 11 clusters in common are shown in the upper panels of Fig. 12. The two sets of cluster distances (peculiar velocities) disagree at the 99.9% (99.7%) confidence level, which indicates that the errors on one or both of the data sets are underestimated. Note that, in contrast to the comparison between spiral and elliptical cluster samples, the mean redshifts and distances of our samples of cluster ellipticals, which typically include the BCG, are expected to be very similar to those of the BCGs alone (see the middle panels of Fig. 12).
The lower panels of Fig. 12 show the comparison between the clusters of this paper and BCG distances rederived by HE for the 9 clusters in common. The BCG distance indicator of HE is similar to that of LP but includes a correction to the BCG magnitude for the X-ray luminosity of the host cluster, because more X-ray luminous clusters tend to have brighter BCGs. The agreement between the our cluster distances with those of HE is better than with those of LP, but is still marginal: the two samples disagree at the 94% confidence level. Part of the improved agreement results from the absence of A3381 from the X-ray sample, and part of the improvement is due to the X-ray correction itself: for the 9 clusters in common, the reduced is 2.32 for the LP distance indicator (still incompatible at the 98.7% confidence level) and 1.83 for the X-ray corrected BCG distance indicator. Nevertheless, there remain outlying clusters in the BCG samples: for both A262 and Coma (A1656) both the LP BCG distance indicator and the X-ray corrected BCG distance indicator of HE indicate peculiar velocities in excess of 2000 km s-1 (see Table 6).
8 Summary
We have measured the mean peculiar motions of 103 early-type galaxies in 7 clusters in the PP region, and a further 249 such galaxies in 9 calibrating clusters from the literature, using the inverse Fundamental Plane relation. This relation is found to have a distance error of 20% per galaxy. Our principal results are as follows:
-
1.
Of 6 clusters in the PP ridge, none shows a significant motion with respect to the CMB frame. For the PP background cluster J8, there is marginal evidence for ‘backside infall’ into the PP supercluster.
-
2.
The PP supercluster has an insignificant net radial motion ( km s-1) with respect to the CMB frame.
-
3.
An all-sky sample comprised of 16 clusters (with median depth km s-1) exhibits a bulk motion of km s-1 towards , .
-
4.
Comparison of observed cluster velocities with predictions from the IRAS 1.2Jy redshift survey yields , consistent with previous results.
Our error analysis fully accounts for the uncertainties in the mean Hubble flow as well as the errors due to the merging of different spectroscopic systems.
The bulk motion of the 16 cluster sample is consistent with the sample being at rest in the CMB frame, but is also consistent with the km s-1 motion found by Courteau et al. (1993). It is inconsistent with the km s-1 bulk motion found by LP.
Our mean PP radial motion result is in apparent conflict with the TF results of Willick (1990, 1991) and HM which had found a km s-1 peculiar velocity of the PP ridge, but our results are in better agreement with the recent TF data of Giovanelli et al. (1996,1997a,b). Comparison of elliptical and spiral samples, is far from straightforward, however, due to the complex nature of the peculiar velocity field and the different regions probed by different surveys.
The disagreement between our cluster distances and those of LP for the 11 clusters in common is statistically significant at the % confidence () level indicating that the errors of one or both of these data sets are underestimated. When the X-ray corrected BCG distances of HE are used, the disagreement is reduced to the % () confidence level.
The cluster peculiar velocity comparison is potentially the cleanest method of determining on linear scales because it is relatively insusceptible to Malmquist and smoothing biases. However, a larger sample of clusters is required to reduce the random errors.
The results from several large-scale peculiar velocity surveys are expected shortly. Of particular interest are the elliptical sample of the EFAR collaboration (Wegner et al. 1996), the cluster Tully–Fisher survey of Giovanelli, Haynes and collaborators (Dale et al. 1997) and the Tully-Fisher field survey discussed by Strauss (1997; see also references therein for other peculiar velocity surveys).
Finally, with collaborators, three of the present authors are currently obtaining FP data for ellipticals in an all-sky sample of approximately 50 clusters within a distance of 12000 km s-1. This will allow a precise measurement of the bulk motion on these scales as well as a clean determination of in the linear regime.
Acknowledgments
Michael Strauss is thanked for supplying to us the IRAS 1.2Jy density field. This work has made use of Starlink facilities at Durham. JS and RJS acknowledge financial support from the PPARC. MJH acknowledges financial support from the PPARC; from a CITA National Fellowship; and from the Sciences and Engineering Research Council of Canada, through operating grants to F. D. A. Hartwick and C. J. Pritchet.
References
- [1] Aaronson M., Bothun G., Mould J., Huchra J., Schommer R. A., Cornell M. E. 1986, ApJ, 302, 536
- [2] Burstein D., Heiles C., 1982, AJ, 87, 1165
- [3] Courteau S., Faber S. M., Dressler A., Willick J. A., 1993, ApJ, 412, 51L
- [4] da Costa L. N., Freudling W., Wegner G., Giovanelli R., Haynes M. P., Salzer J. J., 1996, ApJ, 468, 5L
- [5] Dale D. A., Giovanelli R., Haynes M. P., Scodeggio M., Hardy E., Campusano L. E., 1997, AJ, in press
- [6] Dekel A., 1994, ARA&A, 32, 371
- [7] Faber S. M., Burstein D., 1988, in Coyne G., Rubin V.C., eds, Proceedings of the Vatican Study Week, Large Scale Motions in the Universe. Princeton Univ. Press, Princeton, p. 135
- [8] Faber S. M., Wegner G., Burstein D., Davies R. L., Dressler A., Lynden-Bell D., Terlevich R. J., 1989, ApJS, 69, 763
- [9] Fisher K. B., Huchra J. P., Strauss M. A., Davis M., Yahil A., Schlegel, D., 1995a, ApJS, 100, 69
- [10] Fisher K. B., Lahav O., Hofman Y., Lynden-Bell D., Zaroubi S., 1995b, MNRAS, 272, 885
- [11] Giovanelli R., Haynes M. P. 1985, AJ, 90, 2445
- [12] Giovanelli R., Haynes M. P., Myers S. T., Roth J. 1986, AJ, 92, 250
- [13] Giovanelli R., Haynes M. P., Wegner G., da Costa L. N., Freudling W., Salzer J. J., 1996, ApJ, 464, 99L
- [14] Giovanelli R., Haynes M. P., Herter T., Vogt N. P., Wegner G., Salzer J. J., da Costa L. N., Freudling W., 1997a, AJ, 113, 22
- [15] Giovanelli R., Haynes M. P., Herter T., Vogt N. P., da Costa L. N., Freudling W., Salzer J. J., Wegner G., 1997b, AJ, 113, 53
- [16] Gramann M., Bahcall N. A., Cen R., Gott J. R., 1995, ApJ, 441, 449
- [17] Gúzman R., Lucey J. R., 1993, MNRAS, 263, L47
- [18] Han M., Mould J. R., 1992, ApJ, 396, 453
- [19] Huchra J. P., Geller M. J., Clemens C. M., Tokarz S. P., Michel A., 1993, the CfA redshift Catalogue, unpublished
- [20] Hudson M. J., 1993, MNRAS, 265, 43
- [21] Hudson M. J., 1994a, MNRAS, 266, 468
- [22] Hudson M. J., 1994b, MNRAS, 266, 475
- [23] Hudson M. J., Dekel A., Courteau S., Faber S. M., Willick J. A., 1995, MNRAS, 274, 305
- [24] Hudson M. J., Ebeling H., 1997, ApJ, in press (HE)
- [25] Jørgensen I., Franx M., Kjærgaard P., 1995a, MNRAS, 273, 1097 (JFK95a)
- [26] Jørgensen I., Franx M., Kjærgaard P., 1995b, MNRAS, 276, 1341 (JKF95b)
- [27] Jørgensen I., Franx M., Kjærgaard P., 1996, MNRAS, 280, 167 (JFK96)
- [28] Lauer T. R., Postman M., 1994, ApJ, 425, 418 (LP)
- [29] Lilje P. B., Yahil A., Jones B. J. T., 1986, ApJ, 307, 91
- [30] Lucey J. R., Carter D., 1988, MNRAS, 235, 1177 (LC88)
- [31] Lucey J. R., Gray P. M., Carter D., Terlevich R. J., 1991, MNRAS, 248, 804
- [32] Lucey J. R., Gúzman R., Steel J., Carter D., 1997, MNRAS, 287, 899 (LGSC)
- [33] Lynden-Bell D., Faber S. M., Burstein D., Davies R. L., Dressler A., Terlevich R. J., Wegner G., 1988, ApJ, 326, 19
- [34] Mathewson D. S., Ford V. L., Buchhorn M., 1992, ApJS, 81, 413
- [35] Postman M., Lauer T. R., 1995, ApJ, 440, 28
- [36] Raychaudhury S., 1989, Nat, 342, 251
- [37] Santiago B. X., Strauss M. A., Lahav O., Davis M., Dressler A., Huchra J. P., 1995, ApJ, 446, 457
- [38] Saunders W., et al., 1991, Nat, 349, 32
- [39] Scodeggio M., Solanes J. M., Giovanelli R., Haynes M. P., 1995, ApJ, 444, 41
- [40] Scodeggio M., Giovanelli R., Haynes M. P., 1997, AJ, 113, 101
- [41] Shaya E. J., 1984, ApJ, 280, 470
- [42] Smith R. J., Lucey J. R., Hudson M. J., Steel J., 1997, MNRAS, in press (PPI)
- [43] Strauss M. A., Willick J. A., 1995, Phys Rep, 261, 271
- [44] Strauss M. A., 1997, in Turok, N, ed., Critical Dialogues in Cosmology, World Scientific, Singapore
- [45] Tammann G. A., Sandage A., 1985, ApJ, 294, 81
- [46] Watkins R., Feldman H. A., 1995, ApJ, 453, L73
- [47] Wegner G., Haynes M. P., Giovanelli R., 1993, AJ, 105, 1251
- [48] Wegner G., Colless M., Baggley, G. Davies R. L., Bertschinger E., Burstein D., Mcmahan R. K. Jr., Saglia R. P. 1996, ApJS, 106, 1
- [49] Willick J. A., 1990, ApJ, 351, L45
- [50] Willick J. A., 1991, PhD thesis, University of California, Berkeley
- [51] Willick J. A., 1994, ApJS, 92, 1
- [52] Willick J. A., Courteau S., Faber S. M., Burstein D., Dekel A., 1995, ApJ, 446, 12
- [53] Willick J. A., Courteau S., Faber S. M., Burstein D., Dekel A., Strauss M. A., 1997a, ApJS, 109, 333
- [54] Willick J. A., Strauss M. A., Dekel A., Kolatt T., 1997b, ApJ, in press.