11.03.1, 11.03.4,12.04.1, 13.25.2
G.B. Lima Neto, gastao@iap.fr 11institutetext: Institut d’Astrophysique de Paris, CNRS, Université Pierre et Marie Curie, 98bis Bd Arago, F-75014 Paris, France 22institutetext: Observatoire de Lyon, Av. Charles André, F-69561 St Genis Laval Cedex, France 33institutetext: DAEC, Observatoire de Paris, Université Paris VII, CNRS (UA 173), F-92195 Meudon Cedex, France 44institutetext: Observatoire de la Côte d’Azur, B.P. 229, F-06304 Nice Cedex 4, France
The rich cluster of galaxies ABCG 85. II. X-ray analysis using the ROSAT HRI††thanks: Based on ROSAT Archive data
Abstract
We present a new X-ray analysis mainly based on ROSAT HRI data. The HRI spatial resolution combined with an improved wavelet analysis method and with complementary radio and optical data provides new results compared to a previous paper based on ROSAT PSPC data (Pislar et al. 1997). We use also redshift data in order to identify galaxies dynamically belonging to the main body of the cluster and/or to superimposed substructures.
Various kinds of emission are superimposed on a mean thermal X-ray
emission due to the intra-cluster gas:
– an X-ray flux excess in the centre at a scale of 15-25 kpc;
– a south blob, partially generated by individual galaxies (such as
the second brightest galaxy); the mean velocity and velocity
dispersion of the galaxies located in this region are the same as
those of the cluster as a whole: it therefore does not seem to be a
bound subgroup;
– West emission due to a foreground group with self-emission from
a Seyfert galaxy located at the north-west;
– emission in the south-west due to inverse
Compton emission associated to a very steep radio source (the remnant of an
active galactic nucleus).
We have examined the possibility for the central peak to be an “unusual” galaxy, as assumed for the central galaxy of J2310–43 (Tananbaum et al. 1997). We conclude on the existence of a cooling flow region, in which the presence of at least three small features certainly related to cooler blobs is revealed by the wavelet analysis.
We have performed a pixel-to-pixel modelling of the double X-ray emission. The large scale emission component is comparable to those derived from by the PSPC data and the small scale one is interpreted as a cooling-flow. A multiphase gas model analysis leads to a mass deposit of 50–150 M⊙/yr.
keywords:
Galaxies: clusters: general; Clusters: individual: ABCG 85; galaxies1 Introduction
ABCG 85 is a richness class 1 cluster of cD type (Struble & Rood 1987), with an optical redshift of 0.0555. We have recently studied it extensively (Pislar et al. 1997, hereafter PDGLS), simultaneously using ROSAT PSPC and optical data (photometry and spectroscopy); this led to a complex view of this cluster. With the spectroscopic capabilities, but modest spatial resolution of the PSPC, our previous study was aimed at modelling the large-scale and global properties of ABCG 85. A full description can be found in the quoted paper.
Tananbaum et al. (1997, hereafter TTPR) have pointed out that the brightest galaxy of the cluster J2310–43 has some properties that makes it “unusual”: “an active nucleus without optical emission lines and without a substantial optical continuum”. The ABCG 85 Brightest Cluster Member (BCM) appears to us very similar to their “unusual” galaxy, from the optical, X-ray and radio points of view.
The ROSAT HRI (High Resolution Imaging) is best suited for observing small features in X-ray images of clusters, specially when performing a wavelet analysis.
In this paper, we address various questions that we are now able
to answer:
– On the PSPC image we have found that an intense peak of X-ray emission
is superimposed on the location of the central cD, and we have shown that
this peak was unresolved. This has led us to perform a more
detailed analysis (wavelet, spectral and modelling) on the cD of ABCG 85
using the HRI image, and to compare its properties with those of
J2310–43.
– We have shown (PDGLS) that the South Blob of ABCG 85
appears in fact due to self-emitting X-ray galaxies. We will check if
this is still true with the better spatial resolution of the HRI.
– Prestwich et al. (1995) have shown the possible existence of small bright
emitting features (of sizes 5–10 arcsec, or kpc).
They claim that these features cannot be
identified with single galaxies and are not likely to be foreground or
background sources. We will discuss whether an “objective” wavelet
analysis confirms the existence of the same features.
– We have completed the X-ray data with optical and radio data found in the
literature, in order to check if the X-ray features detected at different
scales were correlated with other optical and/or radio objects
(extended or not). These correlations could give us a clue on the
physical nature of the X-ray features (thermal or not, for instance).
Coupling the high resolution data from the HRI with the spectral information of the PSPC, as well as with optical and radio data, can lead us to a better understanding of ABCG 85. In section 2 we describe the data used for the image analysis (section 3) and spectral analysis (section 4). The modelling of a multi-phase cooling flow and the detailed comparison of the ABCG 85 and J2310–43 BCMs are done in section 5.
2 The data
2.1 X-rays
The ABCG 85 field was observed by the ROSAT HRI in June 1992 with an exposure time of 17351 seconds (P.I. Prestwich). Pixels were rebinned to a size of 5 arcsec, corresponding to kpc at the cluster distance, or to a size of 8 arcsec corresponding to kpc. In order to compare its properties with those of the cluster J2310–43, we have also performed a new spectral analysis based on PSPC data.
2.2 Optical
In the optical, our data is based on a photometric catalogue of 4232 galaxies (Slezak et al. 1997) and on a catalogue of 550 redshifts (Durret et al. 1997). The superposition of the galaxies belonging to ABCG 85 (in the velocity range 13300–20000 km/s, cf. PDGLS) to the PSPC image has shown the existence of X-ray emitting galaxies, among which the cD galaxy. The main features of the galaxy distribution were described in PDGLS. We have found for the cluster itself (i.e. without the fore and background substructures) a velocity dispersion of =760 km s-1, as expected from a richness class 1 cluster and from the X-ray luminosity of the diffuse component erg sec-1.
We have also used photographic data from the Digitized Sky Survey obtained with the UK Schmidt Telescope to superimpose the optical images of the galaxies to the X-ray and radio maps.
2.3 Radio
The correlation (or anti-correlation) of radio and X-ray emissions can give some clues on the physical processes involved in the cooling of the gas. It can also give limits on the magnitude of the cluster magnetic field.
A number of radio data can be found in the literature for ABCG 85. We present here a summary of these observations:
-
•
A radio map at 327 MHz obtained by Kapahi and Subrahmanyan (see Swarup 1984) with a 3 arcmin gaussian beam;
-
•
VLA observations of radio sources at 1452 MHz in the direction of ABCG 85 (O’Dea and Owen 1985) at 1–5 arcsec resolution;
-
•
Data from the VLA survey at 1400 MHz with 45 arcsec resolution performed by Condon et al. (1996);
-
•
Several 1500 MHz maps from the VLA Survey of rich clusters of galaxies with 15 arcsec FWHM (Slee et al. 1996);
-
•
The 2695 MHz Effelsberg map (Waldthausen et al. 1979 and Andernach et al. 1986) made with a 4.4 arcmin beam;
-
•
A 4872 MHz VLA map at a resolution of 1–2 arcsec (Burns 1990).
We will use the radio image produced by Condon et al. (1996) and compare it to the HRI data of ABCG 85. This radio image is available in electronic form, has a high surface-brightness sensitivity, enough spatial resolution for our purposes, and covers the whole field of view of the cluster.
3 Image analysis
For the image analysis, we have performed a wavelet multiscale reconstruction on the HRI image. This multiscale analysis is explained and described in PDGLS. However, we have improved our method by correcting the image for vignetting (using the Snowden 1995 “cookbook”), but not for background contribution, since we need to know the background in order to determine the significance level of the features used for the final wavelet “reconstructed” image. We have modified the wavelet technique, in order to detect better the faint background components which are sometimes hidden by bright small-scale superimposed features. Details on the recent improvements to this method are given in the Appendix.
The HRI has a better spatial resolution than the PSPC – the pixel size is 5 arcsec instead of 15 arcsec – therefore, although the observed cluster is obviously the same for the two detectors, a comparison of the two analyses can be fruitful. Actually, we have paid attention to three kinds of behaviours that we will describe below.
3.1 Comparison of PSPC and HRI images
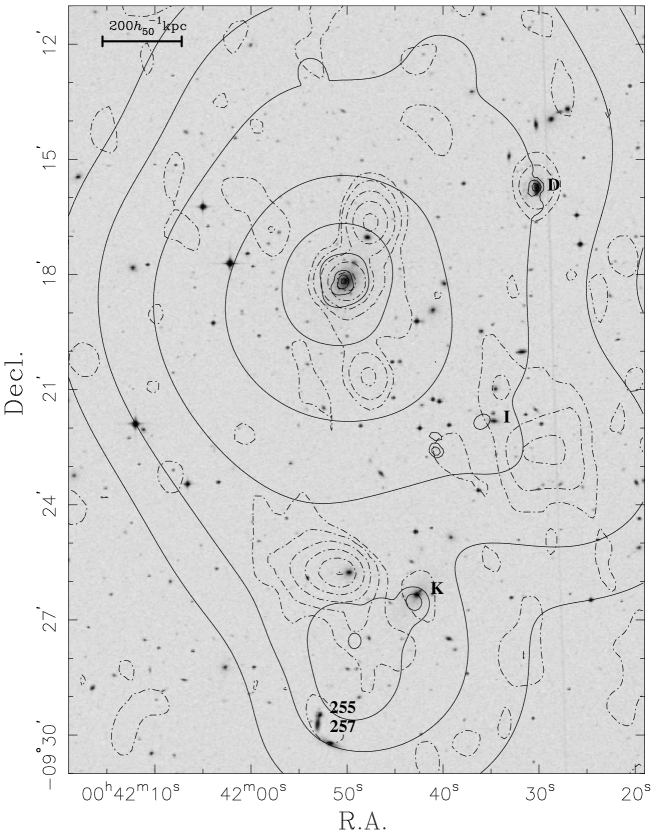
We will compare the wavelet “reconstructed” HRI (Fig. 1) and PSPC images (Fig. 2 of PDGLS). In addition to the X-ray image, we overlay in Fig. 1 a 1400 MHz radio map and an optical image.
When doing the overlay with the optical image, we noticed that the X-ray HRI contours were shifted towards the east by about 9 arcsec, when comparing the X-ray sources related with galaxies with the positions of the galaxies D, K, and the cD (cf. Table 1 of PDGLS). The same shift is also seen between the X-ray and radio emissions of these same galaxies. This shift is actually comparable to the upper limit of the known uncertainties of the ROSAT aspect camera. Therefore, in Fig. 1 (as well as Figs. 3 and 4 below) we applied a 9 arcsec correction to the position of the X-ray image, in order to realign it with the optical and radio images.
The PSPC and HRI general image structures are essentially the same: a main body with an intense peak superimposed (this prominent X-ray peak being centered on the location of the cD), two extensions to the west and a south blob. However, some differences can be noticed as described in the paragraphs below.
3.1.1 Central emission
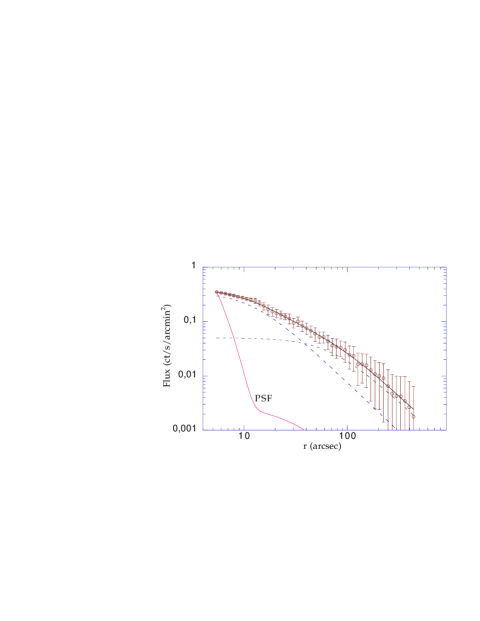
The central peak is now resolved at the 10 arcsec scale (plane 2 of the wavelet coefficients), but remains unresolved at the 8 arcsec scale. It is definitively not a point-like source. This suggests that the scale of the summit is greater than 13 kpc but smaller than 16 kpc.
We give in Fig. 2 the profile obtained using the IRAF stsdas/ellipse task. A small shoulder is visible at a radius of about 15 arcsec (24 kpc); this is also the sign of an X-ray emitting central source superimposed on an extended emission.
We show also in Fig. 2 that the brightness profile may be modelled by the sum of two components, each one following a -model. This is only a rough fit since we do not take into account the physical and geometrical properties of the gas. For comparison purposes we show a point-like source convolved with the Point Spread Function of the HRI. A more accurate fit and physical discussion of the two components will be made in § 5.1.
3.1.2 The south blob
The south blob includes at least three bright spots. However, there is an important difference between the PSPC and HRI images: in PDGLS the diffuse X-ray emission visible on the “reconstructed” image of the south blob disappears completely when the reconstruction is processed without taking into account the smallest scale structures. This is why we have concluded that:
“the south extension S is constituted by the superposition of small emission regions and not by a diffuse extended source such as hot X-ray emitting gas in a group of galaxies”.
On the contrary, in the HRI data, when small scale features are removed a faint diffuse component remains. This is perhaps due to the fact that the lower spatial resolution of the PSPC blurs images and makes the faint diffuse emission of the south blob undetectable. One should also take into account the better performance of the improved wavelet image reconstruction that we have used (see the Appendix).
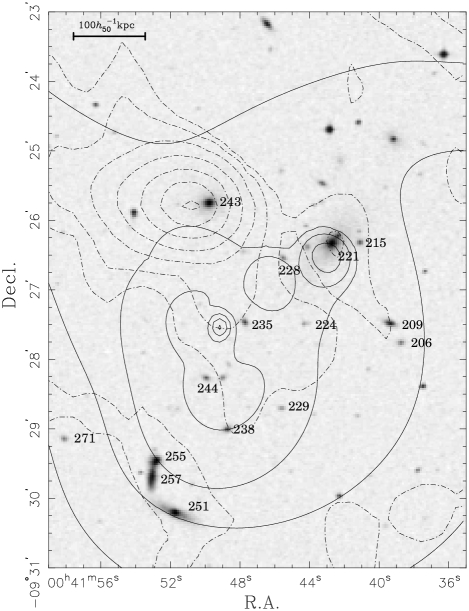
We have superimposed 15 known galaxies with velocities between 14000 and 19000 km/s in the region of the south blob as shown in Fig. 3. Details on these galaxies are given in Table 1, a subset of the complete catalogue of the ABCG 85 field (Durret et al. 1997).
| Galaxy | Velocity | R | ||
|---|---|---|---|---|
| (J2000.0) | (J2000.0) | (km/s) | (magnitude) | |
| 206 | 0 41 38.94 | -9 27 47.91 | 17216 | 17.6 |
| 209 | 0 41 39.54 | -9 27 31.27 | 16647 | 16.2 |
| 215 | 0 41 41.34 | -9 26 21.31 | 16357 | 17.3 |
| 221 (K) | 0 41 43.05 | -9 26 22.32 | 16886 | 14.1 |
| 224 | 0 41 44.54 | -9 27 31.41 | 15517 | 18.3 |
| 228 | 0 41 45.82 | -9 26 34.70 | 15033 | 17.8 |
| 229 | 0 41 45.92 | -9 28 44.50 | 16168 | 18.3 |
| 235 | 0 41 48.04 | -9 27 30.38 | 17203 | 17.0 |
| 238 | 0 41 49.03 | -9 29 03.39 | 18437 | 17.0 |
| 243 | 0 41 50.24 | -9 25 47.41 | 17360 | 15.0 |
| 244 | 0 41 50.34 | -9 28 18.32 | 17081 | 17.4 |
| 251 | 0 41 52.22 | -9 30 16.43 | 17164 | 14.6 |
| 255 | 0 41 53.23 | -9 29 29.45 | 15751 | 15.8 |
| 257 | 0 41 53.62 | -9 29 45.45 | 15392 | 15.1 |
| 271 | 0 41 58.64 | -9 29 10.83 | 16568 | 17.8 |
The most luminous galaxy in this region (galaxy 221 in Table 1, hereafter noted K as in PDGLS, with a magnitude R = 14.1) is actually the second most luminous galaxy belonging to the central main body of ABCG 85. This luminous galaxy is located in a local potential well, generated by the galaxy itself as well as by some other bright galaxies in the vicinity (including galaxy 251 with R = 14.6), in the same way that the cD lies at the bottom of the central gravitational well. Remembering that the X-ray surface brightness traces the potential, such a gravitational well would be sufficient to generate the diffuse X-ray component of the south blob.
However, contrary to Kneer et al. (1996), we do not find evidence that the south blob is falling into the main cluster. The mean and the median velocities of the 15 galaxies superimposed on the south blob (Table 1) are 16585 and 16650 km/s respectively, which are close to the mean and median velocities of the whole cluster. The velocity dispersion of these 15 galaxies is km/s, which is comparable, within the error bars, to that of the whole cluster, but is too high for a subgroup velocity dispersion. Notice that the presence of these 15 galaxies only means a galaxy over-density inside the cluster, but not the presence of a self-gravitational bound substructure.
We believe in the dynamical explanation proposed above, that the south blob is an X-ray over-brightness response to the gravitational well generated by the second brightest cluster member. The fact that the orientation of this galaxy is roughly the same as the main orientation of the blob itself gives support to this point of view.
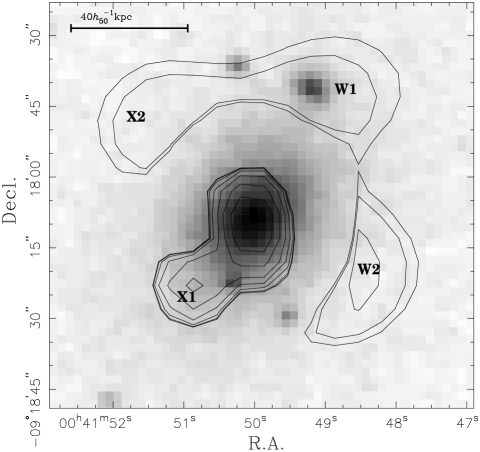
3.2 Central features
Prestwich et al. (1995) have looked in the central part of ABCG 85; they have suggested that some spots are not related to X-ray emitting galaxies. This has been done by subtracting a large scale emission model from the true image. But finally only one of these spots (the feature noted X1 in Fig. 3 of their paper) has been considered as significant by the authors, while the second spot X2 that they found has been rejected as unsignificant.
A picture of the wavelet coefficients at scales of 1 pixel is displayed in Fig. 4 for the same central region. As mentioned above, a shift of about 9 arcsec of the HRI center has been done towards the west (see 3.1), so that the main central feature coincides exactly with the cD galaxy.
We remind the reader that with the wavelet technique only features significant at a 3 level are taken into account. X1, X2, W1 and W2 are significant features found on our map. W2 (as well as X1 and X2) has no optical counterpart, while W1 does have one (when we take into account the error on the HRI attitude). However, we have no velocity information on the galaxy associated with W1 and we cannot be sure that it is not a fore or background galaxy.
We thus confirm the existence of at least three bright spots related to inhomogeneities of the cooling flow. The bright spots appear distributed with a spherical symmetry around the central galaxy. Obviously, the gas in the central region, which is probably in the cooling flow regime, is not homogeneously distributed (both the density and temperature must be inhomogeneous, according to Prestwich et al. 1995).
3.3 Radio and X-ray comparison
| N | Z | L | Case | |||
|---|---|---|---|---|---|---|
| (keV) | (cm-2) | (Z⊙) | (1044 erg s-1) | |||
| — | 9.0 | 237/207 | 1 | |||
| 3.1 | canonical | — | 9.0 | 334/208 | 2 | |
| 4.3 | 0.24 | — | 8.6 | 3 | ||
| 0.10 | canonical | 0.3 fixed | — | 1.3 | 236/206 | 3 |
| 5.1 | canonical | 0.3 fixed | 8.0 | 4 | ||
| -3.25 | 2.6 | 234/207 | 4 |
Note: The error bars are correlated uncertainties.
-
1.
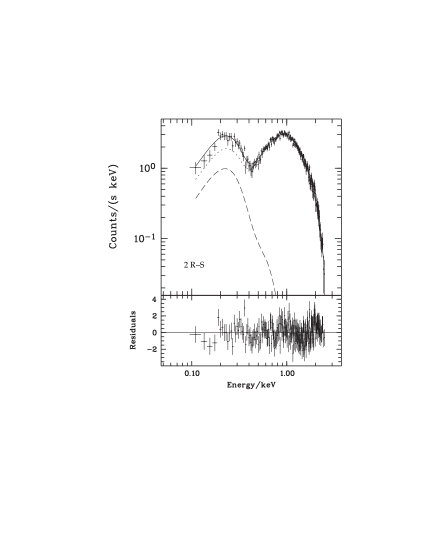
Temperature, hydrogen column density, N, and metallicity, Z, are free parameters in a Raymond-Smith (R–S) plasma. These values have been discussed in PDGLS.
-
2.
Because the previous value for N is lower than the “canonical” value – the galactic value of 3.58 1020 cm-2, as given by Dickey & Lockman (1990) in the position of the cD – we have fixed N to be equal to this canonical value in the fitting process. However the is bad.
-
3.
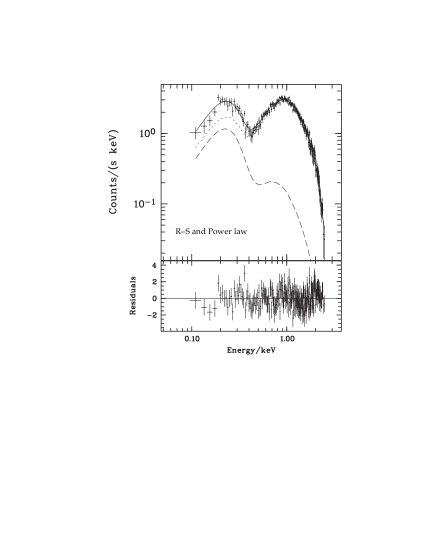
If we fit the spectrum with two R–S laws, and fix N and Z, notice the very weak temperature of the cooler component of keV. The is then improved. We have also tried other fixed values for the metallicity, but due to the bad quality of the spectral capability of the PSPC the resulting temperatures do not change significantly.
-
4.
If we fit the spectrum with a R–S and a power law, the R–S temperature is the same as in the other cases (within error bars), and the power law index is very steep.
In Fig. 1, we have presented the isocontours of the wavelet reconstructed X-ray HRI image, superimposed on the optical image and radio contours at 1400 MHz.
At the position of the cD galaxy, we see strong radio emission. It is also the case around galaxies D and K. North-East of K we see radio emission around galaxy 243 and an extension of X-ray emission from the south blob. These radio emissions, associated with both X-ray and optical counterparts, may suggest the presence of some galactic nuclear activity. Thus, part of the X-ray emission may be due to a non thermal source.
South-East of K, we see a couple of galaxies likely to be interacting (257 and 255) in the centre of a small radio emission, also correlated with an excess of X-ray emission.
We also see strong radio emission with no optical counterpart at the South-West of galaxy I, corresponding to an extension of the X-ray emission (which is also visible with the PSPC). This radio emission is actually due to the very steep spectrum radio source MRC 0038-096. Swarup (1984) has detected this source at 327 MHz, and it is also visible by Slee et al. (1996) at 1500 MHz; it is barely detected at 2700 MHz by Andernach et al. (1986), but not visible by Waldthausen et al. (1979) at the same frequency. MRC 0038-096 is possibly a relic source (Goldshmidt & Rephaeli 1994, Komissarov & Gubanov 1994), the remnant lobes of an once active radio galaxy. In this case, the radio emission is accompanied by an X-ray emission produced by inverse Compton scattering of the cosmological microwave background.
4 Spectral properties
In PDGLS we have paid attention essentially to the general spectral properties, and have also searched for possible variations of the temperature, metallicity, and hydrogen column density, N, with radius. The actual existence of the central emission peak hinted by our wavelet analysis and the X-ray brightness profile lead us now to look for a double structure in the spectral properties. This will also allow a comparison with the properties of the brightest member of the cluster J2310–43 (TTPR).
Notice that in their case the central galaxy is hosted in a very poor cluster (richness class zero), with the bulk of the emission coming from the central galaxy only, so TTPR attempted to fit the spectrum with a single power law. This is not the case for ABCG 85, where an important emission from the overall cluster is observed. Therefore, even if we suppose that the central emission in the central part of ABCG 85 really corresponds to an “unusual” powerful galaxy, the main difficulty would be to untangle the spectral and geometrical properties of the cD: there must at least be two components.
| Temp. | Notes | ||||
|---|---|---|---|---|---|
| (cm-3) | (kpc) | (kev) | |||
| 4 | 12929 | 1 | |||
| 4 | 12812 | 2 | |||
| 4.0 | 12456 | 3 | |||
| 0.1 | 3 |
Note: The error bars are uncorrelated uncertainties, obtained directly from the principal diagonal of the error matrix.
Therefore using the EXSAS package in MIDAS we have redone various kinds of spectral analyses with the PSPC data. The results are summarized in Table 2.
The two component fitting corresponds to cases 3 & 4 in Table 2; we give in Fig. 5 the pulse height spectra corresponding to these cases. Notice the very similar aspects of the two spectra, the first one corresponding to the low temperature Raymond–Smith model (top–case 3) and the second one to a power law (bottom–case 4). Both values of are practically the same, a clear confirmation that it is not possible to discriminate the actual physical process.
5 Modelling
The wavelet analysis of the HRI image leads to the following view: a strong emission corresponding to the cD galaxy position is superimposed on large scale emission obviously corresponding to the cluster itself.
5.1 Untangling the cD emission from that of the cluster
To overcome the problem of superposition of the cD on the cluster, we have tried various kinds of modelling. Notice that the “optical” cD galaxy is very large and thus its emission is not necessarily point-like with the HRI resolution.
We use a pixel–by–pixel maximum likelihood fitting procedure, taking into account all the properties of the PSPC or HRI (see a full description in PDGLS). In order to increase the signal to noise ratio, the data were binned to 10” pixels. The number of pixels is 17101 corresponding to a limiting radius 13 arcmin; this limit is imposed by the size of the HRI field. We have used the data after processing them following the Snowden (1995) cookbook. The statistics do not apply because of the low number of counts per pixel, so we used the more general maximum likelihood technique, assuming that the count distribution is poissonian.
The results are summarized in Table 3. In view of comparing models to one another, we have calculated the “distance” (noted ) between the observed number of photons and the synthetic number of photons per pixel.
These results raise the following comments (the numbers correspond to the “Notes” column in Table 3):
-
1.
In view of comparing the PSPC (see PDGLS) and HRI images of ABCG 85, we have fit a unique -model; we have found small values for and for the core radius, comparable to the values based on PSPC data.
-
2.
We have added to a -model a point-like structure i.e. the point-spread-function as given in the HRI Calibration Report (David et al. 1996); is then improved. The luminosity of the point-like component relatively to the main component is (up to 13 arcsec).
-
3.
We have used the sum of two -models. One is supposed to account for the large scale structure and the other for the cD. The larger component is probably due to the diffuse component (the overall cluster). The second -model would then really correspond to the cooling flow region, with a very small core radius and a higher density. The luminosity ratio between the inner and outer components is (up to 13 arcsec).
The best fit is obtained with two -models. When computing the emissivity profiles corresponding to this fit, we note that the larger and hotter component becames dominant at a radius of about 150 kpc.
5.2 Comparison of the central galaxies of ABCG 85 and cluster J2310–43
We first indicate the main general properties of the ABCG 85 cD compared to those of the central galaxy in cluster J2310–43. The main properties of these two galaxies, as derived from TTPR, from the literature and from our analysis are indicated in Table 4. The item number corresponds to that in the “remarks” column.
| J2310–43 | ABCG 85 cD | remarks | |
|---|---|---|---|
| Richness Class | 0 | 1 | |
| Redshift | 0.0886 | 0.0555 | |
| Type | D | cD | 1 |
| B–V | 1.19 | 1.04 | 2 |
| Power law index | |||
| Emission lines | no | no | 3 |
| Other emission | yes | yes | 4 |
-
1.
The cD aspect of the ABCG 85 BCM is determined principally because it is a giant galaxy with an envelope, but having a variation in the optical brightness profile slope between the core and the outer part (Colless, private communication). J2310–43 is described by TTPR as a D galaxy but with a halo; we therefore wonder if these two galaxies are really of different types.
-
2.
The (B–V) data come from TTPR for the central galaxy of J2310–43 and from the NED data bank for the ABCG 85 cD.
-
3.
A spectrum of the central galaxy of ABCG 85 kindly provided by Colless prior to publication does not show characteristics of an active galactic nucleus.
-
4.
The observations of ABCG 85 at radio wavelengths (e.g. Swarup 1984) show strong emission associated with the cD (cf. also Fig. 1). The Parkes-MIT-NRAO survey (Griffith & Wright 1993) associates a radio source with J2310–43.
The BCM galaxy of cluster J2310–43 studied by TTPR essentially has the properties which are normal for large ellipticals, but with a huge X-ray emission. These authors have fit its X-ray spectrum using a power-law with index . They concluded that this object is an example of a new class of objects and by continuity related its properties to those of BL Lacs.
TTPR have proposed various candidates which may belong to the same class of objects they have defined. Their study is essentially based on a PSPC observation, and they have pointed out the necessity to perform further investigations with the HRI, which we are doing here for ABCG 85.
The power-law spectra found in section 4 is very steep (slope ) but is certainly an artifact in the sense that a Raymond-Smith plasma model is also a good fit; in fact, in the PSPC energy range it is not possible to discriminate between the two kinds of spectra. From the strong radio emission associated with the ABCG 85 cD, one may suppose that there is some kind of nuclear activity in this galaxy, so that some X-ray emission may be related to the radio source.
However, the bulk of the central emission has a thermal origin: we have seen that the emission is not point-like (section 3.1), thus ruling out quasi-stellar emission, which would be expected for an “unusual” galaxy; the central X-ray emission is extended, and is surrounded by some small X-ray emitting sources (Fig. 4); it seems reasonable that the X-ray excess comes from a cooling flow.
5.3 Cooling flow
The emissivity of ABCG 85 is well modeled by two superposed -models, one of large extent (the cluster) and a more powerful one of smaller radial extent. The central emission has a dimension of kpc (section 3.1).
We use here the multi-phase cooling flow theory introduced by Nulsen (1986) and developed by Thomas (1988), Gunn & Thomas (1996) and Teyssier (1996). In this approach, we adopt a simple form of the deprojected emissivity profile (corrected for the instrumental response) given by:
| (1) |
with given in HRI pixels (5 arcsec). We use the temperature obtained with the PSPC (see PDGLS) to normalize our results and set the maximum temperature equal to 4.5 keV (which occurs at 220 kpc).
The multi-phase is characterized by the density distribution function in the phase space, , that determines the contribution of the densities to the mean density, . Following Thomas (1996), we take , where is a free parameter. We assume a power-law cooling function , and a fully ionized plasma.
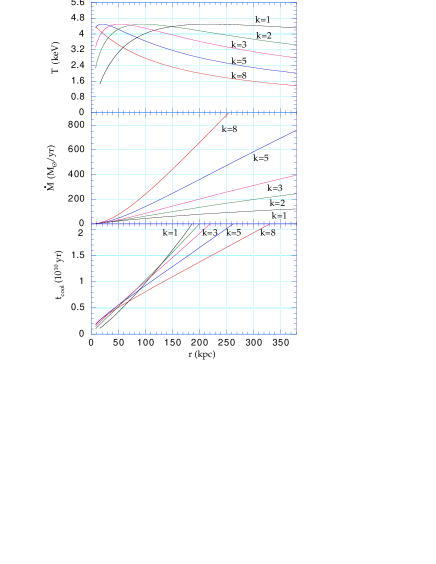
In Fig. 6 we present the results of the multi-phase cooling flow in ABCG 85, where we focus on the region where the cooling time , is smaller than the age of the cluster. In order to determine the maximum radius where the cooling is effectively important, we assume yr; this corresponds to a cooling radius, , varying from 140 to 220 kpc, depending on the value of the parameter . The top panel shows the predicted temperature profile. The temperature is not isothermal in the multi-phase model and, after reaching a maximum, decreases with radius (for the curve corresponding to , the decrease in temperature is beyond the limit shown in the figure). Taking into account the errors in the temperature measure, the curve may be shifted up or down by about 1 keV. For the maximum temperature is found very near the centre. The drop in temperature in the outer region for these values of seems incompatible with the PSPC observations (figures 8 and 10 from PDGLS), which favours .
The mass deposit, grows almost linearly with radius and reaches values ranging from to 150 M⊙/yr for .
Note that the above results depend on the deprojection of the 2D emissivity profile, especially near the centre. As noticed by Thomas (1996), a flat emissivity profile would imply higher values of . The multi-phase model is also particularly sensitive to the temperature profile, which could, in principle, be used to constrain the free parameter of the multi-phase model.
6 Discussion and conclusions
We have continued in this paper the study of ABCG 85 begun in Paper I (PDGLS ). Two other papers (Slezak et al. 1997 and Durret et al. 1997) are devoted to the photometric and redshift catalogues, while a third one (Durret et al. in preparation) will be devoted to the optical analysis.
In this paper we have made use of X-ray ROSAT HRI, optical and published radio data.
Observed by the ROSAT PSPC or HRI, the mean features of ABCG 85 are of course the same; but the better HRI resolution of a few arcsec (the size of a galaxy at the distance of ABCG 85) combined with the PSPC X-ray spectroscopy, optical information (2D+1D, imaging plus redshifts), and radio data provides the means to go one step further in understanding the physics of this rich cluster of galaxies.
The bulk of the X-ray emission comes from thermal bremsstrahlung due to the intra-cluster gas that extends over at least 800 kpc. Several other sources are superimposed on this overall emission.
Using a wavelet analysis, we were able to resolve an excess of X-ray flux in the centre at a scale of about 15–25 kpc). The central activity may be due to a cooling flow; the X-ray emissivity is indeed compatible with a multi-phase cooling flow model with a cooling radius of about 150 kpc and a mass deposit rate of 50–150 M⊙/yr. This cooling flow may also be triggering the strong central radio source activity and thus, a contribution of X-ray emission may be due to a non-thermal process. However this is in contradiction with the situation of the cluster J2310–43 D galaxy as proposed by TTPR. The interpretation we give for the X-ray emission for the cD of ABCG 85 casts some doubt on the interpretation of the cluster J2310–43 D galaxy as “unusual”, since these two galaxies seem to be similar. Nevertheless, high resolution observations of cluster J2310–43 are needed to verify whether or not its X-ray emission is point-like. If it is indeed unresolved at a scale of a few kpc, then the X-ray excess in cluster J2310–43 could hardly be explained as an extended cooling-flow.
A detailed analysis of the very central part confirms the existence of at least 3 small X-ray features (one in common with Prestwich et al. 1995). These features are most probably the sign of an inhomogeneous cooling flow, corresponding to cooler regions compressed by the hotter surrounding gas.
To the south of the main component, there is a blob coinciding with a small group of galaxies, among which the second brightest cluster member. This group of galaxies, however, does not appear to be a bound substructure: its velocity dispersion is too high, since it is actually comparable to the velocity dispersion of the whole cluster. We therefore interpret the south blob as a fortuitous and transient overdensity of galaxies. The short relaxation time scale of the intra-cluster gas explains the fact that we observe an X-ray envelope around the galaxies of the south blob. Note that part of the X-ray emission is connected to the galaxies themselves, such as galaxy K or the two interacting galaxies (257 and 255) which are also a radio source.
As already noticed by PDGLS, the wavelet analysis of the HRI image confirms that the main structure of ABCG 85 has two superimposed X-ray emitting sources to the west. By combining radio and optical information we may draw some conclusions on the physical mechanism accounting for these X-ray sources. One of them is related to the foreground structure around the radio Seyfert galaxy A85-F (also noted D in PDGLS). The X-ray excess at this position is therefore probably produced as a result of nuclear activity in A85-F. The other X-ray source is spatially related to radio emission but there is no galaxy in that location (although there is a foreground group of galaxies). Thus, if the radio emission is indeed due to relativistic electrons from a now extinguished active galaxy, the excess of X-ray emission here is non thermal, probably due to inverse Compton scattering.
Acknowledgements.
We thank J. Bagchi for enlightening discussions on the radio emission in clusters. GBLN acknowledges financial support from the Région Rhône-Alpes, France. We have also received financial support from the GDR-Cosmologie, CNRS.References
- [1] Andernach H., Sievers A., Kus A., Schnaubelt J. 1986, A&A Suppl. 65, 561
- [2] Burns J.O. 1990, AJ 99, 14
- [3] Condon J. J., Cotton W. D., Greisen E. W., Yin Q. F., Perley R. A., Broderick J. J. 1996, NCSA Astronomy Digital Image Library
- [4] David L.P., Harnden F.R. Jr, Kearns K.E., Zombeck M.V. 1996, “The Rosat HRI Calibration Report”, U.S. Rosat Science Data Center/SAO
- [5] Dickey J.M.,Lockman F.J. 1990, ARA&A 28, 215
- [6] Durret F., Felenbok P., Lobo C., Slezak E. 1997 A&AS submitted
- [7] Goldshmidt O., Rephaeli Y. 1994, ApJ 431, 586
- [8] Griffith M.R., Wright A.E. 1993, AJ 105, 1666
- [9] Gunn K.F., Thomas P.A. 1996, MNRAS 281, 1133
- [10] Kneer R., Böhringer H., Neumann D., Krautter J. 1996, MPE report 263, 593
- [11] Komissarov S.S., Gubanov A.G. 1994, A&A 285, 27
- [12] Nulsen P.E.J. 1986, MNRAS 221, 377
- [13] O’Dea C.P., Owen F.N. 1985, AJ 90, 927
- [14] Pislar V., Durret F., Gerbal D., Lima Neto G.B., Slezak E. 1997, A&A 322, 53
- [15] Prestwich A.H., Guimond S.J., Luginbuhl C.B., Joy M. 1995, ApJ 438, L71
- [16] Rué F., Bijaoui A. 1997, Experimental Astronomy in press
- [17] Slee O.B., Roy A.L., Andernach H. 1996, Aust. J. Phys. 49, 977
- [18] Slezak E., Durret F., Guibert J., Lobo C. 1997, A&AS in press
- [19] Snowden S.L. 1995, “Cookbook for analysis procedures for Rosat XRT/PSPC observations of extended objects and diffuse background” (Greenbelt: NASA USRSDC)
- [20] Struble M.F., Rood A.J. 1987, ApJ 271, 422
- [21] Swarup G. 1984, Journal of Astrophysics and Astronomy 5, 139
- [22] Tananbaum H., Tucker W., Prestwich A., Remillard R. 1997, ApJ 476, 83
- [23] Teyssier R. 1996, PhD Thesis, Université Paris 7
- [24] Thomas P. 1988, MNRAS 235, 315
- [25] Thomas P.A. 1996, Sissa preprint astro-ph/9610069
- [26] Waldthausen, H., Haslam, C. G. T., Wielebinski, R., Kronberg, P.P. 1979, A&A Suppl. 36, 237
Appendix A Appendix: the wavelet image reconstruction
The noise in the HRI image has been removed according to a multiscale strategy where only significant structures of different spatial scales are taken into account to compute a clean image. The key points of this wavelet-based technique are already given in PDGLS, so that only the modification included in the second version of the package is now discussed. In fact, this minor change from the technical point of view notably enhances the overall efficiency of the method.
As sketched out in PDGLS and fully described in Rué & Bijaoui (1997), objects with a typical size are identified in the wavelet space from the corresponding local maxima in the wavelet coefficients for this spatial scale. Extensive simulations showed indeed that this scheme yields accurate results for structure detection. However, as usual, the final test is always provided by the complexity of some images of the real world. Actually, faint but conspicuous diffuse components appeared to be missed by the algorithm when much brighter small-scale features were superimposed onto them, and a second iteration of the program was therefore necessary to detect such large-scale structures. An example of such a case occurred in the analysis of the ROSAT/PSPC image of ABCG 85: the intense peak of X-ray emission found at the location of the central cD galaxy forced us to run the code twice in order to detect the overall X-ray emission of the whole cluster of galaxies. So, despite the a priori good performances of this two-step method, one might conjecture that the final restored image could perhaps exhibit some unreal features caused by reconstruction errors due to this failure. A better solution was therefore necessary.
Bijaoui (private communication) solved this lack of sensitivity by changing the normalisation of the wavelet coefficients when the search for the local maxima is performed. The set of functions leading to the discrete wavelet transform can indeed be normalised so that the -norm or the energy is preserved. Although the latter is surely more widely used since the translations and dilatations of such an analysing wavelet define an orthonormal basis of , we decided to choose the former because the wavelet coefficients can thus be viewed as the difference between true smoothed versions of the data. But, as explained above, our wavelet-based search for structures relies on the detection of local maxima along the scale axis, and, from the image processing point of view, any efficient detection must involve the energy content of the wavelet coefficient rather than its amplitude. In fact, once this normalisation with respect to energy has been introduced for this crucial part of the algorithm, tests show that most structures are now detected in one step whatever their relative peak intensities and scales are. So, we made use of this improved program to remove the noise from the ROSAT images, applying it now twice only in order to bring out the faintest components.