The structure of galaxy clusters in different cosmologies
Abstract
We investigate the internal structure of clusters of galaxies in high-resolution N-body simulations of 4 different cosmologies. There is a higher proportion of disordered clusters in critical-density than in low-density universes, although the structure of relaxed clusters is very similar in each. Crude measures of substructure, such as the shift in the position of the centre-of-mass as the density threshold is varied, can distinguish the two in a sample of just 20 or so clusters; it is harder to differentiate between clusters in open and flat models with the same density parameter. Most clusters are in a quasi-steady state within the virial radius and are well-described by the density profile of Navarro, Frenk & White (1995).
keywords:
Galaxies: clustering — Cosmology: miscellaneous1 INTRODUCTION
The Virgo Consortium is an international collaboration whose aim is to investigate the large-scale structure of the universe via high-resolution N-body, hydrodynamical simulations. The ultimate goal is to relate the observed galaxy distribution to that of the matter fluctuations in the early universe and in particular to determine the biases between the two, both in position and velocity, on various scales.
As a first step, we have carried out pure N-body simulations using a large number of particles (256million) and four different Cold Dark Matter (CDM) cosmologies. Other papers will report on the clustering evolution of dark matter and dark matter halos, the topology of large-scale structure, strong and weak gravitational lensing properties, etc. .
In this paper we concentrate on the structure of galaxy clusters in our simulations. Because of our high-resolution, we can trace both the large-scale topology and the internal structure of the clusters simultaneously, finding a smaller variation in cluster properties between different cosmologies than are found in simulations of isolated clusters.
The main reason for studying the structure of galaxy clusters is to try to discriminate between different cosmological models. In critical-density universes clustering continues to grow to the present day, whereas in low-density universes it begins to decline after a redshift . This means that clusters in low-density universes are expected to be dynamically more relaxed and to have less substructure, steeper density profiles and rounder iso-density contours. Early results from simulations of isolated clusters showed strong variations of all three of the above properties with the cosmological density parameter, (e.g. Mohr et al. 1995, hereafter M95). We find a much weaker cosmological dependence. Although we do indeed find a higher proportion of disordered clusters in our critical-density simulations, the properties of relaxed clusters are very similar in all the cosmologies we examined.
M95 found much steeper density profiles for clusters in low-density cosmologies than in critical-density ones. Cen (1994) arrived at a similar conclusion, but the evidence is rather weak and may instead reflect a dependence on mass: there are many more massive clusters in his critical-density simulation than in his open ones. Subsequent studies (e.g. Jing et al. 1995, Crone et al. 1997) have shown that, when measured at radii enclosing the same mean overdensity, the slope of the density profiles of all clusters are fairly similar and, although they tend to be slightly steeper in low-density universes (i.e. the clusters are more isolated), this difference is unlikely to be detectable.
M95 also obtained very few elongated clusters in their N-body, hydrodynamic simulations of low-density universes but other studies find most clusters to be flattened in all cosmologies. Splinter et al. (1997) found no change in shape with . Jing et al. (1995) found a slight, but significant tendency for rounder clusters in low-density simulations, and the present work confirms this result.
The velocity dispersion profiles of clusters are another potential discriminant of the density parameter. Jing & Börner (1995) find that the velocity dispersion declines with radius significantly more rapidly in low-density than in critical-density universes (however the effect is hard to measure even with 100 redshifts per cluster). By contrast, we find that dynamically relaxed clusters in all our simulations are well-fit by the model of Navarro, Frenk & White (1995), in agreement with Huss, Jain & Steinmetz (1997). Moreover, we do not find a strong cosmological dependence for the anisotropy parameter as reported in Crone, Evrard & Richstone (1994).
Substructure (Richstone, Loeb & Turner 1992; Bartelmann, Ehlers & Schneider 1993; Lacey & Cole 1993) seems to be the best indicator of . Other measures merely reflect the different abundance of relaxed clusters whose properties are relatively independent of the cosmological setting. Pinkney et al. (1996) applied a wide variety of tests to simulations of merging and isolated clusters and concluded that there was no single statistic which was guaranteed to detect it: instead they recommend a battery of a dozen tests, depending upon the data available and the type of substructure it is desired to detect.
Crone, Evrard & Richstone (1996) found that a good test for discriminating between different cosmologies is the shift in the centre of mass of the matter contained within an iso-density contour as the contour level is varied and we concur with this (see Section 3.3). Other powerful indicators are moments of the squared-density distribution (Dutta 1995) or of the two-dimensional potential (Buote & Tsai 1995) or of the surface density (Wilson, Cole & Frenk 1996). One promising new method for detecting substructure is the ‘hierarchical clustering method’ which looks for dynamically bound associations of galaxies (Serna & Gerbal 1996, Gurzadyan & Mazure 1997): however, this is much more complicated to apply than the above tests and so we do not consider it here.
The above results are somewhat contradictory and confusing for several reasons: (i) variable mass resolution, (ii) different box-sizes: some clusters are isolated and some embedded within large-scale structures, (iii) different power spectra and methods of generating initial conditions, (iv) different mixtures of gas and dark matter, etc.. The data presented here provide a large sample of clusters covering about a decade in mass, drawn from large-scale simulations yet with a minimum resolution of more than 1000 particles within the virial radius. We feel that our cluster sample is much more homogeneous and representative of the real cluster population than those of previous studies.
The outline of the paper is as follows. The simulations and numerical method are described in Section 2, as is the method of cluster identification. The properties of the clusters and various statistical measures that describe them are presented in Section 3 and the prospects for discriminating between various cosmologies are assessed in Section 4.
2 METHODOLOGY
2.1 The simulations
| Label | |||||||
|---|---|---|---|---|---|---|---|
| OCDM | 0.3 | 0.0 | 0.21 | 0.7 | 0.85 | ||
| CDM | 0.3 | 0.7 | 0.21 | 0.7 | 1.30 | ||
| CDM | 1.0 | 0.0 | 0.21 | 0.5 | 0.68 | ||
| SCDM | 1.0 | 0.0 | 0.50 | 0.5 | 0.61 |
We report on the results of 4 simulations in this paper. Their properties are chosen to be as similar as possible, while spanning a range of cosmological parameters as listed in Table 1. The box-size is fixed at in each case, where the Hubble parameter, , is chosen so as to give a sensible age for the Universe (ranging from 11.5 Gyr for OCDM to 13.8 Gyr for CDM). The power spectrum is taken to be that of cold dark matter (CDM), where for three of the runs the shape parameter, , is set equal to the physically-motivated combination . In the fourth run, CDM, we take so as to give the same spectral shape as in the low-density models; this set of parameters could occur, for example, in a decaying-neutrino model (Efstathiou, Bond & White 1992)
It was our intention to choose the normalisation of the power spectrum, , so as to give approximately the same number of Abell clusters in each run (see, for example, White, Efstathiou & Frenk, 1993; Viana & Liddle, 1996; Eke, Cole & Frenk, 1996). In this we were only partially successful with a range of a factor of four in abundance; in fact, the normalisation is too large in all runs except OCDM. We have since repeated the other three runs with the correct normalisation but we choose to work with the original simulations in this paper as this gives a larger cluster sample: the properties of the individual clusters (as contrasted with their large-scale distribution) are almost independent of .
In run OCDM, the number of particles was only half that in the other simulations. Note, however, that the particle mass is intermediate between that of the other low-density run, CDM, and the critical-density runs.
The gravitational softening in each run was different (because of the different mass-resolution) but was never larger than . Here we will limit our discussion to scales greater than .
2.2 The numerical method
The initial conditions for the simulations were created by perturbing particles from a glass-like initial state (White 1996; see also Couchman, Thomas & Pearce 1995). The waves were drawn with random phases and amplitudes from a Gaussian power-spectrum (Bond & Efstathiou 1984) using the prescription of Efstathiou et al. (1985).
The initial state was evolved forward from using the Hydra code of Couchman, Thomas & Pearce (1995), the parallelisation of which is discussed in Pearce & Couchman (1997). The timestep was set equal to , where , , is the softening, the acceleration, the speed, and the subscript runs over all particles. The number of timesteps varied from 956 for the CDM run to just under 1305 in run CDM that has a smaller particle mass and softening. Energy non-conservation in each run, as measured by the divergence in the Layzer-Irvine integral, was approximately 1 percent.
2.3 Cluster identification
Observationally, clusters of galaxies are rather poorly-defined objects. The traditional optical selection criterion depends upon the surface density of galaxies, but this is prone to projection effects. In this paper we adopt a more theoretical viewpoint, defining clusters as sets of particles which exceed a given overdensity threshold.
The usual way to impose a density cut is to group together particles which lie within a certain distance, or ‘linking length’, (the ‘friends-of-friends’ approach: Davis et al. 1985). If this is set equal to times the mean inter-particle separation, ie , then the associated overdensity is approximately . In this paper we adopt a different approach whereby the density at the location of each dark matter particle is calculated by smoothing over 32 neighbours using a smoothed particle hydrodynamics (SPH) algorithm (see e.g. Hernquist & Katz 1989). This has the advantage of giving a continuous range of densities whose values are much less subject to Poisson fluctuation than the nearest-neighbour approach.
To identify clusters we first select those particles whose density exceeds some threshold, namely 180 times the critical density. In order to treat the various cosmologies in the same manner, we use only a fraction of the particles, chosen at random, at this stage (subsequent analysis uses all the particles). This ensures that each selected particle corresponds to the same mass, . We then create a minimal spanning tree of the data which can be truncated at a range of linking-lengths, such as that given above, to divide the particles into groups. In practice, any linking length between and a few times this gives the same division, except where two groups happen to lie very close together.
We define clusters in terms of an overdensity relative to the critical density because we wish to compare similar objects in each simulation. Eke, Cole & Frenk (1996) show that collapsed structures, in the spherical top-hat approximation, will have lower overdensities (relative to critical) in universes with . As the true value of the density parameter is unknown, however, we have no way of allowing for this in the observations.
| Label | ||
|---|---|---|
| OCDM | 90 | 720 |
| CDM | 208 | 730 |
| CDM | 377 | 690 |
| SCDM | 289 | 680 |
In principle we could search for groups down to relatively small masses. In this paper, however, we are interested only in rich clusters and so we choose a mass-cut of . The number of clusters in each simulation using this definition is listed in Table 2. Also shown is the mean 1-D velocity dispersion of clusters: these are similar in the different cosmologies which suggests that our selection criterion is a sensible one. The corresponding kinetic temperature is approximately 3 keV. The velocity dispersions are slightly higher in the low-density universes reflecting the fact that clusters in these cosmologies tend to form at higher redshift and hence be smaller and have a higher velocity dispersion for a given mass.
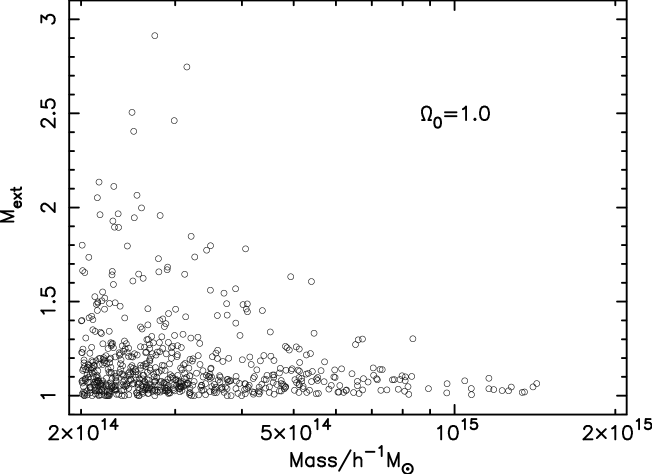
An alternative way to define clusters is in terms of the mass contained within a sphere of fixed radius. We find a close correlation between the mass of clusters defined by the overdensity technique described above and the total mass within an Abell radius centred on the cluster centroid, which suggests that there is little difference between the two selection methods. Figure 1 shows the correspondence for SCDM; the other cosmologies show similar behaviour.
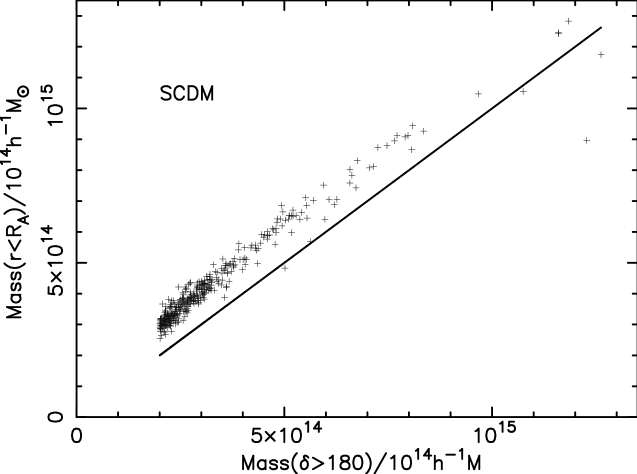
|
Throughout this paper we use the term ‘the mass of the cluster’ and the symbol as synonyms for the mass contained within an overdensity contour of 180 relative to the critical density.
3 RESULTS
3.1 Multiplicity function
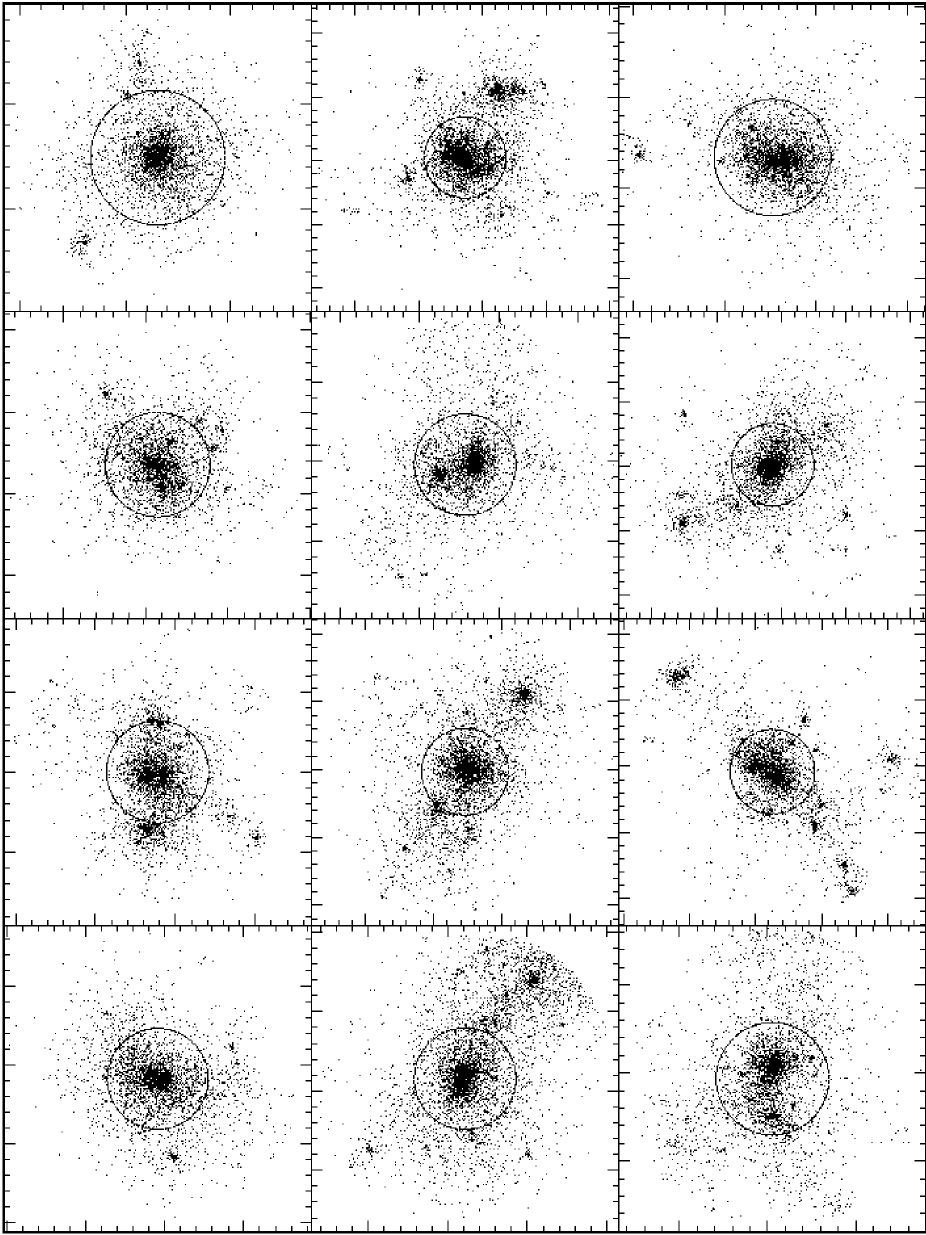
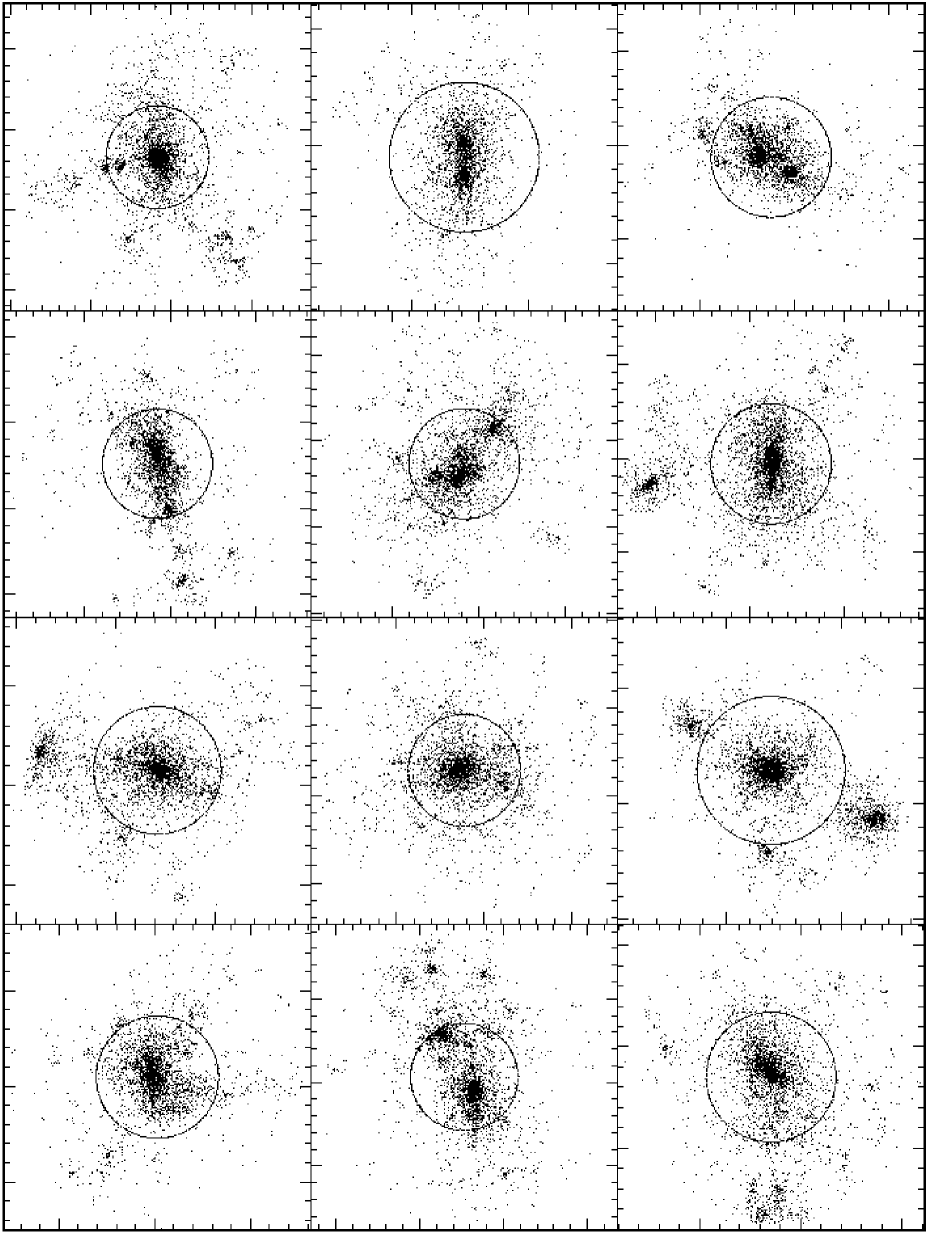
Theoretically, one of the most basic differences between clusters in critical and sub-critical density universes is that the latter should be more relaxed, having formed at a higher redshift. This should manifest itself in various ways, one being that these clusters should be more isolated and have less substructure. Visually there is little difference between clusters in the different cosmologies: Figure 2 shows some plots of clusters of mass 3–4 in the OCDM and CDM runs. Consequently, we define a statistic to quantify the degree of isolation of a cluster.
|
|
Example clusters from the CDM simulation. The circles represent an Abell radius.
Firstly we catalogue all groups of particles with overdensity greater than 180 times the critical density and which lie within 2 Abell radii of the cluster centre (this catalogue is obtained as a by-product of the method we use to identify clusters). Then we define a multiplicity statistic,
| (1) |
where is the total mass of all the groups and is the mass of the cluster.
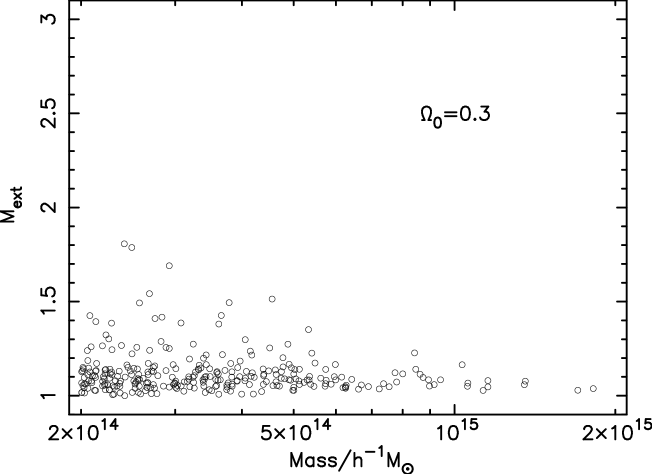
The majority of clusters are relatively isolated, with . However, there is a small fraction of clusters with larger values of and this fraction increases with decreasing mass. The two low-density simulations have identical distributions, as measured by a Kolmogorov-Smirnov test, as do the two critical-density universes. is plotted against mass for each pair of simulations in Figure 4 and a comparison of the two probability density distributions is shown in Figure 6. The critical-density simulations show a significantly higher fraction of clusters (approximately one quarter) which have neighbouring structures with a mass exceeding 20 percent of that of the cluster itself. Note, however, that there are few binary clusters (for which at least one of the pair would have ). We have checked that the differences in are not due to the different mass distributions of the two samples but are in fact present at both low and high masses.
|
|
Values of the statistic for clusters CDM and SCDM, combined.

|
3.2 Substructure
As well as being more isolated, clusters in low-density universes are expected to show less substructure. We measure this by another multiplicity statistic. For each cluster we start with the merger tree used in its definition and then gradually decrease the linking length, . This causes the cluster to break up into subclumps of higher-and higher overdensity. At each stage we define
| (2) |
where are the masses of the three largest groups. The maximum value of as is lowered by a factor of 4.64 (corresponding to a density increase of a factor of 100) is used as a measure of the number of subclumps (up to a maximum of 3) in the catalogue. We experimented with slightly different definitions for the multiplicity statistic but all gave similar results.
Once again the two and the two universes give similar distributions, this time with no mass-dependence. The probability distributions of the two pairs are compared in Figure 7. The difference between the two is significant with the latter showing more substructure. The mean values of are 1.28 and 1.53, respectively, and clusters in the critical-density models have twice the frequency of multiple cores (approximately 40 percent with 1.5 and 20 percent with ).

|
In combination, the and statistics show that there are very real differences in the degree of substructure between clusters in low-density and critical-density cosmologies. The question remains as to whether these differences would be detectable in practice. Crone, Evrard & Richstone (1996) suggested that the shift in the position of the centre-of-mass of matter contained within an iso-density contour, as the level of the contour is altered, would be a good discriminant. The projected shift, in units of the cluster radius, (defined in Section 3.3), is shown in Figure 8 for overdensities in the range 180–18 000. With a sample of just 20 clusters, these two distributions could be distinguished with 5 percent confidence. A very similar result is obtained by comparing the position of the centre-of-mass to that of the density maximum. Of course, the density contours of the dark-matter distribution are not directly measurable, but will be related to those of the X-ray emitting gas in a way which can be quantified by future simulations.

|
If one is restricted to observations of galaxies only, then the best measures of substructure may well be the hierarchical clustering methods of Serna & Gerbal (1996) and Gurzadyan & Mazure (1997). The latter find that the existence of 2–3 such subclumps is typical in a sample of clusters drawn from the ESO Nearby Abell Cluster Survey. Unfortunately their method is complicated to apply and will be deferred to a future paper.
3.3 Morphology
Continuing our theme of looking for evidence of relaxation in clusters in the low-density cosmologies, we next examine their shapes. M95 found enormous differences between the axial ratios in low-density and critical-density universes in their models with the former being much closer to unity. We define the semi-axes, , of each cluster in terms of the best-fitting ellipsoid, i.e. where the are the eigenvalues of the inertia tensor,
| (3) |
and the sum extends over all particles in the cluster (the normalisation is chosen so that for a uniform sphere the semi-axes are equal to the radius). The mean radius at which the overdensity equals 180 is .
Yet again the distribution of axial ratios in the two low-density simulations and in the two critical-density simulations are indistinguishable. The latter are significantly more elongated (as measured by a KS test) but only by a small amount. Figure 9 shows a histogram of the minor/major axis ratio for the two sets of runs. The mean value of the ratio is 0.50 in the low-density runs and 0.43 in the high-density runs. Thus there is a slight tendency for the clusters in low-density universes to be rounder than those in critical-density universes, that is consistent with them being slightly more isolated. There is also a weaker trend for high-mass clusters to be rounder than low-mass ones.

|
The three-dimensional shapes of the clusters in all cosmologies show a wide range of triaxialities, ranging from highly-prolate to highly-oblate. Figure 10 shows the distribution in ellipticity-prolateness space for SCDM (all are similar in appearance). The ellipticity is defined as
| (4) |
and the prolateness as
| (5) |

|
Given that the contours of X-ray emission will be rounder than the iso-density contours, it is extremely unlikely that observations will be able to distinguish between low-density and critical-density universes based simply on the degree of flattening of clusters.
More sophisticated measures of the morphology of X-ray contours are based on the moments of the squared-density distribution (Dutta 1995) or of the two-dimensional potential (Buote & Tsai 1995). These are more closely related to the degree of substructure and so are more sensitive to the density parameter. Using the latter method, Buote & Xu (1997) claim that SCDM is inconsistent with ROSAT observations of an, albeit incomplete, sample of bright clusters (Buote & Tsai, 1996).
We define power ratios in a similar way to Buote & Tsai (1995):
| (6) |
where
| (7) | |||||
| (8) |
Here are projected polar co-ordinates about the cluster centroid , is the density and the sum extends over all particles within 2 Abell radii.
| Samples | |||||||
|---|---|---|---|---|---|---|---|
| CDM | OCDM | 0.122 | 125 | 0.184 | 55 | 0.194 | 50 |
| CDM | 0.206 | 45 | 0.115 | 140 | 0.113 | 145 | |
| OCDM | 0.309 | 20 | 0.238 | 35 | 0.268 | 25 | |
As might be expected the values of the power ratios are lowest for OCDM (least substructure) and greatest for the two critical density models, CDM and SCDM. There is a slight tendency for high mass clusters to show more substructure, but this effect is smaller than the cosmological differences. The difference in the cumulative distributions of and the corresponding number of clusters required to distinguish the different cosmologies using a KS test are shown in Table 3; the critical-density models have been combined as they are indistinguishable. In contrast to Buote & Xu (1997), we find that is best able to distinguish low-density from critical-density models, whereas and do better at discriminating between CDM and OCDM. Of course the numbers in Table 3 assume a direct correspondence between the theoretical distribution of dark matter and the observed X-ray flux. This association needs to be checked and a practical application of the method is likely to require more clusters than is indicated here.
We have also calculated the first moment, , within an aperture centred on the density maximum. This gives similar results to because they both measure the dipole moment of the cluster.
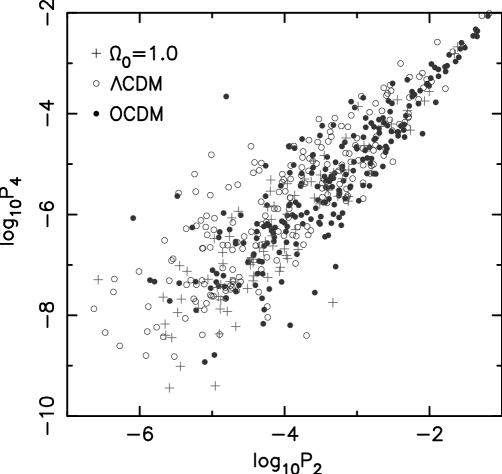
The different moments, or power ratios, are highly correlated. The strongest relation, shown in Figure 11, is between and . Interestingly the cosmologies and OCDM show a tighter correlation than CDM, that seems to extend to higher values of for a given . This may be another way to discriminate between models with and without a cosmological constant.
When we repeated the above tests for power ratios defined within an aperture of variable size, , proportional to the virial radius of the cluster, then the differences between clusters in the CDM and OCDM cosmologies were reduced, but the distinction between these and the critical-density universes was maintained.
|
3.4 Density profiles
Our final measure of the degree of isolation of a cluster is the slope of the density profile. We use the mean slope, , between the radius, , within which the mean density is 180 times the critical density (defined in Section 3.3), and 0.1 times this radius. Assuming a power-law density distribution in this range, then is defined implicitly as
| (9) |
where is the mass within radius .
is well-defined only for clusters with a fairly smooth density distribution and so we restrict the analysis to those with . Histograms of the distributions of for low-density and critical-density runs are shown in Figure 12. The two are marginally distinguishable: assuming perfect data one would need a sample of 90 clusters to distinguish the two at 5 percent confidence. The mean slopes are 2.45 and 2.40, respectively, consistent with our earlier conclusion that clusters in low-density universes are slightly more isolated (remember too that there are more clusters with substructure in the critical-density universes which have been omitted from the analysis).
These differences are less than have been found in previous work. M95 found to be much larger in open, low-density cosmologies than in flat ones, whereas Jing et al. (1995) found a weaker effect, but still larger than ours. We all agree that, for a given density parameter, clusters in open cosmologies are more isolated (i.e. have steeper density profiles) than those in flat cosmologies.

|
There is a weak trend of decreasing with increasing mass in low-density cosmologies and increasing with increasing mass in critical-density cosmologies. Thus low-mass clusters show greater differences in their slope than do high-mass ones. As our simulations are of larger volumes, and hence contain more high-mass clusters than previous studies, this may partly explain the smaller variation in that we find.
The mean values of are similar to that of the density profile of Navarro, Frenk & White (1995), shown by the arrow in Figure 12. This will be discussed further in the next section.
Using a fixed physical radius, rather than one defined in terms of overdensity is much less useful. Because in more massive clusters one is measuring the slope at a smaller fraction of the cluster radius, and because the density profile steepens with increasing radius, there is a decrease in with increasing mass. The measured slope then becomes strongly dependent upon the mass of the cluster sample.
It is inconceivable that the differences in slope, being much less than the spread in slopes even for the subset of smooth clusters, could be used to discriminate between different cosmological models.
3.5 Velocity dispersion profiles
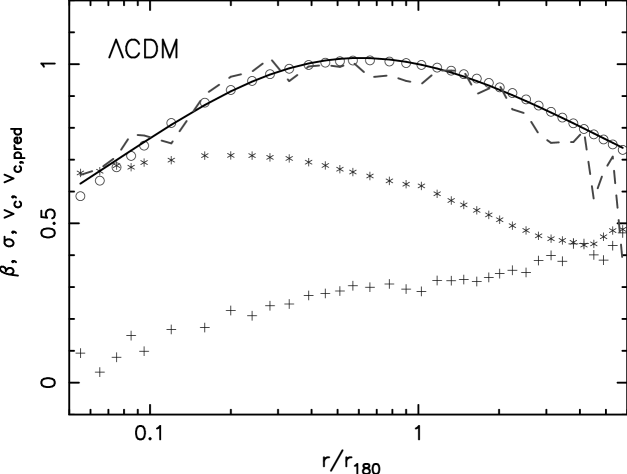
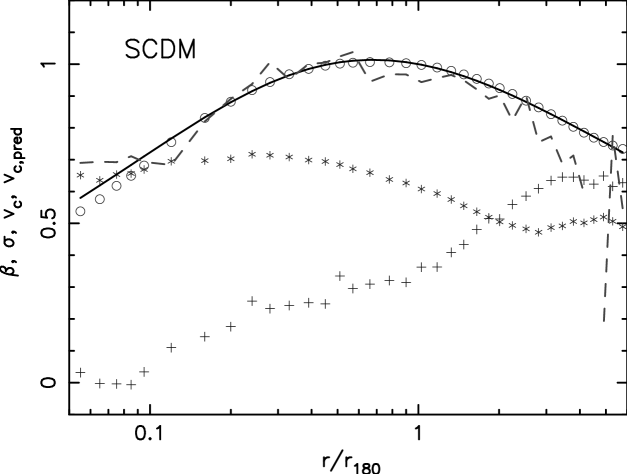
Figure 13 shows averaged velocity profiles for the clusters in cosmologies CDM and SCDM (the others are similar). In each case we have included only relatively smooth clusters with and have centred the profiles on the density maximum. The radii are scaled to the radius, (defined in Section 3.3), at which the density drops to 180 times the critical density, and all clusters are given the same weighting in the average. For an isothermal profile is a fraction of the virial radius (within which the mean overdensity is 180).
|
|
Velocity profiles for the combined sample of 97 SCDM clusters with . Legend as for CDM plot.
The circles in the Figure show the normalised circular velocity profiles, where is the mass contained within radius and is the total mass within . These have been fit by a function of the form
| (10) |
() corresponding to a density profile
| (11) |
where , and the characteristic radius and slope are parameters of the fit. For , Equation 10 must be modified slightly to
| (12) |
corresponds to the profile suggested by Navarro, Frenk & White (1995, hereafter NFW; 1996) to be a good fit to the galaxy clusters in their simulations, and to the model proposed by Hernquist (1990) for the halos of elliptical galaxies. The low-density models were fit over a range and the critical-density ones over a range . The lower radius in each case corresponds to about 60kpc, comfortably larger than the softening, and the outer radius was determined by the break in the velocity dispersion profile. The fits are shown in Table 4 and by the solid line in the Figure.
| Label | kpc | |||
|---|---|---|---|---|
| OCDM | 54 | 0.62 | ||
| CDM | 100 | 0.56 | ||
| CDM | 65 | 0.62 | ||
| SCDM | 97 | 0.57 |
In each case the extrapolated fit overestimates the circular speed within which implies that the inner density profile is shallower than ; this may, however, be due to the finite softening which ranges up to 30 kpc for the critical-density runs. The clusters in all but one cosmology follow the NFW profile closely over the range in which they are fitted: the CDM clusters would prefer a slightly shallower slope at but steepen at large radii to agree with the others.
The ‘concentration parameter’, , is around 6, in rough agreement with the values found by NFW for halos of this mass. The low-density cosmologies have higher values of reflecting the higher redshift of cluster formation.
The normalised velocity dispersion, , is shown by the stars in the Figure. In each case it rises gently out to 0.2–0.3, then declines at larger radii. The variation in within the virial radius is about a factor of three; similar temperature variations are seen in hydrodynamic simulations (e.g. Thomas & Couchman 1992). Jing & Börner (1995) found a significant trend for steeper velocity dispersion profiles in open cosmologies when measured at constant physical radii. We suspect that this trend may disappear if the profiles are normalised to , as in Figure 13. However, the effect is anyway quite weak for and so we will not pursue it here.
The variation of velocity dispersion with radius is not equal in each component. The anisotropy parameter, , where and are the radial and (1-D) tangential components of the velocity dispersion respectively, is shown by the crosses in Figure 13. The orbits are approximately isotropic in the core of the cluster but become increasingly radial as one moves out in radius. Contrary to the report in Crone, Evrard & Richstone (1994), we find no marked difference in the behaviour of the anisotropy parameter between different cosmologies.
It is usual to treat the central regions of clusters as in a quasi-steady state. We test this assumption by checking to see if the clusters satisfy the spherically-symmetric, steady-state Jeans Equation:
| (13) |
The value of predicted by this equation is shown by the dashed line in Figure 13. It is clear that the steady-state assumption is a reasonable one out to the virial radius.
3.6 Angular momentum
We measure the angular momentum of the clusters in terms of the dimensionless spin parameter,
| (14) |
where is the magnitude of the angular momentum, is the kinetic energy and is the mass of the cluster. The original definition (Peebles 1971) uses the total energy of the system rather than the kinetic energy, but this is much harder to determine and the two are equivalent for a virialised system.
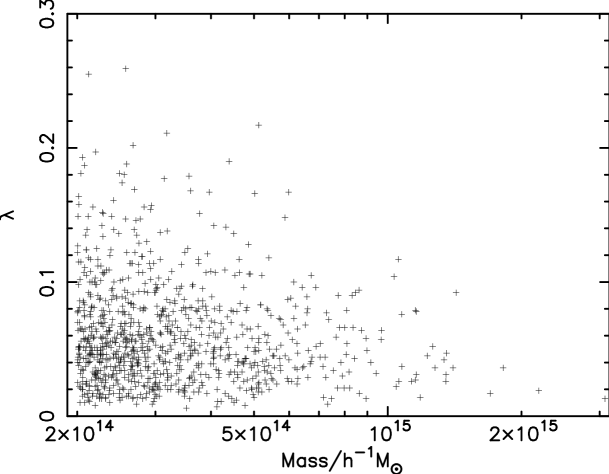
The distributions of are indistinguishable for each of our cosmologies and the combined sample is shown in Figure 15. The mean value of is 0.060 (the 10, 50 and 90 percentiles are 0.020, 0.051 and 0.108) but there is a significant trend of increasing mean and variance in as one moves to smaller masses.
|
4 CONCLUSIONS
We have examined the structural differences between clusters in simulations of four cosmological models. Our basic conclusion is that relaxed clusters have very similar properties in all cosmologies, but that there is a greater proportion of dynamically young clusters in critical-density universes than in low-density ones. It is hard to discriminate between low-density universes with and without a cosmological constant.
The best way to constrain the density parameter is to look for substructure in the cluster population. Thus, in Section 3.2 it was shown that clusters in critical-density simulations are much more likely to have multiple cores, and that a very simple test, the centre-of-mass shift as the density contour is varied, can distinguish the two in a population of just 20 clusters. The dipole moment of the squared-density (i.e. the power ratio, Section 3.3) requires a similar sample size.
Secondary measures of substructure, such as the shape of the iso-density contours, perform less well. The ellipticities we see (in agreement with other recent work) are substantially smaller than M95 originally suggested. This may, in part, be due to our larger boxes. Most of the clusters which we find appear to be located at the intersections of large-scale filaments: in this sense none of them are truly isolated and many are still forming today even in low-density universes.
The density and velocity-dispersion profiles of clusters have both been suggested in the past as cosmological probes. However, we have shown in Sections 3.4 and 3.5 that the profiles of relaxed clusters are very similar in all models we considered. They are in a quasi-steady state within the virial radius (that encloses a mean overdensity of 180), and are well-fit by the density profile of NFW. If we look at the complete sample of clusters, then the mean density and velocity dispersion profiles decline less rapidly in critical-density models that are less isolated and have less well-defined centres. However, we feel that this is a secondary effect and that it is better to look for substructure directly.
Some of the properties that we have investigated (such as the degree of isolation, the major/minor-axis ratio and the angular momentum) have a slight mass-dependence. Others, (such as the density and velocity-dispersion profiles) show more regularity when measured in units of the virial radius, rather than a fixed physical size. This suggests that some of the variation in cluster properties which have been reported in earlier work may be due to a variation in the multiplicity function in different cosmologies. The redshift evolution of the number density of clusters is also expected to show a strong cosmological dependence. This two topics will be investigated in subsequent papers.
ACKNOWLEDGMENTS
The simulations described in this paper were performed on Cray T3Ds at the RZG of the Max-Planck-Society in Garching and at the EPSC in Edinburgh as part of the Virgo Project, using an N-body only version of the Hydra N-body, hydrodynamics code (Couchman, Thomas & Pearce 1995; Pearce & Couchman 1997; collaboration supported by NATO CRG 970081). This paper was prepared using the facilities of the STARLINK minor node at Sussex. During its production, PAT was partly supported by a Nuffield Foundation Science Research Fellowship. CSF acknowledges a PPARC Senior Research Fellowship.
REFERENCES
Bartelmann M., Ehlers J.Schneider P., 1993, A&A, 280, 351
Bond R.Efstathiou G. P., 1984, ApJ, 285, L45
Buote D. A.Tsai J. C., 1995, ApJ, 452, 522
Buote D. A.Tsai J. C., 1996, ApJ, 458, 27
Buote D. A.Xu G., 1997, MNRAS, 284, 439
Cen R., 1994, ApJ, 437, 12
Couchman H. M. P., Thomas P. A.Pearce, F. R., 1995, ApJ, 452, 797
Crone M. M., Evrard A. E.Richstone D. O., 1994, ApJ, 434, 402
Crone M. M., Evrard A. E.Richstone D. O., 1996, ApJ, 467, 489
Crone M. M., Govertano F., Stadel J.Quinn T., 1997, ApJ, 477, L5
Davis M., Efstathiou G. P., Frenk C. S.White S. D. M., 1985, ApJ, 292, 371
Dutta S. N., 1995, MNRAS, 276, 1109
Efstathiou G. P., Bond J. R.White S. D. M., 1992, MNRAS, 258, 1P
Efstathiou G. P., Davis M., Frenk C. S.White S. D. M., 1985, ApJS, 57, 241
Eke V. R., Cole S.Frenk C. S., 1996, MNRAS, 282, 263
Gurzadyan V. G.Mazure A., 1997, preprint A&A, submitted.
Hernquist L., 1990, ApJ, 356, 359
Hernquist L.Katz N., 1989, ApJS, 70, 419
Huss A., Jain B.Steinmetz M., 1997, preprint Astro-ph/9703014
Jing Y. P.Börner G., 1995, MNRAS, 278, 321
Jing Y. P., Mo H. J., Börner G.Fang L. Z., 1995, MNRAS, 276, 417
Lacey C.Cole S. M., 1993, MNRAS, 262, 627
Mohr J. J., Evrard A. E., Fabricant D. G.Geller M. J., 1995, ApJ, 447, 8 M95
Navarro J. F., Frenk C. S.White S. D. M., 1995, MNRAS, 275, 720 NFW
Navarro J. F., Frenk C. S.White S. D. M., 1996, ApJ, 462, 563
Pearce F. R.Couchman H. M. P., 1997, preprint Astro-ph/9703183
Peebles P. E. J., 1971, A&A, 11, 377
Pinkney J., Roettiger K., Burns J. O.Bird C. M., 1996, ApJS, 104, 1
Richstone D., Loeb A.Turner E. L., 1992, ApJ, 393, 477
Serna A.Gerbal D., 1996, A&A, 309, 65
Splinter R. J., Melott A. L., Linn M. L., Buck C.Tinker J., 1997, ApJ, 479, 79
Thomas P. A.Couchman H. M. P., 1992, MNRAS, 257, 11
Viana P. T. P.Liddle A. R., 1996, MNRAS, 281, 323
White S. D. M., 1996, in Cosmology and Large-scale Structure, eds, Schaeffer R., Silk J., Spiro M.Zinn-Justin J.. Elsevier, p. 349
White S. D. M, Efstathiou G. P.Frenk C. S., 1993, MNRAS, 262, 1023
Wilson G., Cole S. M.Frenk C. S., 1996, MNRAS, 280, 199