OG 4.1.19
VERY HIGH ENERGY GAMMA RAYS FROM THE VELA PULSAR/NEBULA
T. Yoshikoshi1, T. Kifune1, S.A. Dazeley2, P.G. Edwards2,3,
T. Hara4, Y. Hayami5, S. Kamei5, R. Kita6, T. Konishi7,
A. Masaike8, Y. Matsubara9, Y. Mizumoto10, M. Mori11,
H. Muraishi6, Y. Muraki9, T. Naito12, K. Nishijima13,
S. Ogio5, J.R. Patterson2, M.D. Roberts1, G.P. Rowell2,
T. Sako9, K. Sakurazawa5, R. Susukita14, A. Suzuki7,
R. Suzuki5, T. Tamura15, T. Tanimori5, G.J. Thornton1,2,
S. Yanagita6 and T. Yoshida6
1Institute for Cosmic Ray Research, University of Tokyo, Tokyo 188, Japan
2Department of Physics and Mathematical Physics, University of Adelaide,
South Australia 5005, Australia
3Institute of Space and Astronautical Science, Kanagawa 229, Japan
4Faculty of Management Information, Yamanashi Gakuin University,
Yamanashi 400, Japan
5Department of Physics, Tokyo Institute of Technology, Tokyo 152, Japan
6Faculty of Science, Ibaraki University, Ibaraki 310, Japan
7Department of Physics, Kobe University, Hyogo 637, Japan
8Department of Physics, Kyoto University, Kyoto 606, Japan
9Solar-Terrestrial Environment Laboratory, Nagoya University, Aichi 464,
Japan
10National Astronomical Observatory of Japan, Tokyo 181, Japan
11Department of Physics, Miyagi University of Education, Miyagi 980,
Japan
12Department of Earth and Planetary Physics, University of Tokyo,
Tokyo 113, Japan
13Department of Physics, Tokai University, Kanagawa 259, Japan
14Institute of Physical and Chemical Research, Saitama 351-01, Japan
15Faculty of Engineering, Kanagawa University, Kanagawa 221, Japan
ABSTRACT
We have observed the Vela pulsar region at TeV energies using the 3.8 m
imaging Čerenkov telescope near Woomera, South Australia every year
since 1992. This is the first concerted search for pulsed and unpulsed
emission from the Vela region, and the
imaging technique also allows the location of the emission within
the field of view to be examined. A significant excess of gamma-ray-like
events is found offset from the Vela pulsar to the southeast by
about . The excess shows the behavior expected of gamma-ray
images when the asymmetry cut is applied to the data. There is no evidence
for the emission being modulated with the pulsar period – in contrast
to earlier claims of signals from the Vela pulsar direction.
1 INTRODUCTION
The Vela pulsar, PSR B, is an 89 msec pulsar and the brightest 100 MeV gamma-ray pulsar. The Crab pulsar and PSR B are also strong 100 MeV gamma-ray sources, and both have been detected as very high energy (VHE) gamma-ray sources (e.g. Weekes et al., 1989; Tanimori et al., 1994; Kifune et al., 1995). The emission from these VHE sources is apparently unpulsed and the acceleration site for the progenitor electrons is probably the shock generated by the pulsar wind colliding with circumstellar matter. There have been some claims111Their results were not confirmed by later observations (see Edwards et al., 1994). for pulsed VHE emission from the Vela pulsar (Grindlay et al., 1975; Bhat et al., 1987). However, with the exception of a short subset of Grindlay et al.’s data, only pulsed emission has been searched for in the previous VHE observations, and unpulsed gamma rays are likely emitted also from the Vela pulsar/nebula owing to a mechanism presumably similar as the Crab pulsar/nebula. The atmospheric Čerenkov imaging technique has made possible the search for unpulsed VHE gamma rays, and the CANGAROO 3.8 m telescope (Hara et al., 1993) is used for the first attempt of searching for unpulsed VHE emission from the Vela pulsar/nebula.
We have observed the Vela pulsar region by the CANGAROO 3.8 m telescope every year since 1992 and usable data were obtained in 1993, 1994, 1995 and 1997. The on-source data from 1993 to 1995 amount to about 174 hours in total, of which about 119 hours data remain after rejecting the data affected by clouds. Almost the same amount of off-source data has been taken night by night. The 3.8 m mirror was recoated in October 1996 and the reflectivity was improved from % to % at 480 nm (Wild et al., 1995). The 1997 data are still under analysis. Only the 1993 to 1995 data are used in the following analyses.
2 ANALYSES AND RESULTS
The analysis method is based on parameterization of the shape, location and orientation of Čerenkov images detected by an imaging camera (Hillas, 1985; Reynolds et al., 1993). The gamma-ray selection criteria in the present analysis are determined by Monte Carlo simulations to be , , , and . The simulations show that more than 99 % of background events are rejected after the above selections are made, while % of gamma-ray images from a point source remain.
First, we searched for a gamma-ray signal from the pulsar position and found a significant excess of on-source events above the background (off-source) level. However, the peak profile of the excess distribution against alpha was broader than expected from a point source. Next, gamma-ray emission was scanned from other positions than the pulsar position. The position of the maximum excess counts was found to be offset from the pulsar by about . Figure 1 shows the alpha distributions of the events from the position of the maximum excess counts after the other selection criteria have been applied.
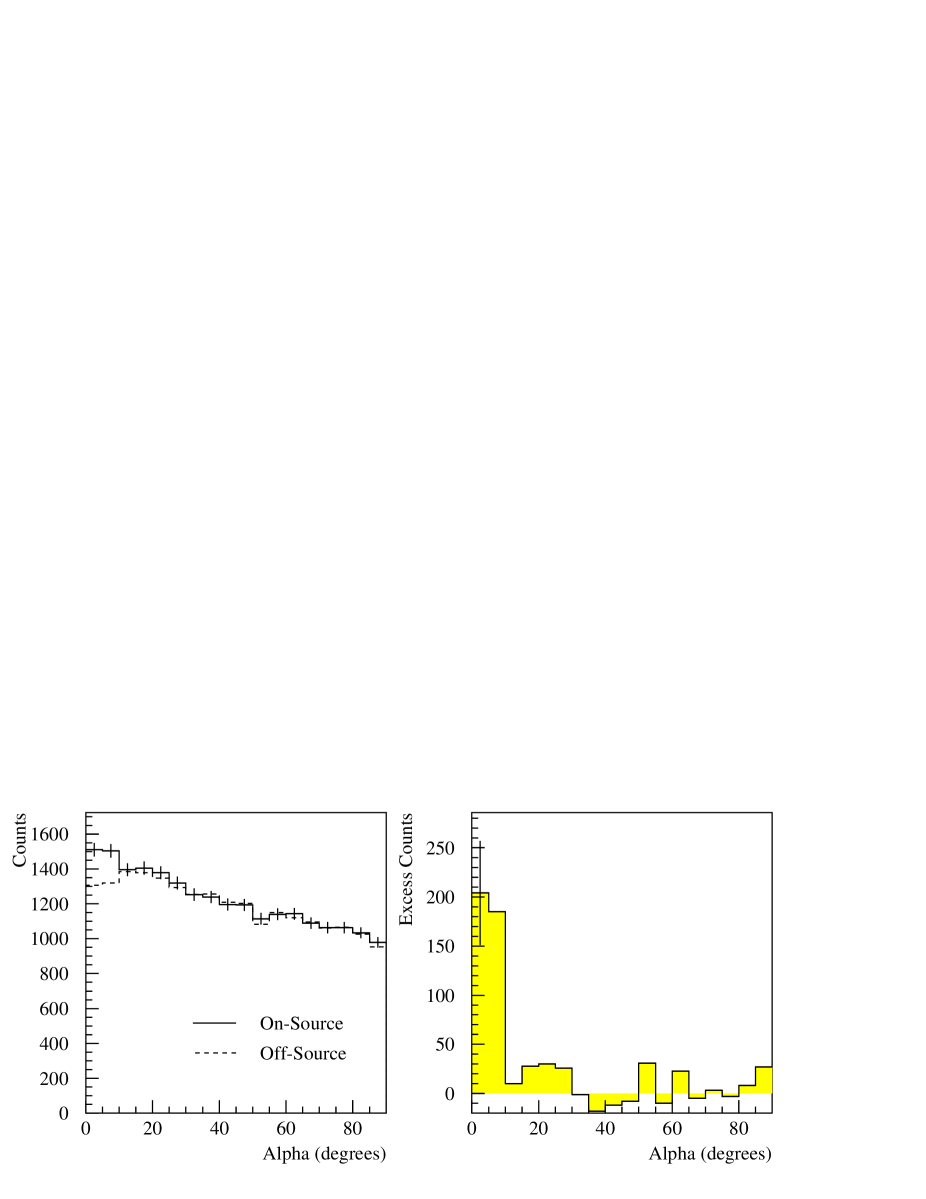
The statistical significance of the excess after including the selection of alpha is at the 5.2 level.
In the usual image analysis, the image parameters are calculated assuming gamma-ray images to have a simple elliptical shape. Gamma-ray images, however, are asymmetrical along their major axes, having an elongated, comet-like shape with the “tail” pointing away from the source position. This feature can be characterized and quantified by another image parameter called the “asymmetry” (Punch, 1993). From Monte Carlo simulations, about 80 % of gamma-ray images have positive values of “asymmetry”, while the distribution of background images is almost symmetrical because of their isotropic arrival directions in the field of view (Yoshikoshi et al., 1997). The asymmetry parameter was calculated assuming that the source lies at the position of the maximum excess counts, to examine the gamma-ray-like feature of the excess events. The asymmetry distribution of the excess events was found to be asymmetrical with the peak on the positive side as expected from the simulation. This result gives clear corroborative evidence that the detected excess events of Figure 1 are truly due to gamma rays. The significance of 5.2 for the excess counts in the alpha distribution of Figure 1 increases to 5.8 by adding to the gamma-ray selection criteria.
As an alternative method to calculating the alpha parameter, it is possible to infer and assign the true direction of a gamma ray from the location and orientation of its observed Čerenkov image. We have calculated a probability density for the true direction for each observed gamma-ray image using Monte Carlo simulations (Yoshikoshi, 1996). Thus, a density map of gamma-ray directions can be plotted against right ascension and declination by adding up all of the probability densities of the gamma-ray-like images. The contribution of the gamma-ray source in the field of view can then be found as an event excess in the on-source map over the background (off-source) map. Figure 2 shows the density map of the excess events for the Vela pulsar data plotted as a function of right ascension and declination.
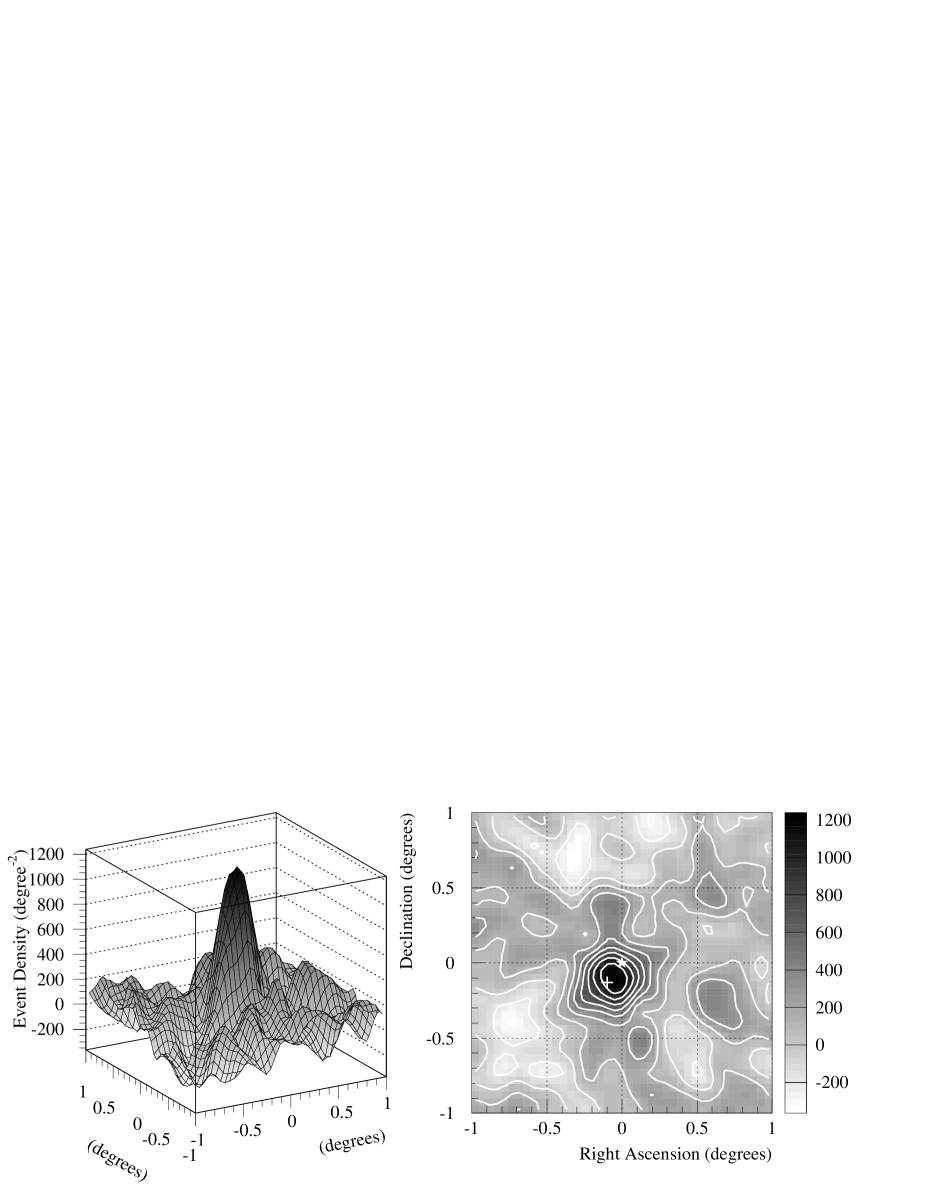
The significant excess due to a gamma-ray source near the pulsar exists in this map. The position of maximum emission is offset from the pulsar, which is indicated by the “star” mark in the contour map, to a position southeast by about . The alpha distribution of Figure 1 is plotted for the position of maximum emission. We have found a gamma-ray-like event excess also from the 1997 data with a significance of more than 4 and the position of maximum excess counts, indicated by the “cross” in Figure 2, agrees with that from the 1993 to 1995 data within the statistical error ().
The gamma-ray integral flux calculated for the position of the maximum excess counts is above 2.5 TeV, where the first and second errors are statistical and systematic respectively. The threshold energy, which we defined as the energy of the maximum differential flux of detected gamma-ray-like events, has been estimated from Monte Carlo simulations to be 2.5 TeV, assuming a power law spectrum with a photon index of . The systematic error for this threshold energy is about TeV, which is due to uncertainties in the photon index, the trigger conditions and the reflectivity of the mirror. The data have been divided to calculate year-by-year fluxes and the fluxes are consistent with no variation having been detected on the time scale of two years.
The periodicity of the events detected from the Vela pulsar direction and the direction of the maximum excess counts has been investigated using our 1994 and 1995 data for which the GPS receiver was available (Yoshikoshi et al., 1997). No significant value of the statistic (Buccheri et al., 1983) has been found for either the excess direction nor the pulsar direction.
3 CONCLUSION
We have observed the Vela pulsar region with the CANGAROO 3.8 m telescope since 1992 and found a VHE gamma-ray signal from the direction offset from the Vela pulsar to the southeast at the 5.8 level in the 1993 to 1995 data. This gamma-ray signal corresponds to the integral flux of above 2.5 TeV and is consistent with steady emission over the two years. No pulsed emission modulated with the pulsar period has been detected.
4 ACKNOWLEDGMENTS
This work is supported by International Scientific Research Program of a Grant-in-Aid in Scientific Research of the Ministry of Education, Science, Sports and Culture, Japan, and by the Australian Research Council. T. Kifune and T. Tanimori acknowledge the support of the Sumitomo Foundation. The receipt of JSPS Research Fellowships (P.G.E., T.N., M.D.R., K.S., G.J.T. and T. Yoshikoshi) is also acknowledged.
5 REFERENCES
-
Bhat, P.N., Gupta, S.K., Ramanamurthy, P.V., et al., A&A, 178, 242 (1987).
-
Buccheri, R., Bennett, K., Bignami, G.F., et al., A&A, 128, 245 (1983).
-
Edwards, P.G., Thornton, G.J., Patterson, J.R., et al., A&A, 291, 468 (1994).
-
Grindlay, J.E., Helmken, H.F., Hanbury Brown, R., et al. ApJ, 201, 82 (1975).
-
Hara, T., Kifune, T., Matsubara, Y., et al., Nucl. Inst. Meth. Phys. Res. A, 332, 300 (1993).
-
Hillas, A.M., Proc. 19th ICRC, 3, 445 (1985).
-
Kifune, T., Tanimori, T., Ogio, S., et al. ApJ, 438, L91 (1995).
-
Punch, M., Ph.D. thesis, National University of Ireland (1993).
-
Reynolds, P.T., Akerlof, C.W., Cawley, M.F., et al., ApJ, 404, 206 (1993).
-
Tanimori, T., Tsukagoshi, T., Kifune, T., et al., ApJ, 429, L61 (1994).
-
Weekes, T.C., Cawley, M.F., Fegan, D.J., et al., ApJ, 342, 379 (1989).
-
Wild, N., Dowden, S., Patterson, J.R. and Thornton, G.J., Proc. 24th ICRC, 1, 966 (1995).
-
Yoshikoshi, T., Kifune, T., Dazeley, S.A., et al., ApJ, submitted (1997).
-
Yoshikoshi, T., Ph.D. thesis, Tokyo Institute of Technology (1996).