A Search for Infall Motions Toward Nearby Young Stellar Objects
Abstract
We report observations of 47 candidate protostars in two optically thick lines (H2CO and CS ) and one optically thin line (N2H+ ) using the IRAM 30-m, SEST 15-m, and Haystack 37-m radio telescopes. The sources were selected from the redness of their spectra ( K) and their near distance ( pc). Most of the sources have asymmetric optically thick lines. The observed distribution of velocity differences, , is skewed toward negative (blue-shifted) velocities for both the H2CO and CS samples. This excess is much more significant for Class 0 than for Class I sources, suggesting that we detect infall motions toward Class 0 and not toward Class I sources. This indicates a difference in the physical conditions in the circumstellar envelopes around Class I and Class 0 sources, but does not rule out the presence of infall onto Class I sources by e.g. lower opacity gas. Bipolar outflows alone, or rotation alone, cannot reproduce these statistics if the sample of sources has randomly oriented symmetry axes. We identify 15 spectroscopic infall candidates, of which 6 are new. Most of these infall candidates have primarily turbulent rather than thermal motions, and are associated with clusters rather than being isolated.
1 Introduction
Low mass stars form by gravitational collapse of dense cores in molecular clouds. The collapse is believed to proceed from a condensed initial state (Larson 1969, Shu 1977) with a rapid development of a system consisting of a protostellar core which accretes mass from a disk and envelope. This gravitational collapse model can now be explored through detailed observations and numerical calculations. Observational studies of star-forming infall are indispensable to understand the kinematics of gravitational collapse onto young stellar objects (YSOs). This, in turn, is essential to study the origin of the initial mass function and of multiple systems. Observations are now beginning to probe a variety of size scales, density and temperature regimes in many sources.
In recent years, millimeter-wavelength observations have increased the evidence for infall motions onto nearby YSOs. The main procedure is to observe spectral lines that trace high densities ( cm-3) and have red-shifted self-absorption spatially concentrated around an embedded YSO. The spatial concentration and the use of dense gas tracers are important to ensure that the observed kinematic signature is associated with the YSO. For instance, Zhou et al. (1993) mapped the globule B335 in the and optically thick lines of H2CO and in the optically thin lines of C18O and C34S . They reproduced the line profiles on spatial scales of 0.02 pc from the source with an inside-out collapse model (Shu 1977). Choi et al. (1995) modeled the same B335 observations with a Monte Carlo radiative transfer code (Bernes 1979), confirming the numerical results from Zhou et al. (1993). Later Zhou (1995) modeled the observed H2CO and CS line profiles toward IRAS 16293-2422 as arising from a combination of infall and rotation, using the Terebey, Shu & Cassen (1984) collapse model. The case for infall motions in these sources is strong because of the detailed observations and modeling that has been done on them. However, in such a small sample of candidates, peculiarities of source structure and kinematics (eg, outflows or rotation) could possibly account for the apparent signatures of infall. Therefore, these well studied cases are not sufficient by themselves to support a claim for observed infall motions onto a wide class of sources.
Another approach to search for infall evidence is to observe a statistically large sample of sources in two lines tracing high density gas, one optically thick and the other optically thin. In such a sample, rotation and bipolar outflow motions having symmetry axes in random orientations would tend to produce optically thick line profiles with equal numbers of red-shifted and blue-shifted self-absorption. On the other hand, infall motions in centrally concentrated regions would only produce red-shifted self-absorption in the line profiles (Leung & Brown 1977). A spectral line survey of a large source sample should reveal whether there is a statistically significant excess of sources with red-shifted or blue-shifted self-absorption. This approach does not depend much on the details of the models, but mainly on whether there is a prevalence of inward or outward motions. At the same time such a study can yield a list of collapse candidates for further detailed studies. Recent surveys aimed to find candidate collapsing YSOs include Mardones et al. (1994) which used the C3H2 line; Wang et al. (1995) who observed the H2CO line in a sample of Bok globules, and Gregersen et al. (1997) which used HCO+ 4–3 and 3–2 lines in a sample of Class 0 sources (Andre, Ward-Thompson & Barsony 1993). None of these surveys has emphasized the statistical properties of the samples because of the limited number of targets observed.
In this paper we present the results of a molecular line survey toward 47 of the reddest nearby YSOs, more than twice the number of sources in any of the previous surveys. In section 2 we discuss our source selection criteria, the molecular lines and the telescopes we used. In section 3 we describe the normalized velocity difference () between the peaks of optically thick and thin lines, as a quantitative measure of the line profiles. We then analyze statistically the distribution of for different molecular lines and source subsamples. In section 4 we interpret the statistics kinematically. Finally, we summarize our conclusions in section 5.
2 Observations
2.1 Source Sample
The sources were selected solely based on their observed spectral energy distribution (SED) and estimated distance from the Sun in order to be unbiased with respect to prior knowledge of their molecular line shapes. To select the youngest sources (best infall candidates) we used the bolometric temperature (Tbol; Myers, & Ladd 1993) whenever known, otherwise estimated Tbol based on IRAS and submm continuum observations. Tbol is defined as the temperature of a black body with the same mean frequency as the source spectrum. Chen et al. (1995) found that Class 0 sources have K, and Class I sources (Lada & Wilking 1984) have K. We imposed a limit of K to select the most embedded Class I and Class 0 sources. We relied mostly on the papers by Ladd, Lada, & Myers (1993) in Perseus and Chen et al. (1995, 1996) in the Taurus, Ophiuchus, Chamaeleon, Lupus and Corona Australis star forming clouds for determination of Tbol. Chen et al. required the source fluxes to be known in at least 6 different wavelengths in order to compute accurate values of Tbol. That condition is easily met by most IRAS sources which have also been detected at optical or near-infrared wavelengths. However, many of the most embedded Class I sources and most Class 0 sources do not satisfy that requirement. Only a handful of Class 0 sources have been observed in enough different mm and submm wavelengths to make a good determination of Tbol possible (eg. B335 and L1527, Ladd et al. 1991). We therefore added sources to our list based on more relaxed criteria in order to have a larger sample of the youngest known nearby YSOs.
We required IRAS point sources in our sample to have rising spectra between 25 and 100 m (with flux ratios 2–4 for wavelength pairs of , and m), and to be located close to the centers of their parent molecular cloud core maps. These conditions are necessary to exclude galactic cirrus and extragalactic objects which may have high m flux ratios. We also added sources with known bright mm or submm continuum emission, and nearby Class 0 sources known to us by mid 1995. We consulted Casali et al. (1992) for submm continuum observations in Serpens, and Henning et al. (1993) and Reipurth et al. (1993) for submm continuum observations toward southern PMS stars. We also consulted Persi et al. (1990), Carvallo et al. (1992) and Bourke et al. (1995) for IRAS and near-infrared observations of southern PMS stars, many of them located in Bok globules. We determined Tbol for all the sources detected in at least three different wavelengths to include sources not quoted in Chen et al. (1995, 1996). The derived values of Tbol for sources with poor wavelength coverage are upper limits if they lack long wavelength fluxes, and lower limits if they lack short wavelength fluxes. Because of our selection criteria, we are confident that K in all sources in our sample. To determine a representative systematic error in Tbol in sources with poor short wavelength spectral coverage, we determined Tbol including and excluding wavelengths shorter than 60 m in sources with good spectral coverage. We found that the error in Tbol when neglecting wavelengths shorter than 60 m is typically K for sources having K. Our determination of Tbol is consistent with the values given by Gregersen et al. (1997) also with limited wavelength coverage.
Table A Search for Infall Motions Toward Nearby Young Stellar Objects lists all the sources detected in at least one optically thin and one optically thick line. Columns 1 and 2 identify the source, columns 3 and 4 list the observed coordinates (B1950.0), column 5 lists the distance from the Sun in pc, column 6 lists Tbol, and column 7 the number Nλ of continuum fluxes used to derive Tbol. We give lower or upper limits to Tbol rather than values for the sources IRAS 03282+3035, HH211mm, VLA1623, and S68N due to lack of wavelength coverage close to the peak of their spectral energy distributions. Although these estimates are crude, they are sufficient for our analysis in section 3, since we only need to know whether Tbol is below 70 K or not. Column 8 lists the references we consulted to determine values of Tbol. Finally, column 9 indicates whether there is outflow evidence from the source either as high velocity molecular line wings (CO) or as shock fronts (HH).
Even though we did not use the outflow properties as a source selection criterion, 87% of the sources in Table A Search for Infall Motions Toward Nearby Young Stellar Objects actually show evidence of driving an outflow. This is expected when selecting the most embedded sources, since they tend to drive strong molecular outflows (Bontemps et al. 1996). YSO outflow models usually require mass infall onto an accretion disk (see references in Bachiller 1996), so there is reason to expect that most sources in this survey must have infalling envelopes. However, we emphasize that in this paper we are seeking to examine direct kinematic evidence for infall motions onto the sources.
We did not detect 19 of the sources from our initial target list in either the H2CO line, the N2H+ line, or both. Table A Search for Infall Motions Toward Nearby Young Stellar Objects lists the positions and rms noise (main beam brightness temperature) of the undetected lines for reference. We detected the N2H+ line toward the sources IRAS 11436-6017 and GSS30-1, but it was too weak for a good velocity and width determination (peak of 0.15 and 0.3 K respectively). We note that the average Tbol of these sources in Table A Search for Infall Motions Toward Nearby Young Stellar Objects is higher than that of the detected sources listed in Table A Search for Infall Motions Toward Nearby Young Stellar Objects. In fact, sources with K in Table A Search for Infall Motions Toward Nearby Young Stellar Objects were easily detected in all the observed lines.
2.2 Lines
It is important to observe both optically thick and optically thin lines in order to distinguish double-peak profiles produced by optical depth effects from those due to two velocity components along the line of sight. The observed molecules should have a high dipole moment in order to be sensitive to the high density gas in the immediate neighborhood of the YSO and not to the more extended, lower density gas surrounding the parent cores. Also, the molecular species should be abundant in molecular cloud cores, but unaffected by peculiar chemistry effects. For example, SiO and CH3OH are well known for their enhanced abundances by many orders of magnitude in the outflow lobes of some YSOs (e.g. Bachiller 1996), presumably due to desorption of molecules from grain mantles in shock fronts.
Following these criteria, we chose the CS ( Debye) and H2CO ( Debye) molecules to carry out the survey observations. H2CO was our first choice molecule, following the example of Zhou et al. (1993). The abundance of H2CO is known to be only moderately enhanced in bipolar outflows (Bachiller, & Pérez 1997). We subsequently observed part of the survey in the CS molecule in order to check that our results were not being biased by peculiar chemistry in low mass star forming regions. We believe the CS and H2CO lines are generally optically thick because of the observed brightness temperatures and line shapes. In a few cases, when the line is weak (T K) and approximately of Gaussian shape, it is likely to be optically thin (eg. L673A, 04325+2402, L1172; see figs. 1,2).
Ideally, one would observe an isotope of the optically thick tracer molecule as the optically thin tracer. Then both lines would probe the same density, temperature and chemistry, and would be observed with essentially the same angular resolution. However, the 2-mm HCO and the 3-mm C34S lines are in general too weak for accurate determination of line velocities in a large source sample. We chose to observe the N2H+ J= line instead ( Debye). This molecule has seven hyperfine components, in two groups of three lines and one isolated component (). Caselli, Myers, & Thaddeus (1995) determined the frequencies of all components with a precision of 6 kHz (0.02 km s-1). The hyperfine structure of N2H+ also permits a determination of the optical depth in the line, thus, allowing an internal check on the thinness of the isolated N2H+ line. Caselli et al. showed that among the seven components, only two show any evidence of anomalous excitation ( and ), and that these anomalies represent a departure of from the value expected in LTE. Any such small anomaly in hyperfine line ratios is included in the estimated uncertainty of the optical depth. This uncertainty is generally much smaller than the estimated optical depths. Womack, Ziurys, & Wyckoff (1992) found that the N2H+ J= line is narrow in dark clouds, with no evidence of line wings. The N2H+ line-widths and hyperfine components make it an ideal probe of the systemic velocity toward young stellar objects.
2.3 Telescopes
We used the IRAM 30-m telescope in Pico Veleta, Spain, in 1995, May 10–12. We observed simultaneously in the 2 and 3mm atmospheric windows with receivers tuned to the ortho H2CO (140.839518 GHz) and N2H+ (93.176265 GHz) lines respectively. The line rest frequencies were taken from Lovas (1991) and Caselli et al (1995) respectively. The backend had a digital correlator with spectral resolutions of 20 and 10 kHz at 2 and 3mm wavelengths respectively (0.04 and 0.03 km s-1). We used overlap frequency switching by MHz because this method is efficient and ensures that the observed line profiles are free of emission from an off-position. We checked pointing regularly with continuum sources and found it good to better than 5′′. Typical system temperatures were 400 K at 2-mm and 350 K at 3-mm. The main-beam efficiency at 93 and 141 GHz was taken to be 73% and 55% respectively.
We used the SEST 15-m telescope in La Silla, Chile, in 1995, September 19–20 and September 24, to observe simultaneously the same 2-mm and 3-mm H2CO and N2H+ lines as with the IRAM 30-m telescope. The weather was excellent, with system temperatures around 150 K in both lines. We splitted the high resolution acousto-optical spectrometer into two bands, providing a spectral resolution of 43 kHz in each band (0.138 km s-1at 93 GHz and 0.11 km s-1at 141 GHz). The acousto-optical spectrometer sometimes produces spurious emission features in the central 3-5 channels; so to avoid interference with the observed spectral lines, we centered the spectrometer off the rest velocity of each source by 2–8 km s-1. We also observed a subsample of sources in the para H2CO transition at 145.602953 GHz and the C34S transition at 96.412982 GHz. We used main beam efficiencies of 74% at 93 GHz and 96 GHz, 68% at 141 GHz, and 67% at 145 GHz as indicated in the SEST handbook.
In 1995, December 7–11 and 29–31, we used the NEROC Haystack111Radio astronomy observations at the NEROC Haystack Observatory of the Northeast Radio Observatory Corporation are supported by a grant from the National Science Foundation. 37-m telescope to observe the sources visible from Haystack in the CS 2–1 line at 97.980968 GHz. We observed left and right circular polarizations simultaneously with two SIS receivers. The backend had a digital correlator which we used with 17.8 MHz bandwidth and 13 kHz spectral resolution (0.04 km s-1). Typical system temperatures were 200 K. The antenna main beam FWHM at 98 GHz (21′′) compares well with the IRAM 2-mm and 3-mm beams. We measured a main beam efficiency of by scaling spectra of IRC+10216 to those taken at the IRAM 30-m telescope by Mauersberger et al. (1989).
3 Results
3.1 Variety of Observed Spectral Line Profiles
Figure 1 shows the observed spectra toward all the Class 0 sources ( K) in our sample ordered by right ascension, and figure 2 the spectra obtained toward the Class I sources ( K). The N2H+ line is drawn at the bottom of each box; H2CO in the middle, and CS at the top if it was observed. In a few sources, such as IRAS 16244-2422, the N2H+ line is very weak, but the velocity (dashed line) is sufficiently well determined because it is based on all seven hyperfine components, not just the one shown. We find a wide variety of spectral line profiles in the H2CO and CS lines in our sample: double-peaked, with a peak and a “shoulder,” and single symmetric lines. In addition, many sources have high velocity wings associated with unbound motions (outflows).
The CS and H2CO line shapes differ from source to source, but are usually similar to each other. The N2H+ line, on the other hand, is Gaussian toward almost all sources. In sources with symmetric H2CO and CS lines, their peak velocity lies very close to that of the N2H+ line. In sources with double peaked H2CO and CS lines, the N2H+ peak velocity lies between the two peaks (or between the peak and the shoulder), indicating that the complex H2CO and CS line profiles arise from self-absorption at low velocities. As a proof of the lower optical depth of N2H+ we derive optical depths in the line in 93% of the sources, and in all of them.
In most Class I sources, the H2CO and CS lines are broader than the N2H+ line, but all three line profiles are essentially symmetric showing no evidence of self-absorption (Fig. 2). On the other hand, many of the observed CS and H2CO profiles toward the Class 0 sources show evidence of self-absorption. The H2CO and/or CS spectral profiles are asymmetric with respect to the N2H+ center velocity in 15 out of 23 Class 0 sources (Fig. 1). Most of these asymmetric profiles have peaks whose velocity is significantly blue-shifted, rather than red-shifted, from the velocity of the optically thin N2H+ line. This high incidence of self-absorption toward Class 0 sources is similar to what Gregersen et al. (1997) found in HCO+ lines.
Besides the variation in line shapes discussed above, the line widths vary by a factor of five over our source sample. For example, the FWHM of the N2H+ line varies from 0.3 km s-1 in Taurus to 1.8 km s-1 in Serpens. This is important to bear in mind when we use the peak velocity shift between lines to compare different sources in the following section.
3.2 Quantifying Spectral Line Asymmetries
To study the distribution of line profiles statistically, we need to quantify the observed line asymmetries. To do this, we define the non-dimensional parameter
| (1) |
the velocity difference between the peaks of the optically thick and thin lines, normalized by the FWHM of the thin line. We use the normalized velocity difference rather than the velocity difference to reduce bias arising from lines having different width from one source to the next. This is a significant effect in our sample, as discussed above, and the normalization ensures that two lines of the same shape will have the same measure of asymmetry even if they have significantly different widths. To compute , we first fit a Gaussian to the brightest peak of the optically thick line to define its velocity (). We then fit seven Gaussian hyperfine components to the N2H+ line using the line parameters derived by Caselli et al. (1995); this gives the N2H+ velocity and FWHM ( and ).
We believe that is a more convenient and robust measure of the line asymmetry than the even-odd component decomposition (Mardones et al. 1994), the shift in line centroid (Adelson, & Leung 1988; Walker, Narayanan, & Boss 1994), the ratio of blue to red peak brightness (Myers et al. 1995), and the line skewness (Gregersen et al. 1997). The even-odd decomposition is too sensitive to the choice of reference velocity, and the line centroid is too sensitive to the choice of velocity window. The ratio of blue to red peak brightness cannot be used for lines where a second peak is not well defined. The skewness is much more sensitive than is to asymmetry in the line wings, which may be due to outflow, not infall motions. On the other hand, the adopted has the disadvantage that it is ambiguous for double-peaked lines with nearly equal peak intensities. In our sample this occurs in only 3 sources in the CS line (IRAS 16293-2422, L483 and Serp-S68N) and one source in the H2CO line (L483; see fig. 1). In the CS spectra, the ratio of the blue–red temperature difference to the rms noise () is 3.7, 3.0, and 0.8 in the sources IRAS 16293-2422, L483, and Serp-S68N respectively, and in the L483 H2CO spectrum the same ratio is 2.4. We regard a ratio of 2.0 or less as insignificant, so we drop the CS line in Serp-S68N from the sample.
We investigated alternatives to fitting Gaussians to obtain the velocity of peak emission for the optically thick H2CO and CS lines. We explored measuring the velocity of the peaks directly from the spectra, calculating the moments of the spectra, and finding the velocity of the peak of the cross-correlation of the optically thick and thin line profiles. For simple lines all methods agree to within the rms uncertainty in center velocity due to noise. We adopt the direct fit method because it appears slightly more robust than the cross-correlation or first moment methods for sources with significant wing emission. In the optically thin N2H+ J=1-0 line, the results of fitting seven Gaussian hyperfine components and of fitting a single Gaussian to the isolated line are consistent to within 0.01 km s-1, but the error in the former is smaller.
Table A Search for Infall Motions Toward Nearby Young Stellar Objects lists our main survey data: the observed velocities in the ortho-H2CO , CS , and N2H+ lines, and the values of and computed from these velocities, as in equation 1. Table 4 lists the observed velocities in the smaller sample of para-H2CO and C34S lines, which we observed as consistency checks. The velocity error estimates from the fitting routines are usually smaller than the channel width (except in low signal to noise spectra). We quote either one half the channel width or the Gaussian estimate as the error in our peak velocity determinations, whichever is bigger. The error in is usually dominated by the error in the optically thick line profile velocity. This error is typically 0.03 km s-1 and is always smaller than 0.11 km s-1.
3.3 Distributions of Normalized Velocity Differences
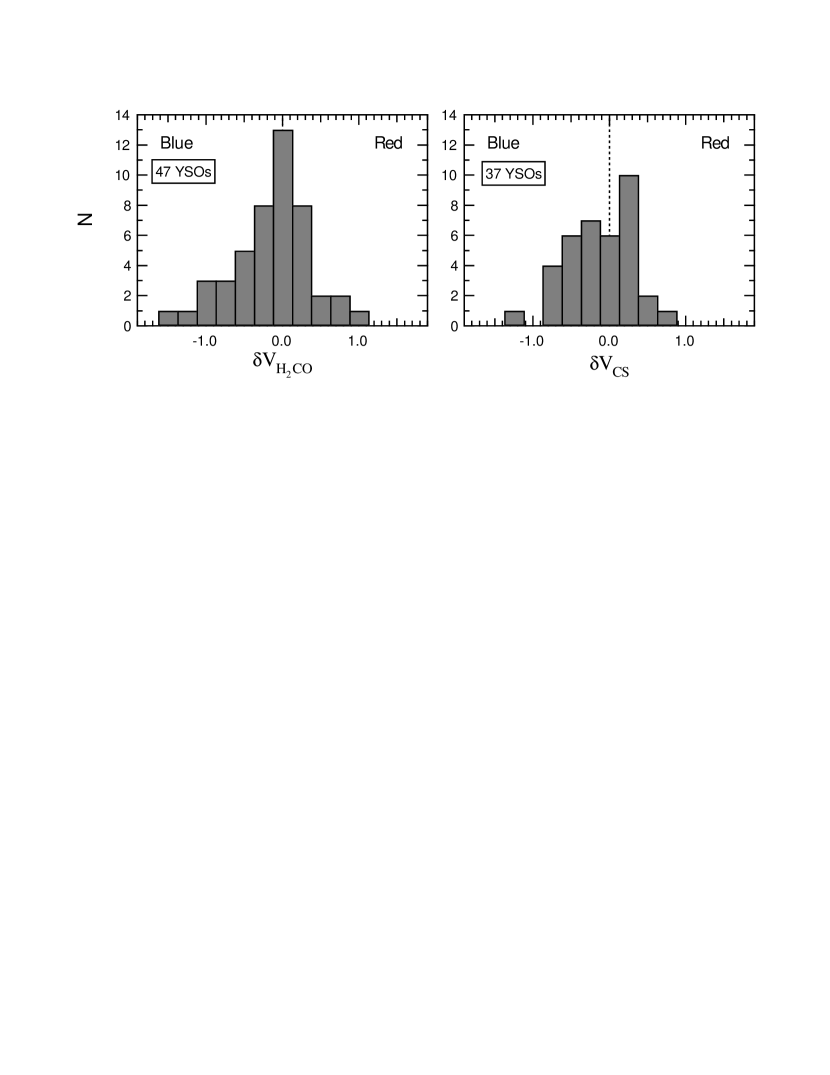
Figure 3 shows histograms of the distribution of and . The IRAM observations were used in figure 3 whenever sources were observed with both the SEST and IRAM telescopes because of the better spectral and spatial resolution (ie. each source is counted once). The histograms are clearly skewed towards negative velocities. This can also be seen from the means and standard errors of the mean of the distributions , and , given in Table 5. We now explore the statistical significance of this result.
We use the Student’s t-test for a sample with unknown spread to compare the distributions with a zero-mean normal distribution (our null hypothesis), and derive the probability (p) of the null hypothesis. The probability of drawing the distribution of from a zero mean normal parent distribution is only 5% (3%) for the H2CO (CS) sample.
Another way to quantify the asymmetries in the distribution of is to simply count the excess (E) number of sources with negative compared to positive . We define the “blue excess” E as , where is the number of sources with a “significant” blue-shift (), is the number of sources with a “significant” red-shift (), is the number of sources with no significant shift (), and is the total number of sources. Defined in this way, a large excess (E) corresponds to a small probability (p). We chose the threshold value 0.25 in the definition of E at about five times the typical rms error in (Table A Search for Infall Motions Toward Nearby Young Stellar Objects) to screen out random contributions. The excess of sources with negative in the histograms in figure 3 is 21% and 29% for the H2CO and CS samples respectively (25% overall).
To understand the origin of the asymmetry of the distribution, we evaluate statistics for subsamples defined by whether Tbol corresponds to a Class 0 or a Class I source (from here on, we refer to sources with K as Class 0, and to sources with K as Class I). Table 5 lists (for the full sample and these subsamples) the quantities ; ,,; the mean; p, and E for the distributions of and .
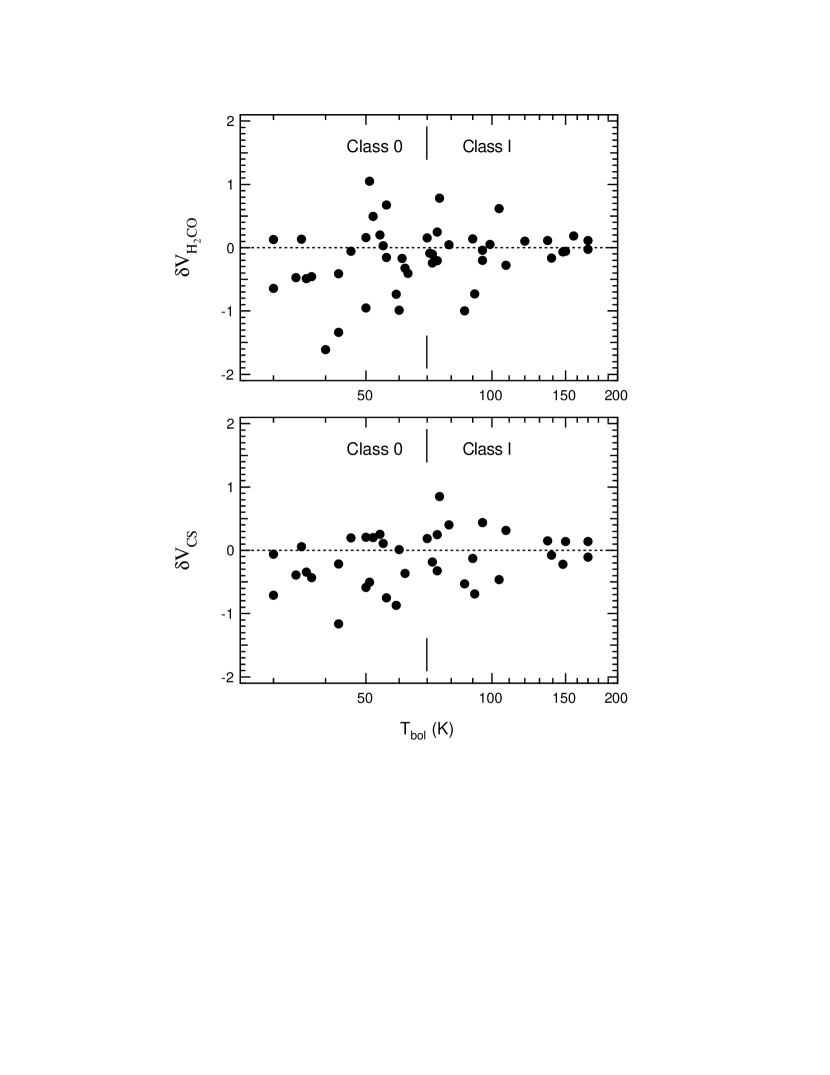
Table 5 shows that the sample sources with K is entirely responsible for the histogram skewness in figure 3. Thus, Class 0 sources have a probability of being drawn from a zero-mean normal distribution of 4%(0.4%) for the H2CO (CS) sample, while Class I sources have a probability of 81% (99%) for the H2CO (CS) sample. The overall excess of 25% of sources with negative can be decomposed in a 47% excess (39% for H2CO and 55% for CS) among the Class 0 sources, and 2% excess (4% and 0% respectively) among the Class I sources. This is illustrated in Fig. 4, which shows the distributions as a function of Tbol for the H2CO and CS lines. The fraction of blue-shifted sources (negative ) in figure 4 is clearly greater for class 0 than for Class I sources.
To summarize, sources with K (Class 0 and I) tend to have asymmetric profiles in both of the optically thick lines that we used to trace high densities ( cm-3). In this sample there are 25% more sources with a significant blue-shift than with a significant red-shift. This statistically significant tendency arises entirely from sources with K. In this Class 0 subsample the blue-shifted excess is 50%, while in the Class I subsample there is no significant blue- or red-shifted excess.
3.4 Uncertainties Due to Choice of Line and to Angular Resolution
Our statistical results are significant as long as they are independent of the instruments used, or the lines observed. We compare among different lines to better understand the sources of uncertainty in the statistical results discussed above, in particular possible effects of chemistry and resolution. We compare the optically thick line profiles of ortho and para H2CO, and CS; and the optically thin line profiles of N2H+ and C34S.
3.4.1 Molecular Tracers as a Source of Uncertainty
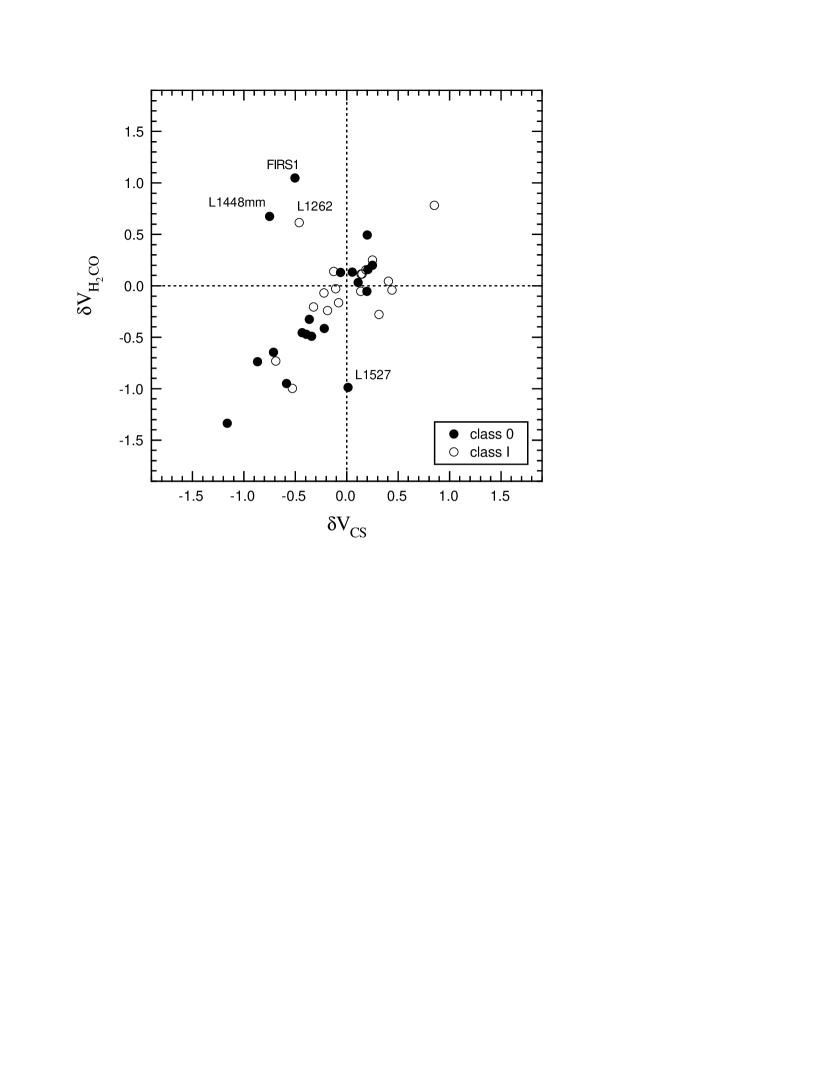
The H2CO and CS observations give statistically similar results as shown in section 3.3; we now compare the line profiles individually in each source. The measured peak velocities in the CS and H2CO lines agree quite well as can be seen by inspection of Table A Search for Infall Motions Toward Nearby Young Stellar Objects. Figure 5 plots against . Of the 39 sources observed in both lines, 4 (L1448mm, Serp-FIRS1, L1262 and L1527) deviate significantly from the line of perfect correlation. For the remaining 35, the best fit line has a slope of , an intercept of and a correlation coefficient of 0.90. The small differences in the statistics derived above (see Table 5) arise mostly from the different CS and H2CO lines toward the four discrepant sources mentioned above. A paired t-test yields a probability of 0.91 that the means of the CS and H2CO distributions are equal, so we treat both distributions as being drawn from the same parent distribution. We note that the CS and H2CO velocity differences were normalized by the same N2H+ line width, so the correlation in figure 5 is independent of the normalization.
We observed the C34S line toward 11 sources with the SEST and 2 sources with the IRAM telescope (table 4). We evaluate the effect of using N2H+ instead of C34S to compute with CS as the thick line. The difference has mean standard error of the mean (s.e.m.) of , smaller than the width of one bin in figure 3. Most of the variation in comes from the different widths of C34S and N2H+ in some sources. The C34S lines are broader than the N2H+ lines by a factor of . The velocity difference has mean s.e.m km s-1 (). Only Serp-FIRS1 and L1251B have C34S velocities differing by more than 0.1 km s-1 from the N2H+ velocity.
Ortho- and para-H2CO are expected to trace the same physical conditions, and in LTE they are expected to have an ortho/para abundance ratio equal to three. The observed ortho and para line profiles are very similar in most sources, indicating high optical depth in both lines. In particular, the velocity of the peak is essentially the same in both transitions. The change in for all 12 sources has mean s.e.m. (para – ortho), smaller than the width of one bin in figure 3. The ortho- and para-H2CO lines have different shapes only toward the sources L483 and VLA1623, where the ortho-H2CO line peak velocity is more blue-shifted with respect to the N2H+ velocity than is the para-H2CO line.
3.4.2 Angular Resolution as a Source of Uncertainty
We explored the effects of different beam sizes by comparing the IRAM H2CO line profiles with average profiles over an effective 37′′ beam ( points with 10′′ spacing and 16′′ beam) in a sample of 13 sources where we have made maps (Mardones et al. 1997). The self-absorption depth and blue to red peak ratio vary somewhat, but the peak velocities are consistent to within 0.1 km s-1. The only exception is Serpens-FIRS1, where the red peak is brighter in the IRAM central spectrum but the blue peak is brighter in the IRAM average. The difference in between the average spectrum of the map and the center spectrum has mean s.e.m. . In general, then, the measured is not very sensitive to variations in pointing or spatial resolution.
We also compared SEST and IRAM observations to study the variation of the line profiles when changing spectral and spatial resolution. The observed SEST line profiles are on average 40% fainter than the corresponding IRAM line profile. This is likely due to beam dilution indicating that the emitting gas is spatially concentrated on scales smaller than the SEST main beam (36′′). Some of the sources proved to be very compact as judged by the high IRAM/SEST intensity ratio (notably 16293-2422 and B335). The shapes of the lines observed with both telescopes are very similar in most of the sources, with a few exceptions noted below. For sources with double-peaked H2CO line profiles the overall intensity and width of the lines is similar at both telescopes, but the self-absorption depth and the ratio of the two peaks can vary significantly. The dips are always deeper in the IRAM spectra, maybe indicating that the absorption is also diluted in the SEST beam. The peak velocities measured in the SEST and IRAM spectra are consistent with each other. The change in using the H2CO velocities measured at the SEST and IRAM has mean s.e.m. (SEST-IRAM), for the 10 sources in common, excluding Serp-FIRS1. The SEST spectrum toward Serp-FIRS1 is almost identical to the IRAM average spectrum. We find no telescope biases in our observations that could affect significantly the statistics.
4 Discussion
We have found an excess of sources with asymmetric optically thick lines (double-peaked or shoulder profiles) toward a sample of 47 nearby low mass YSOs. This asymmetry is such that the peak velocity of the optically thick line is preferentially blue-shifted with respect to the optically thin velocity. This blue-shifted excess is statistically more significant in subsamples of sources with K. The observed blue excess of values is similar for the CS and H2CO tracers and is independent of the telescope used. It is, therefore, an inherent property of the sources in the samples.
4.1 Kinematic Interpretation of the Observed Velocity Differences
The observed N2H+ line profile is single in all sources observed, ruling out multiple components as the cause of the asymmetric lines observed. In a few cases (eg. L1448mm), the N2H+ line profile departs significantly from a Gaussian. However, in those cases the peak of the N2H+ line profile lies within the H2CO or CS absorption dip and does not coincide with the peak of the H2CO or CS profile.
A foreground absorbing layer could reproduce the asymmetric line profiles we observe. However, we do not expect such a layer of dense gas (having the systemic velocity of the source) to lie in front of most of the sources observed unless it is physically associated. On the other hand, the spatial variation of optically thick line profiles show that the asymmetries are concentrated toward the sources (§3.4.2; also Zhou et al. 1993, Myers et al. 1995, Mardones et al. 1997) making the casual superposition of two clouds even more unlikely. We are led to explain the variety of line profiles observed as arising from local self-absorption, i.e. absorption by physically associated gas.
We now ask what kinematics should the local absorbing gas have with respect to the YSO to reproduce the observed distributions. If the kinematics around a YSO are dominated by infall, then we expect the foreground gas to be preferentially red-shifted with respect to the systemic velocity of the source. If this foreground gas has colder excitation temperature than the dense gas in the inner cloud, it will absorb preferentially at red-shifted velocities causing asymmetric line profiles (eg Leung & Brown 1977; Zhou 1992). Thus it will have a distribution of skewed toward blue velocities as observed. If systematic motions are due solely to infall toward a high fraction of Class 0 sources, these motions can explain the observed statistics.
The observed blue excess of can arise from infall, as opposed to expansion; but other motions, including rotation and bipolar outflows, need to be considered. Adelson & Leung (1988) showed that rotation can cause infall-like and expansion-like line profiles on either side of the rotation axis (see also Zhou 1995). The observed effect depends on the orientation of the rotation axis with respect to the line of sight. A source sample with randomly oriented rotation axes would produce a symmetric distribution of . Similarly, bipolar outflows also cause infall- and expansion-like line profiles on either side of the source (Cabrit, & Bertout 1986). An ensemble of bipolar outflows with random orientation would also produce a symmetric distribution of , unlike our results. Thus our statistical results do not rule out the contribution of outflow and rotation to the line profiles, but they require inward motions in addition to any outflow and rotation in a significant fraction of our source sample.
Outflow motions greatly affect the observed line profiles toward some sources, in particular among the Class 0 sample. If outflow axes in this sample were not distributed randomly, or if the sample were too small, the outflows could, in principle, produce the observed statistical effect. We now examine on a source-by-source basis whether the observed outflow wings are associated with the excess of sources with blue in our sample. We subtracted one or two best-fit Gaussians from the H2CO and CS line peaks to measure the remaining blue and red wings in every spectrum. We then labeled each source’s wings as blue if the blue wing is 25% brighter than the red, red if the red wing is 25% brighter than the blue, and nil otherwise. We find as many sources with brighter blue and red wings ( of each) in both the H2CO and CS lines, therefore the excess of sources with negative is not associated with a similar excess of sources with bright blue wings.
To test this further, we defined a wing parameter with values -1, 0, or 1 for sources with brighter wings to the blue, neither, or red respectively, and a line-core parameter with values -1, 0, or 1 for sources with a measured , , or respectively. We find a Spearman rank correlation coefficient between the wing and the line-core parameters of 0.0 for the H2CO sample and -0.1 for the CS sample. We conclude that the observed wing emission is not correlated with, and thus is not responsible for the excess of sources with negative derived in section 3.
Finally, it is possible that star forming groups could have large scale rotation or magnetic fields imposing a characteristic orientation to the disks and outflows around YSOs. This effect could bias the statistics within each cluster. This is evidently not the case in this survey, because the projected outflow axes have a wide distribution in position angle within each cluster. The distribution of axis position angles of all outflows with well known orientation in NGC1333 has an rms of 56°(Bally, Devine, & Reipurth 1996). Bontemps et al. (1996) found a similar range of outflow axis position angles, with an rms of 55°in Ophiuchus. In Serpens, the position angles of the outflows axis of the sources S68N, FIRS1, SMM2, SMM4, and SMM5 in Serpens have an rms of 43°(White, Casali,, & Eiroa 1995, Williams et al. 1997). Therefore, within each of the clusters in our survey we can regard the source outflow axes as randomly oriented.
4.2 Infall Toward Class 0 and Class I Sources
We have shown that the observed distribution of is explained best by motions which include infall in addition to outflow and/or rotation. Furthermore, we showed in §3.3 that in our sample the infall signatures are seen almost entirely toward Class 0 rather than Class I sources. The most straightforward interpretation of these results is that Class 0 sources differ from Class I sources in having a much greater incidence of inward motions for the conditions which our observations probe –size scales of a few 0.01 pc and gas density of about 105 cm-3. This difference, which has not been demonstrated before, adds support to the idea that Class 0 sources have not yet accreted most of their mass, based mainly on the greater submillimeter continuum emission of Class 0 than Class I sources (Andre et al. 1993).
The lack of infall signatures in Class I objects, however, does not necessarily mean that infall is absent in these sources. Adams, Lada, & Shu (1987) showed that to model the spectral energy distribution of Class I sources it is necessary to include the contribution of an infalling envelope. The lack of blue-shifted line profiles toward Class I sources could therefore result from a lower sensitivity of our observations to the physical conditions in the infalling envelopes of Class I sources. This would occur if the circumstellar envelopes in Class I sources have less optical depth than in Class 0 sources, or if the circumstellar envelopes in Class I sources have smaller excitation temperature gradients than in Class 0 sources (in the optically thick CS and H2CO lines).
To test the above ideas, we examined the optical depths determined from the multicomponent fits to the N2H+ spectra for the Class 0 and Class I sources in our sample. We found no significant difference between the two groups: the N2H+ optical depth, summed over all seven hyperfine components, has mean and s.e.m. for the Class 0, and for the Class I source sample. This suggests that the greater incidence of blue-shifted profiles in Class 0 than in Class I sources does not arise from differences in line optical depth between the two samples. However, the lack of self-absorption features in the Class I source line profiles may indicate that the CS and H2CO optical depths could still be higher in Class 0 than in Class I sources. Also, there are more weak single-peaked sources in the Class I than in the Class 0 source samples.
Sources whose outflow axes are in the plane of the sky, having edge on disks, may have significant obscuration to optical and near-infrared radiation, lowering their observed Tbol. This effect would tend to mix the Class 0 and Class I sources. However, the circumstellar envelopes are most likely optically thin at sub-mm wavelengths, so a sub-mm wavelength excess should distinguish Class 0 from Class I sources, independent of orientation. Among our sample of Class 0 sources, only 03282+3035 and L673A have not been detected at sub-mm wavelengths; moving them to the Class I sample would only emphasize the observed difference between the Class 0 and Class I samples.
Thus, we found a significant difference in the incidence of blue-shifted line asymmetry between the Class 0 and Class I sources, indicating different physical conditions in the circumstellar envelopes around Class 0 and Class I sources. However, our observations do not necessarily rule out the presence of inward motions onto Class I sources; tracers with higher optical depths may be needed to probe the circumstellar kinematics around Class I sources.
4.3 Identification of Infall Candidates
We summarize in table A Search for Infall Motions Toward Nearby Young Stellar Objects the evidence for infall, expansion, or neither for the sources in our sample. We list all 23 sources with in either the H2CO or CS lines. We label the lines b if they have blue asymmetry (), r if they have red asymmetry (), or n if they have neither (). We include IRAS 13036-7644 in the CS sample, using the spectrum published by Lehtinen (1997). The correspondance between both lines is extremely good, as expected from figure 5. Following Gregersen et al. (1997), we identify infall candidates as those sources with evidence for infall (at least one “b”) and no evidence for expansion in any line (no “r”s). Therefore, from the H2CO and CS observations presented in this paper, we select 15 sources as infall candidates: IRAS 03256+3055, NGC1333-4A, NGC1333-4B, L1527, IRAS 13036-7644, VLA1623, WL22, IRAS 16293-2422, L483, S68N, SMM5, SMM4, B335, L1157, and L1251B. These are Class 0 sources ( K) with the exception of IRAS 03256+3055, WL22 and L1251B. In contrast to the 15 (CS and H2CO) sources with at least one b and no rs, there are only 4 with the opposite property –at least one r and no bs (NGC1333-2, L1551-5, L1551NE and L43).
Among our infall candidates, L1527, IRAS 16293-2422 and B335 have been widely studied (eg. Walker et al. 1986; Zhou et al. 1993, 1994; Mardones et al. 1994; Myers et al. 1995; Ohashi et al. 1997; Gregersen et al. 1997). They represent the best cases for infall to date due to the agreement between kinematic models and observations. The sources NGC1333-2 (Ward-Thompson et al. 1996), IRAS 13036-7644 (Lehtinen 1997), L483 (Myers et al. 1995), S68N (Hurt, Barsony, & Wootten 1996), SMM4 (Hurt et al. 1996, Gregersen et al. 1997), L1157 (Gueth et al. 1997), and L1251B (Myers et al. 1996) have been recently identified as infall candidates but have not yet been studied as thoroughly as L1527, IRAS 16293-2422, and B335. The sources IRAS 03256+3055, NGC1333-4A and 4B, VLA1623, WL22, and SMM5 are new kinematic infall candidates based on this work.
4.4 Comparison with Previous Surveys
Wang et al. (1995) observed 12 globules at the CSO using the H2CO line looking for kinematic infall signatures. They do not find convincing spectral evidence of infall toward any source. This may be because none of their sources are known to be Class 0 YSOs; or due to the expected lower optical depth of the H2CO line.
Gregersen et al. (1997) observed 23 Class 0 sources in the HCO+ and lines looking for infall signatures. Their sample contains sources more distant than 400 pc, but the overlap with our sample is still considerable, with 15 sources in common. We derived from the HCO+ and H13CO+ spectra presented by Gregersen et al. toward 13 of those sources, and assigned asymmetry labels b,r, and n to them in the same way as for the CS and H2CO spectra. In table A Search for Infall Motions Toward Nearby Young Stellar Objects we list the asymmetry labels from available observations: from this paper, from Gregersen et al. (1997), from Ward-Thompson et al. (1996), and from Lehtinen (1997). The correspondance among all lines is generally good. Seven of the nine sources with infall asymmetry in the HCO+ lines have the same sense of asymmetry in the H2CO and CS lines. On the other hand, the two sources with expansion asymmetry in the HCO+ lines show infall asymmetry in the H2CO and/or CS lines (L1448mm and L483), and one source (NGC1333-2) shows infall asymmetry in HCO+ (Ward-Thompson et al 1996) and expansion asymmetry in CS and H2CO. These disagreements may reflect differing degrees of outflow contamination from one line to the next.
Assuming as in §4.3 that the best infall candidates are those sources with evidence for infall in at least one line, and with no evidence for expansion in any line, we consider again the sources in Table A Search for Infall Motions Toward Nearby Young Stellar Objects, now according to their asymmetry in HCO+, as well as in CS, H2CO. Adding this HCO+ data and applying this procedure removes only one source, L483, from the CS and H2CO list given in §4.3, leaving the 14 sources indicated in Table A Search for Infall Motions Toward Nearby Young Stellar Objects as the best infall candidates. These sources have substantial internal agreement among their asymmetry labels: 5 have 4 bs, 2 have 3 bs, 5 have 2 bs, and 2 have 1 b. At present, these sources have the most evidence from available spectral line surveys for infall, and they have the least evidence against infall.
4.5 Thermal and Turbulent Infall
The kinematic infall candidates identified in this paper include two sources –B335 and L1527– which exemplify in several ways the “standard model” of low-mass star formation (e.g. Shu, Adams, & Lizano 1987). These sources are relatively isolated and have NH3 line widths dominated by thermal, rather than turbulent motions (Myers, & Benson 1983; Benson, & Myers 1989). Their profiles of H2CO and other lines are well-fit by radiative transfer models whose kinematics are specified by the “inside-out” mode of collapse of a singular isothermal sphere (Shu 1977).
But these two sources are not representative of the properties of the 15 kinematic infall candidates identified by the CS and H2CO lines in this paper. Most of these sources differ from the standard model in two ways: their line widths are dominated by turbulent motions, and many of them are found in stellar groups rather than in isolation.
We quantify the turbulent motions of the infall candidates by comparing the FWHM of the optically thin N2H+ line, given in Table A Search for Infall Motions Toward Nearby Young Stellar Objects, with that expected for gas having equal thermal and nonthermal motions,
| (2) |
where T is the gas kinetic temperature, is the mass of the observed species (29 amu for N2H+), and is the mean molecular mass (2.3 amu). For gas with T = 15 K, 9 out of 15 sources, or 60%, have N2H+ line widths km s-1, i.e. having greater non-thermal than thermal motions. If T = 10 K, this fraction increases to 12/15, or 80%. Clearly most of the kinematic infall candidates have non-thermal motions exceeding their thermal motions.
The non-thermal motions in the N2H+ line width could arise from motions which appear random to our resolution, which we designate as turbulence, and also from systematic motions, including outflow, infall, and rotation. Since N2H+ lines (like NH3 lines) tend to trace quiescent core structure (Womack et al. 1992) and do not track outflow maps (Caselli et al. 1997), we expect that the outflow contribution to the N2H+ line width is relatively small compared to the turbulent component. Similarly, the relative contribution of rotation and infall motions to the optically thin line width is significantly smaller than the random contribution, according to infall models which match the profiles of infall candidates (e.g. Zhou et al. 1993).
To assess the proportion of the infall candidates associated with groups or clusters, we consider those infall sources in the NGC1333, Ophiuchus, and Serpens clouds, which are associated with a substantial cluster of embedded young stellar objects. Of the 15 infall candidates listed in Section §4.3, 8 or 53% belong to these three clusters. This accounting is conservative in that we do not count L1251B which belongs to a smaller group of at least 5 near infrared sources (Hodapp 1994). Of these 8 sources in clusters, most (6) have N2H+ line widths dominated by turbulent motions.
This relatively high incidence of turbulent motions and cluster sources in our list of kinematic infall candidates implies that the standard model of isolated star formation in a thermally dominated core is not representative of most of our infall candidates. This is an area where more theoretical models are needed. Models of star formation which account for significant turbulent motions as part of their initial conditions have been presented for a spherically symmetric geometry and for the formation of a single star (Caselli & Myers 1995; McLaughlin & Pudritz 1997); but these models lack a physical basis for the non-thermal motions, and do not account for the formation of multiple stars.
4.6 Future Prospects
The infall candidates identified in this paper are good candidates for the study of star-forming infall. However, it is not established from the survey data presented here that their motions are necessarily either “star-forming” or “gravitational.”
A further step to establish if the blue-shift identified in Class 0 sources arise from infalling envelopes is to map them: the blue-shifted, asymmetrical line profiles should be spatially concentrated toward the source. Furthermore, maps are needed to disentangle the effects of the outflows. Maps of observed line asymmetry (eg. Adelson & Leung 1988; Walker et al. 1994) can distinguish whether infall dominates (at low velocities) over rotation or expansion in a given region.
To establish whether the observed infall kinematics are gravitational, the observations should be compared with kinematic models, which predict the spatial variation of the line profiles (eg. Zhou et al 1993). Furthermore, continuum observations may help determine the YSO and envelope masses to compare with model predictions. High spatial resolution attainable with interferometers can locate the infall regions in relation to the position of the continuum peak of the YSO. All of these together should constrain significantly kinematic models of gravitational collapse, to determine better the physical basis of the inward motions inferred in this paper. In addition, further models and observations may be needed to resolve the apparent conflicts presented in table A Search for Infall Motions Toward Nearby Young Stellar Objects. Such models will have to incorporate both infall and outflow kinematics.
5 Conclusions
Among 47 of the youngest nearby low mass PMS stars (spectral classes 0, or K, and I, or K) a significant fraction show complex line profiles with double peaks or a peak and a shoulder in the optically thick CS and H2CO transitions, which trace dense gas ( cm-3).
These complex spectral profiles are not due to multiple components along the line of sight, since the optically thin N2H+ line, observed toward the same sources, is single. The N2H+ line velocities are consistent with the C34S 2-1 velocities.
In both CS or H2CO samples, about half the sources have a significant velocity-shift between the optically thick and thin lines.
In both CS or H2CO samples, there are 25% more sources whose velocity shift is to the blue than to the red. This statistically significant tendency arises entirely from sources with K (Class 0 sources). In this Class 0 sample the blue-shifted excess is 50% (9 out of 23 for H2CO and 10 out of 19 for CS), while in the Class I subsample there is no significant blue- or red-shifted excess.
The observed excess of blue-shifts cannot be reproduced by a sample of sources whose kinematics are dominated either by bipolar outflows or rotation, if their symmetry axes are oriented in random directions. On the other hand, infall motions alone, or infall combined with rotation and/or outflows, can explain the excess of blue-shifts.
We identify a total of 15 spectroscopic infall candidates, of which 6 have not been identified previously. Most of these candidates differ from the well-known sources B335 and L1527, which exemplify the “standard model” of an isolated core whose line width is dominated by thermal motions. They tend to have primarily turbulent line-widths, or are associated with embedded young clusters, or both.
References
- (1)
- (2) Adams, F.C., Lada, C.J., & Shu, F.H. 1987, ApJ, 312, 788
- (3) Adelson, L.M., & Leung, C.M. 1988, MNRAS, 235, 349
- (4) Andre, P., Ward-Thompson, D., & Barsony, M. 1993, ApJ, 406, 122
- (5) Bachiller, R., Andre, P., & Cabrit, S. 1991, A&A, 241, L43
- (6) Bachiller, R. 1996, ARA&A, 34, 111
- (7) Bachiller, R., & Pérez, M. 1997, in preparation
- (8) Bally, J., Lada, E.A., & Lane, A.P. 1993a, ApJ, 418, 322
- (9) Bally, J., Devine, D., Hereld, M., & Rauscher, B.J. 1993b, ApJL, 418, L75
- (10) Bally, J., Devine, D., & Reipurth, B., 1996, ApJL, 473, L49
- (11) Bernes, C. 1979, A&A, 73, 67
- (12) Bontemps, S., Andre, P., Terebey, S., & Cabrit, S., 1996, AA, 311, 858
- (13) Bourke, T.L. 1994, MSc Thesis, Univ. New South Wales
- (14) Bourke, T.L., Hyland, A.R., & Robinson, G. 1995, MNRAS, 276, 1052
- (15) Cabrit, S., & Bertout C. 1986, ApJ, 307, 313
- (16) Carballo, R., Wesselius, P.R., & Whittet, D.C.B 1992, A&A, 262, 106
- (17) Casali, M.M, Eiroa, C., & Duncan, W.D. 1993, A&A, 275, 195
- (18) Caselli, P., & Myers, P.C. 1995, ApJ, 446, 665
- (19) Caselli, P., Myers, P.C., & Thaddeus, P. 1995, ApJ, 455, L77
- (20) Chandler, C.J., Gear, W.K., Sandell, G., Hayashi, S., Duncan, W.D., Griffin, M.J., & Hazella, S. 1990, MNRAS, 243, 330
- (21) Clark, F.O. 1991, ApJS, 75, 611
- (22) Chen, H., Myers, P.C., Ladd, E.D., & Wood, D.O.S. 1995, ApJ, 445, 377
- (23) Chen, H., Grenfell, T.G., Myers, P.C., & Hughes, J.D. 1997, ApJ, in press
- (24) Choi, M., Evans, N.J. II, Gregersen, E.M., & Wang, Y. 1995, ApJ, 448, 742
- (25) Dent, W.R.F., Matthews, H.E., & Walther, D.M. 1995, MNRAS, 277, 193
- (26) Devine, D., Reipurth, B., & Bally, J. 1997, in “Low Mass Star Formation from Infall to Outflow,” poster proceedings of IAU Symp N182, Eds. F. malbet & A. Castets, p91
- (27) Eiroa, C., Palacios, J., Eisloffel, J., Casali, M.M., & Curiel, S. 1997,in “Low Mass Star Formation from Infall to Outflow,” poster proceedings of IAU Symp N182, Eds. F. malbet & A. Castets, p103
- (28) Fuller, G.A., Lada, E.A., Masson, C.R., & Myers, P.C. 1995, ApJ, 453, 754
- (29) Gregersen, E.M., Evans, N.J. II, Zhou, S., & Choi, M. 1997, submitted to ApJ
- (30) Gueth, F., Guilloteau, S., Dutrey, A., & Bachiller, R. 1997, A&A, in press
- (31) Henning, T., Pfau, W., Zinnecker, H., & Prusti, T. 1993 A&A, 276, 129
- (32) Hodapp, K. 1994, ApJS, 94, 615
- (33) Hurt, R.L., Barsony, M., & Wootten, A. 1996, ApJ, 456, 686
- (34) Hurt, R.L., & Barsony, M. 1996, ApJ, 460, L45
- (35) Jennings, R.E., Cameron, D.H.M., Cudlip, W., & Hirst, C.J. 1987, MNRAS, 226, 461
- (36) Lada, C.J., & Wilking, B.A. 1984, ApJ, 287, 610
- (37) Ladd, E.F., Adams, F.C., Casey, S., Davidson, J.A., Fuller, G.A., Harper, D.A., Myers, P.C., & Padman, R. 1991, ApJ 366, 203
- (38) Ladd, E.F., Lada, E.A., & Myers, P.C. 1993, ApJ, 410, 168
- (39) Larson, R., 1969, MNRAS, 145, 271
- (40) Lehtinen, K. 1997, A&A, 317, L5
- (41) Leung, C.M., & Brown, R.L. 1977, ApJ, 214, L73
- (42) Mardones, D., Myers, P.C., Caselli, P., & Fuller, G.A. 1994, in “Clouds, Cores & Low Mass Stars”, Eds. Clemens & Barbainis, 192
- (43) Mardones, D. et al. 1997, in preparation
- (44) Mauersberger, R., Guelin, M., Martin-Pintado, J., Thum, C., & Cernicharo, J. 1989 A&AS, 79, 217
- (45) McCaughrean, M.J., Rayner, J.T., & Zinnecker, H. 1994, ApJ, 436, L189
- (46) McLaughlin, D.E., & Pudritz, R.E. 1997, ApJ, 476, 750
- (47) Myers, P.C., Bachiller, R., Caselli, P., Fuller, G.A., Mardones, D., Tafalla, M., & Wilner, D.J. 1995, ApJ, 449, L65
- (48) Myers, P.C., Mardones, D., Tafalla, M., Williams, J.P., & Wilner, D.J. 1996, ApJ, 465, L133
- (49) Myers, P.C., & Ladd, E.D. 1993, ApJ, 413, L47
- (50) Ohashi, N., Hayashi, M., Ho, P.T.P., & Momose, M. 1997, ApJ, 475, 211
- (51) Persi, P., Ferrari-Toniolo, M., Busso, M., Origlia, L., Robberto, M., Scaltriti, F., & Silvestro, G. 1990, AJ, 99, 303
- (52) Reipurth, B., & Eiroa, C. 1992, A&A, 256, L1
- (53) Reipurth, B. Chini, R., Krugel, E., Kreysa, E., & Sievers, A. 1993, A&A, 273, 221
- (54) Reipurth, B. 1994, A general catalogue of Herbig-Haro objects, electronically published via anon. ftp to ftp.hq.eso.org
- (55) Sandell, G., Aspin, C., Duncan, W.D., Russell, A.P.G., & Robson, E.I. 1991, ApJ 376, L17
- (56) Sandell, G., Knee, L.B.G., Aspin, C./ Robson, I.E., & Russell, A.P.G. 1994, A&A 285, L1
- (57) Sato, F., & Fukui, Y. 1989, ApJ, 343, 773
- (58) Shu, F.H. 1977, ApJ, 214, 488
- (59) Shu, F.H., Adams, F.C., & Lizano, S. 1987, ARA&A, 25, 23
- (60) Terebey, S., Shu, F.H., & Cassen, P. 1984, ApJ, 286, 529
- (61) Walker, C.K., Lada, C.J., Young, E.T., Maloney, P.R., & Wilking, B.A. 1986, ApJ, 309, L47
- (62) Walker, C.K., Narayanan, G., & Boss, A.P. 1994, ApJ, 431, 767
- (63) Wang, Y., Evans, N.J., Zhou, S., & Clemens, D.P. 1995, ApJ, 454, 217
- (64) Ward-Thompson, D., Buckley, H.D., Geaves, J.S., Holland, W.S., & Andre, P. 1996, MNRAS 281, L53
- (65) White, G.J., Casali, M.M., & Eiroa, C., 1995, A&A, 298, 594
- (66) Williams, J.P., Mardones, D., Myers, P.C., & Tafalla, M., 1997, in preparation
- (67) Womack, M., Ziurys, L.M., & Wyckoff, S. 1992, ApJ, 387, 417
- (68) Wu, Y., Huang, M., & He, J. 1996, A&AS, 115,283
- (69) Yun, J.L., & Clemens, D.P. 1995, AJ, 109, 742
- (70) Zhou, S. 1992, ApJ, 394, 204
- (71) Zhou, S., Evans, N.J., Kompe, C., & Walmsley, C.M. 1993, ApJ, 404, 232
- (72) Zhou, S., Evans, N.J., Wang, Y., Peng, R., & Lo, K.Y. 1994, ApJ, 433, 131
- (73) Zhou, S. 1995, ApJ, 422, 685
![[Uncaptioned image]](/html/astro-ph/9707011/assets/x1.png)
![[Uncaptioned image]](/html/astro-ph/9707011/assets/x2.png)
![[Uncaptioned image]](/html/astro-ph/9707011/assets/x3.png)
| Source | Telescope | |||
|---|---|---|---|---|
| km s-1 | km s-1 | km s-1 | ||
| L1527 | IRAM | |||
| 13036-7644 | SEST | |||
| VLA1623 | SEST | |||
| WL22 | SEST | |||
| 16293-2422 | SEST | |||
| L483 | SEST | |||
| Serp-FIRS1 | SEST | |||
| Serp-SMM5 | SEST | |||
| Serp-SMM4 | SEST | |||
| 18331-0035 | SEST | |||
| CrA IRS32 | SEST | |||
| B335 | SEST | |||
| L1251B | IRAM |
| Optically thick line | Sample | N | N-aaN-, N0, N+ are the number of sources in the subsample with normalized velocity difference , , and respectively | N0 | N+ | mean s.e.m. | pbbProbability of drawing the sample from a zero-mean normal parent distribution, based on a Student’s t-distribution | EccThe blue excess is defined as |
|---|---|---|---|---|---|---|---|---|
| H2CO | all | 47 | 15 | 27 | 5 | 0.06 | 0.21 | |
| K | 23 | 12 | 8 | 3 | 0.05 | 0.39 | ||
| K | 24 | 3 | 19 | 2 | 0.81 | 0.04 | ||
| CS | all | 37 | 14 | 19 | 4 | 0.04 | 0.27 | |
| K | 19 | 10 | 9 | 0 | 0.008 | 0.53 | ||
| K | 18 | 4 | 10 | 4 | 0.99 | 0.00 |
| SourceaaThe best cases for infall are indicated in bold face | Tbol | Line AsymmetrybbThe line asymmetry is designated b for , n for , and r for . Except where noted, the CS and H2CO data come from this paper, and the HCO+ line data come from Gregersen et al. (1997) | |||
|---|---|---|---|---|---|
| K | CS | H2CO | HCO+ | HCO+ | |
| L1448mm | 56 | b | r | r | r |
| 03256+3055 | 74 | b | n | ||
| N1333-2 | 52 | r | r | b(1)(1)footnotemark: | |
| N1333-4A | 34 | b | b | b | b |
| N1333-4B | 36 | b | b | b | b |
| L1551-5 | 95 | n | r | ||
| L1551NE | 75 | r | r | b | |
| L1527 | 60 | n | b | b | b |
| 13036-7644 | 63 | b(2)(2)footnotemark: | b | ||
| VLA1623 | 30 | b | b | n | n |
| WL22 | 86 | b | b | ||
| 16293-2422 | 43 | b | b | b | b |
| L43 | 79 | n | r | ||
| L483 | 50 | b | b | r | r |
| S68N | 40 | n | b | ||
| FIRS1 | 51 | b | r | r | b |
| SMM5 | 59 | b | b | ||
| SMM4 | 43 | b | b | b | b |
| B335 | 37 | b | b | b | b |
| L1157 | 62 | b | b | b | n |
| L1251A | 108 | b | r | ||
| L1251B | 91 | b | b | ||
| L1262 | 104 | r | b | ||
References. — (1) Ward-Thompson et al 1996, (2) Lehtinen 1997