To be published in The Ultraviolet Universe at Low and High Redshift, ed. W. H. Waller (AIP Press), 1997.
THE ULTRAVIOLET MORPHOLOGY OF GALAXIES
Abstract
The vacuum ultraviolet offers a unique perspective on galaxy morphology, stellar populations, and interstellar material which is of particular relevance to interpreting high redshift galaxies and the history of cosmic star formation. Here we review UV imaging studies of galaxies since 1990.
Introduction
The concepts of morphology and classification are closely linked. Classification is one of the most powerful organizing tools ever developed by science, but as it is applied to galaxies, morphology is more than simple classification. It is a means to inferring the evolutionary state and history of galaxies. There is a set of conventional associations we have learned to make between morphology and the inferred nature of galaxies. Regularity or symmetry are taken to imply stability, i.e. some kind of equilibrium state. There is, for instance, the powerful notion that in such situations we can infer the three-dimensional structure of galaxies from their two-dimensional appearance. A de Vaucouleurs distribution of surface brightness [] is taken to imply a spheroidal mass distribution, whereas an exponential profile [] is taken to imply a disklike mass distribution. On the other hand, irregularity or asymmetry is assumed to imply a non-equilibrium state or a low-mass system in which random velocities are significant compared to the organized velocity field.
I have deliberately used tentative language in describing these associations because essentially all of our intuition about them has been developed from observations in a narrow range of visible wavelengths (mainly 4500–6500 Å). There is an implicit assumption that V-band light is a good tracer of the dynamical mass of galaxies. It is now widely acknowledged that this cannot be strictly correct because of the presence of significant amounts of dark matter. It is less well appreciated that even the luminous, stellar component of galaxies is only well traced by V-band light if , which, again, cannot be strictly true. One of the main motivations for studying the morphology of galaxies in bands other than the visual is to provide an independent perspective on the interpretation of V-band morphologies—to test the assumptions and provide new insights. The availability of multiband data for galaxies can make up to some degree for the fact that astronomical morphology is limited to two dimensions. In recent years, it has been possible to assemble a small but representative sample of images of nearby galaxies in the vacuum ultraviolet. In this paper, I review what we know about UV galaxy morphology, based mainly on the images returned by the Astro Ultraviolet Imaging Telescope.
The Ultraviolet Viewpoint
In what ways can we expect the ultraviolet to yield new information on galaxy structures and histories? Briefly, the vacuum UV (912–3200 Å) provides independent and unique information on the character of hot star populations, dust, very high or very low temperature gas, and AGN’s. To elaborate:
-
•
The UV allows direct detection of the massive stars responsible for most ionization, photodissociation, kinetic energy input, and element synthesis in galaxies.
-
•
The UV has the highest sensitivity of any spectral region to stellar temperature and metal abundance, implying that it is uniquely valuable to characterize stellar populations, star formation rates (SFR’s), and SF histories. Figure 1 illustrates the strong evolution of UV energy distributions of stellar populations over timescales up to 3000 Myr. The UV is a sensitive indicator of SF histories over the past 5000 Myr. Its usefulness extends even to “old”, quiescent systems such as elliptical galaxies dor97 . By contrast, the optical emission lines which are widely used to infer SFR’s reflect activity only over the past Myr, after which photoionization rapidly decreases. The infrared continuum () is primarily an indirect measure of SFR’s, involving either downconversion of absorbed photons (not necessarily from young objects) by dust grains or complex supergiant evolution. AGN’s and cold interstellar cirrus have both acted to confuse IR estimates of SFR’s.

Figure 1: Synthetic spectral energy distributions of single generation populations for ages 3–3000 Myr from [1], showing the rapid evolution in UV amplitude and shape. Note that the shape of the near-IR spectrum () is much less sensitive to age. -
•
The UV offers high sensitivity to interstellar dust and regions of concentrated cold material (i.e. potential star-formation sites). Before the advent of UV observations of galaxies, it was widely assumed that this would actually be a serious disadvantage for the UV because the Galactic extinction law yields ; some expected disk galaxies to be dark in the UV. However, it turns out (see below) that dust is not dominant in the UV morphology of galaxies except where the dust layers are disturbed. The UV may ultimately prove to be a valuable tracer of quiescent, cold, molecular material. Conventional tracers, like radio-emitting CO, occur only where there is significant dissociation and, as emphasized by all97 and others, may be unreliable indicators of total H2 mass. Because the albedo of dust is high in the UV, dense, cool interstellar clouds far from star forming regions can be detected by scattered light, as in the case of the faint gaseous arms of M101 don81 ; stech82 . UV imaging can also detect H2 in photodissociation regions directly by virtue of its fluorescence bands (1550–1650 Å) witt89 ; mart90 .
- •
-
•
The UV provides excellent isolation of hot sources from the often overwhelming optical/IR cool star background of galaxies. This offers greatly improved detectability for minority populations of massive stars (e.g. in elliptical galaxies); hot horizontal branch and related late stages of stellar evolution such as planetary nebulae; low luminosity AGN’s (e.g. maoz96 ); star clusters; nonthermal jets; and other hot sources.
-
•
A minimum in the natural night sky background occurs at 1600-2400 Å. This is the deepest window in the UV-optical-IR spectrum and permits detection of extremely low surface brightness objects, perhaps up to 100,000 fainter than the ground-based sky oc87 .
Applications at High Redshifts
For two reasons, some of the most important applications of UV imaging of nearby galaxies will be to galaxies at high redshift. First, the restframe UV continuum is the best tracer of star formation and is measurable to very high redshifts (z 10) with optical/IR instruments. For instance, the 2800 Å restframe continuum has been used to estimate the cosmic star formation density at 0.5–2 for the CFRS, Hubble Deep Field, and other surveys pei95 ; lil95 ; mad96 , leading to the conclusion that most gas processing occurred at relatively recent epochs, –2. Second, observations of high- galaxies are preferentially made in the restframe UV. This is particularly true for ground-based telescopes, where the rapidly increasing night sky brightness seriously compromises observations in the near infrared (Å). Because galaxy appearance is a strong function of wavelength (as illustrated below), this means there is a large “morphological k-correction” which must be calibrated in assessing the morphologies of distant objects. To what extent is the strange appearance of many distant galaxies the product of simple bandshifting? Preliminary explorations suggest that distant field galaxies are in genuinely different states of morphological evolution boh91 ; ab96 ; gia96 .
To take advantage of this remarkable opportunity to study early galaxy evolution at , we require comprehensive fiducial UV studies of nearby galaxies to assess the astrophysical drivers of UV luminosity, the cosmic star formation history over the past few Gyr, the morphological k-correction, surface brightness selection effects (a very serious problem at high redshifts since ), and the effects of reduced spatial resolution on high- morphologies.
UV Imaging Instruments
Extragalactic UV astronomy to date has been largely based on spectroscopy, usually with small entrance apertures (e.g. IUE, HST/FOS), or low-resolution photometry (e.g. OAO, ANS, FAUST deharv94 ). The first UV image (i.e. with many resolution elements) of another galaxy (the LMC, which exhibits a remarkable UV/optical morphological change) was obtained by the NRL Apollo S201 camera from the lunar surface in 1972 pc81 . But progress in imaging up to 1990 was relatively slow (reviewed in oc91 ). Since 1990, we have accumulated a sample of vacuum UV images of about 200 galaxies, principally from three instruments: (i) the HST/FOC, which has better red leak rejection than HST/WFPC2 and which has recently produced an atlas of the nuclei ( fields) of 110 nearby galaxies at 2300 Å with resolution maoz96 ; (ii) the SCAP/FOCA balloon-borne telescope of the Marseille and Geneva groups, which operates in a narrow band near 2000 Å with a field of view of 1.5∘ and resolution of mill91 ; bers94 ; and (iii) the Ultraviolet Imaging Telescope (UIT) of the Astro Spacelab missions stech97 . The images I will present here are all from the UIT, although the basic conclusions are common to all three sets of data.
UIT flew on two Spacelab missions in 1990 and 1995 as one of the three, co-pointed UV telescopes of the Astro observatory. It has a diameter field and resolution in two solar-blind broad-band channels (the “FUV” at 1500 Åand the “MUV” at 2500 Å). Its monochromatic UV limiting magnitudes in 30-min exposures are for point sources ( for hot stars) and 26–27 mags per square arcsec for extended sources. Other information can be found in stech97 . Useful data was obtained for some 80 nearby galaxies. We are combining the UV data with ground-based optical CCD imagery of comparable resolution cheng96 to produce two UV/Optical Atlases of Galaxies, which will include both images and photometry marc97 . The subsequent figures in this article are taken from the Atlases.
UV Morphologies of Nearby Galaxies
Elliptical Galaxies: One of the first important discoveries of UV astronomy was that spiral bulges were bright at far-UV wavelengths where their normal main sequence and giant branch stars produce negligible flux cw79 . This “UVX” was later found in all nearby E/S0 and old bulge populations. Massive stars are not the source of the UVX. The far-UV brightness profiles (see Fig. 2) are smooth and unresolved and usually have -type spheroidal profiles boh85 ; oc92 . Some objects have nearby exponential UV profiles, but the UV isophote shapes match those in the optical, and a genuine disk is probably not present ohl97 . UV spectra also do not have massive star signatures. The best evidence is that the UVX is produced by extreme horizontal branch stars and their descendants in the low-mass, metal-rich population which dominates at longer wavelengths b3fl ; dor95 ; brown95 ; yi97 . The EHB stars are hot by virtue of having very thin envelopes, and it is a remarkable circumstance, if this interpretation is correct, that relatively crude UV observations can determine envelope masses for stars in galaxies many Mpc distant with a precision of a few .
The UVX varies more between galaxies and with radius in a given galaxy than any other photometric or spectroscopic index of old populations oc92 ; b3fl ; dor95 . It is evidently extraordinarily sensitive to the characteristics of its parent population and could therefore be a uniquely delicate population probe. But the underlying drivers of the UVX have not been positively identified. Ohl et al. ohl97 have compared internal UV color gradients to abundance gradients and find little correlation. Metallicity is evidently not the sole parameter controlling the UVX. In the case of M32, which shows a color gradient reversed from other E galaxies oc92 ; ohl97 , an age gradient may be involved.
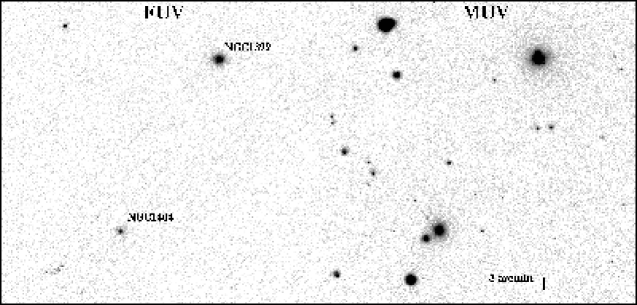
Spiral Galaxies: The first important conclusion concerning spiral UV morphologies is that, despite early expectations, the normal dust distribution in spiral disks does not strongly attenuate UV light, even in the case of edge-on systems such as NGC 4631 (see Fig. 3). It appears that the heaviest UV extinction is confined to thin layers and the immediate vicinity of young H II complexes and that the UV light emerges from thicker star distributions or regions evacuated of dust by photodestruction or winds all97 ; fot88 ; calz94 ; calz97 .
Early-type spirals and barred galaxies tend to exhibit the largest morphological changes with wavelength. Figure 4 shows the Sb galaxy M81, whose Hubble type becomes dramatically later in the UV. The optical bulge is dominated by cool stars, and it progressively diminishes at shorter wavelengths. In the FUV, the cool MS and RGB have vanished, but the UVX component of the bulge is still extended about 30. Hot OB associations in the sprial arms increase in brightness in the UV so that the galaxy looks like a nearly empty ring system; at optical wavelengths, such structures would be associated with a short-lived, non-equilibrium situation. In other cases (e.g. M83), cool bars vanish in the UV. Van den Bergh et al. vdb96 noted that there are very few, if any, barred galaxies in the Hubble Deep Field. Some, though not all, of this effect may be a morphological k-correction.

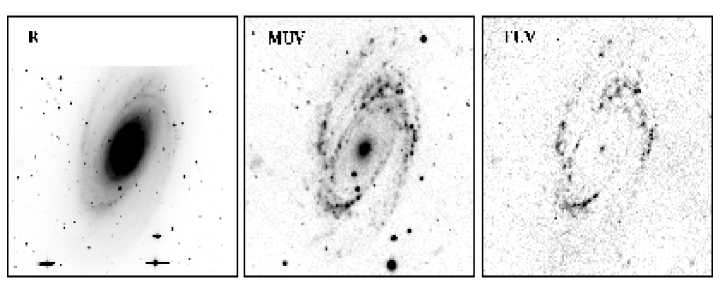
The UV light distributions of spirals are, in general, flatter (i.e. have longer scale lengths) and more irregular than at optical wavelengths lands92 ; corn94 . Figure 5 shows the luminous Sc galaxy M101. The central concentration strongly diminishes in the UV, while the prominent OB associations in the disk are emphasized. An object like this viewed at high redshift, after surface brightness and resolution effects are included, gives the appearance of a tidal interaction between a small swarm of independent galaxies. Simulations of such effects for M101 and the Sb galaxy M31 are shown in boh91 and om97 .
Although one normally thinks of massive, hot stars as confined to compact regions in the spiral arms, in fact, of the total far-UV light in M101 is diffuse. Only about 25% of the H light is diffuse. Large far-UV diffuse light fractions have also been found in M74 corn94 and M33 buat94 . The origin of the diffuse FUV light—e.g. to what extent it may be from grain scattering as opposed to in situ hot sources—is not established.

UV images like these permit us to begin to probe the star formation history of disk galaxies on timescales of –1000 Myr, intermediate between those relevant to emission lines ( Myr) and the optical/IR continuum ( Myr). Because the luminosity of a single generation of stars decays roughly as a power law, the star formation history contributes to light at a given wavelength as follows: , where is the lookback time in Myr and is the present epoch. From synthetic models (e.g. [1]) is approximately 4.3, 1.5, and 0.8 in the Lyman continuum (Balmer emission lines), far-UV continuum, and optical continuum, respectively. By combining multiband data, one can begin to place meaningful constraints on over the past few Gyr. Cornett et al. corn94 used UIT images to investigate the radial dependence of over the disk of the Sc galaxy M74 and found a remarkably organized pattern of change. The mechanisms by which disks achieve such strong regulation of star formation are not, I think, well understood oc97 .
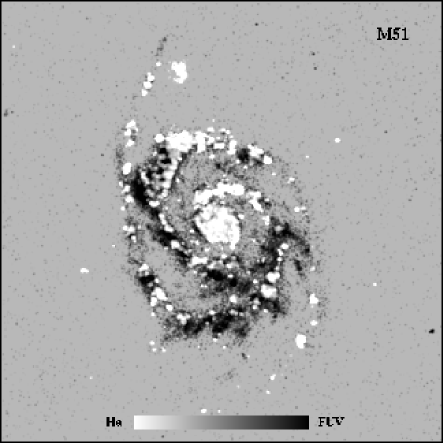
Comparisons of very recent to intermediate-age star formation can be made by producing H/far-UV difference images, as in Fig. 6 for M51. A similar map with lower resolution was published by the FOCA group bers94 . One can see how the 50–100 Myr year old populations (FUV-bright) are usually spread farther downstream from the density wave than the 5 Myr-old, H-bright populations. There is a sense of multiple FUV wavelets here, with feathery extensions inclined in pitch angle to the main spiral pattern.
Irregular and Peculiar Galaxies: Except when they have cool bars (as in the LMC), morphological k-corrections for irregular galaxies tend to be smaller than for large spirals because even their optical light is usually dominated by hot stars. Their UV appearance can be highly fragmented, however. The advantages of the UV in dissecting star formation histories (e.g. in the SMC corn97 ) and detecting very cool or very hot interstellar material are as described above. Galaxies in which the normally thin dust layers have been disturbed by tidal interactions or other events can have dramatically different UV morphologies. The best nearby examples are M82 courv90 ; gsh97 and Centaurus A marc97 . In M82, the plume of material ejected along the minor axis contains enough dust to become a reflection nebula at mid-UV wavelengths.
With only limited coverage of a small galaxy sample, we have hardly begun serious UV imaging studies of galaxies. Deep, all-sky UV surveys as well as high resolution UV multiband imagery of galaxies out to are badly needed to establish the cosmic history of star formation and to provide the tools needed to interpret the very distant universe.
I am grateful to Pam Marcum, George Becker, Joel Offenberg, and Bob Cornett for help in assembling the images shown here and to Ted Stecher and our other colleagues on the UIT team for continuing support. This work has been supported in part by NASA grants NAGW-2596 and NAG5-700.
References
- (1) Bruzual, G., & Charlot, S. 1993, ApJ, 405, 538
- (2) Dorman, B., & O’Connell, R. W. 1997, this conference
- (3) Allen, R. J., Knapen, J. H., Bohlin, R., & Stecher, T. P., ApJ, in press
- (4) Donas, J., Milliard, B., Laget, M., & Deharveng, J.M. 1981, A&A, 97, L7
- (5) Stecher, T., Bohlin, R., Hill, J., & Jura, M. 1982, ApJ, 225, L99
- (6) Witt, A., Stecher, T., Boroson, T., & Bohlin, R. 1989, ApJ, 336, L21
- (7) Martin, C., Hurwitz, M., & Bowyer, S. 1990, ApJ, 354, 220
- (8) Cornett, R. H. et al. 1992, ApJ, 395, L9
- (9) Hill, R. S. et al. 1995, ApJ, 446, 622
- (10) Maoz, D., et al. 1996, ApJS, 107, 215
- (11) O’Connell, R.W. 1987, AJ, 94, 876
- (12) Pei, Y. C., & Fall, S. M., 1995, ApJ, 454, 69
- (13) Lilly, S. J., et al. 1995, ApJ, 455, 108
- (14) Madau, P. et al. 1996, MNRAS, 283, 1388
- (15) Bohlin, R. C. et al. 1991, ApJ, 368, 12
- (16) Abraham, R. G., et al. 1996, MNRAS, 279, L47
- (17) Giavalisco, M., et al. 1996, AJ, 112, 369
- (18) Deharveng, J.-M., et al. 1994, A&A, 289, 715
- (19) Page, T., & Carruthers, G. R. 1981, ApJ, 248, 906
- (20) O’Connell, R. W. 1991, AdSpR, 11, (11)71
- (21) Milliard, B. Donas, J., & Laget, M. 1991, AdSpR, 11, 11(135)
- (22) Bersier, D., Blecha, A., Golay, M., & Martinet, L. 1994, A&A, 286, 37
- (23) Stecher et al. 1997, PASP, 108, 584
- (24) Cheng, K.-P. et al. 1996, Ground-Based CCD Imaging in Support of the Astro/UIT Mission (NSSDC)
- (25) Marcum, P. et al. 1997, in preparation; and this conference
- (26) Code, A. & Welch, G. 1979, ApJ, 228, 95
- (27) Bohlin, R.C., et al. 1985, Ap.J., 298, L37
- (28) O’Connell, R. W. et al. 1992, ApJ, 395, L45
- (29) Ohl, R. G., et al. this conference and in preparation
- (30) Burstein, D., et al. 1988, ApJ, 328, 440
- (31) Dorman, B., O’Connell, R. W., & Rood, R. T. 1995, ApJ, 442, 105
- (32) Brown, T. M., Ferguson, H. C., & Davidsen, A. F. 1995, ApJ, 454, L15
- (33) Yi, S., Demarque, P., & Oemler, A. 1997, ApJ, in press
- (34) Fanelli, M. N., O’Connell, R. W., & Thuan, T. X. 1988, ApJ, 334, 665
- (35) Calzetti, D., Kinney, A. L., & Storchi-Bergmann, T. 1994, ApJ, 429, 582
- (36) Calzetti, D. this conference
- (37) van den Bergh, S., et al. 1996, AJ, 112, 359
- (38) Landsman, W. B. et al. 1992, ApJ, 401, L83
- (39) Cornett, R. H. et al. 1994, ApJ, 426, 553
- (40) Buat, V., et al. 1994, A&A, 281, 666
- (41) O’Connell, R. W. & Marcum, P. 1997, in HST and the High Redshift Universe, eds. N. Tanvir, A. Aragon-Salamanca, & J. V. Wall (WSP), in press
- (42) O’Connell, R. W. 1997, in Star Formation Near and Far, eds. S. S. Holt & L. G. Mundy (AIP), 491
- (43) Cornett, R. H. et al. 1997, AJ, 113, 1011
- (44) Courvoisier, T. J.-L., et al. 1990, A&A, 238, 63
- (45) Hennessy, G. S. et al. 1997, in preparation