Is there really a super-massive black-hole in M87? ††thanks: Based on observations with the NASA/ESA Hubble Space Telescope, obtained at the Space Telescope Science Institute, which is operated by AURA, Inc., under NASA contract NAS 5-26555 and by STScI grant GO-3594.01-91A
Abstract
We present the first HST long-slit spectrum of a gaseous disk around a candidate super-massive black-hole. The results of this study on the kinematics of the gaseous disk in M87 are a considerable improvement in both spatial resolution and accuracy over previous observations and requires a projected mass of M (M for a disk inclination ) concentrated within a sphere whose radius is less than 005 (3.5 pc) to explain the observed rotation curve. The kinematics of the ionized gas is well described by a thin disk in keplerian motion. A lower limit to the mass-to-light ratio of this region is M/L110, significantly strengthening the claim that this mass is due to the presence of a central black-hole in M87.
keywords:
black hole physics - line: profiles - galaxies: active - galaxies: individual: M87 - galaxies: nuclei - galaxies: kinematics and dynamics1 Introduction
One of the cornerstones of the contemporary view of the physics of active galactic nuclei is that their energy output is generated by accretion of material on to a massive black-hole (e.g. Blandford 1991, Antonucci 1993 and references therein). Considerable controversy has surrounded attempts to verify the existence of black-holes in nearby giant elliptical galaxies using ground-based stellar dynamical studies (Sargent et al. 1978, Young et al. 1978, Duncan & Wheeler 1980, Binney and Mamon 1982). To-date the best available data remains inconclusive, largely because of the difficulty of detecting the high-velocity wings on the absorption lines, which are the hallmark of a black-hole (van der Marel 1994, Dressler & Richstone 1990, Jarvis & Pelletier 1991, Kormendy & Richstone 1995). One of the major goals of HST has been to establish or refute the existence of black-holes in active galaxies by probing the dynamics of AGN at much smaller radii than can be achieved from the ground. Already persuasive evidence has been found that apparently quiescent nearby galaxies contain black-holes (van der Marel 1997a, Kormendy et al. 1996) but, locally, there are few candidate galaxies which might harbour a super-massive black-hole large enough to have sustained Quasar type activity earlier in their evolution (Rees 1997). M87 is the nearest and brightest elliptical believed to harbour such a super-massive black-hole.
M87, the dominant giant elliptical galaxy at the center of the Virgo cluster, was the first galaxy for which tenable stellar dynamical and photometric evidence was advanced for the presence of a supermassive black-hole (Sargent et al. 1978, Young et al. 1978). Subsequent stellar dynamical models showed however that the projected stellar density and the observed rise in velocity dispersion did not necessarily imply the presence of a black-hole, but could still be explained by the presence of a stellar core with an anisotropic velocity tensor(Duncan & Wheeler 1980, Young 1980, Binney and Mamon 1982).
An important step in the quest to verify the existence of a massive black-hole in M87 has been the discovery from HST emission line (Crane et al. 1993, Ford et al. 1994) and continuum [Macchetto 1996] imagery of a circum-nuclear disk of ionized gas which is oriented approximately perpendicularly to the synchrotron jet [Sparks et al. 1996]. Similar gaseous disks have also been found in the nuclei of a number of other massive galaxies (Jaffe et al. 1993, Ferrarese et al. 1996). Because of surface brightness limitations on stellar dynamical studies at HST resolutions, the kinematics of such disks are in practice likely to be the only way to determine if a central black-hole exists in all but the very nearest galaxies.
Previous HST spectroscopic observations (Harms et al. 1994, Ford et al. 1996) of the gas disk at several discrete locations on opposite sides of the nucleus showed a velocity difference of 1000 km s-1. On the assumption that these motions arise in a thin rotating keplerian disk, this lead to a central dark mass of M87 in the range 1 to 3.5. An important shortcoming of this estimate is the assumption about the inclination of the disk with respect to the line of sight which cannot be properly determined neither by using the few velocities derived from the FOS observations nor from the WFPC2 imaging data. Harms et al. (1994) assumed a disk inclination of , as derived by an ellipse fitting of the H+ image, and this resulted in a misleadingly accurate mass value. Actually, such value for the inclination was determined at distances between 03 and 08 from the nucleus, because in the inner regions the disk emission was subsumed by the bright central point-source. Indeed Ford et al. (1996) quoted a larger uncertainty in their mass determination but it is not clear from that short paper whether they have fully taken into account all of the possible values of the disk inclination which are consistent with the data. Implicit in this measurement of the mass of the central object is also the assumption that the gas motions in the innermost regions reflect keplerian rotation and not the effects of non-gravitational forces such as interactions with the jet which are known to dominate the gas motions in the inner regions of many AGN (Whittle et al. 1988, Axon et al. 1989). Establishing the detailed kinematics of the disk is therefore critical. Currently their result still provides the most convincing observational evidence in favour of the black-hole model.
In order to determine whether the motions observed in M87 are due to keplerian rotation, we have re-investigated the velocity field at high spatial resolution with HST. Our results demonstrate that both the observed rotation curve and line profiles are consistent with a thin-disk in keplerian motion and allow us to determine an improved estimate for the mass of the black-hole. On the assumption that the distance to M87 is 15 Mpc, 017pc.
2 Observations and Data Reduction
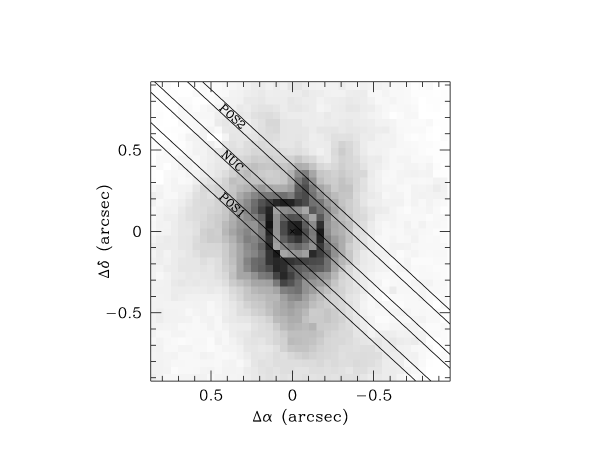
The circumnuclear disk of M87 was observed on 1996 July 25th, with the COSTAR corrected Faint Object Camera f/48 long-slit spectrograph on board the Hubble Space Telescope. An F305LP filter, was used to isolate the first order spectrum which covers the 3650-5470 Å region. All the spectra have a pixel size of 00287 in the spatial direction and cover the spectral lines of 3726,3729 Å, H4861 Å, and 4959,5007 Å at a resolution of 1.78 Å per pixel and were taken in the 1024x512 non–zoomed format of the Faint Object Camera. An interactive acquisition image (F140W filter) was first obtained to accurately locate the nucleus. The slit, with dimensions of 1350063 at a position angle of 47∘, was then stepped across the nucleus at three positions separated by 02. The integration times for the inner spectrum was 7761 second while those of the two outer spectra where 2261 seconds. Comparing the continuum flux observed in the spectra with the luminosity distribution derived from a F342W FOC, f/96 archival image we could estimate that the inner slit position was located to within 007001 of the nucleus. The slit positions used are shown in Figure 1 overlaid on an H+ WFPC2 image of the gaseous disk of M87 obtained from the HST data archive.
The distortion induced by the optics and the magnetic focusing of the detector was corrected by using the equally spaced grid of reseau marks, etched onto the photocathode of the detector [Nota, Jedrzejewski & Hack, 1995]. The distortion induced by the spectroscopic mirror and the grating were corrected using spectra of the planetary nebula NGC 6543 and of the globular cluster 47 Tucanae for the slit and dispersion directions respectively which are then characterized by maximum uncertainties of 0.45 pix and 0.28 pix (i.e. 0.8 Å and 8 mas) when comparing measurements all across the detector. After the background subtraction, the only line with enough signal to be suitable for velocity measurements was 3726,3729 Å, which was then fitted (row by row) using the task LONGSLIT in the TWODSPEC FIGARO package [Wilkins & Axon 1992]. In all cases the line profile is well represented by a gaussian function. Full details of the observation strategy and data reduction are given in a companion paper [Macchetto et al. 1997].
3 Results

The measured variations of radial velocity and continuum flux for the central slit are shown in Figure 2. It is immediately apparent that the observed velocity field does not show the very steep rise in velocity one would naively expect to be the signature of a massive black-hole. Instead over the central 02 the velocity varies approximately linearly with position, with an amplitude of 600 km s-1, while at larger radii it flattens, and eventually starts to turn over. As shown in the following section, this apparent flattening is a consequence of both the finite distance between the slit and the nucleus and the smearing of the instrumental spatial PSF.
The comparison between the new FOC data and the archival FOS observations is shown in Fig. 3 where we include only those FOS apertures which overlapped our slit at NUC. Within their substantially larger uncertainties, the previous velocity measurements (Harms et al. 1994, Ford et al. 1996) are in reasonable accord with our results. The comparison shows clearly the increase in spatial resolution and sampling of the FOC observations with respect to the FOS ones. Moreover, our data provide considerably more reliable relative spatial positions, since all the data points were obtained simultaneously on the detector. On the contrary, the limitations of the FOS target acquisition procedure can produce errors as large as 01 [van der Marel et al. 1997b] and such uncertainty in the position is crucial in the inner 02 when comparing observations taken at different epochs.
4 Discussion
To understand the implications of our results for the mass distribution in the center of M87 we built models of the gas kinematics both under the assumption of the existence of a central black-hole, and an extended mass distribution following a Plummer Potential.
In the hypothesis of a thin disk rotating in circular orbits, neglecting the slit width, instrumental PSF and luminosity distribution of the line, the observed velocity is given by:
| (1) |
where
and
is the distance of the slit from the nucleus, is the coordinate along the slit and represents the “true” distance of each point on the slit from the nucleus ( when ). is the systemic velocity, is the inclination of the disk with respect to the line of sight ( for the edge-on case), is the angle between the slit and the line of nodes. is the gravitational potential and results
where and are the black-hole mass and core radius, respectively.
The effects of the f/48 spatial PSF and the finite slit size are taken into account by averaging the velocity field using the luminosity distribution and PSF as weights. The model rotation curve is thus given by:
| (2) |
where is the keplerian velocity derived in eq. 1, is the intrinsic luminosity distribution of the line, is the spatial PSF of the f/48 relay along the slit direction. is the impact parameter (measured at the center of the slit) and is the slit size, S is the position along the slit at which the velocity is computed and is the pixel size of the f/48 relay. For the PSF we have assumed a gaussian with 008 FWHM i.e.
| (3) |
Because the intrinsic surface brightness distribution of the emission line disk interior to the HST PSF is not known, we modeled this with two extreme parameterized forms, either as a power law or as an exponential. We then fitted the model rotation curves using a minimization. The free parameters of the fit, in the case of the black-hole model, were the inclination of the disk with respect to the line of sight, the angle between the disk and the line of nodes (positive angles indicate that the line of nodes has a larger position angle than the slit), the position along the slit of the point closest to the nucleus, the impact parameter of the slit, the systemic velocity and the mass of the black-hole. The uncertainties are dominated by the poorly determined inclination of the gas disk within the HST PSF. Taking into account the possible ranges of variation of the model free parameters, which were derived using a large Montecarlo generated grid of solutions, we find a best estimate of the projected mass of the black-hole of M. Three representative model fits are shown in Fig. 3. The solid, dashed and dotted lines represent three black-hole model fits which are compatible with the observations and differ in the value of the angle between the slit and the line of nodes of the gaseous disk (, and , respectively). The best fit model, represented by the solid line in the upper panel has a disk inclination, , angle of line of nodes, , impact parameter, and a systemic velocity, km s-1 (1080; 1355), leading to a mass estimate for the black-hole of M. The values in parentheses represent the allowed errors on the values of the parameters. As shown by this analysis, the main source of uncertainty on the deprojected mass is the value of the disk inclination which more than doubles the total error.

In the case of an extended mass (Plummer) distribution the observations are reproduced only if at least 60% of the total mass is confined within a sphere of 005 (3.5pc). Since the maximum spatial extent is determined by the PSF FWHM (008) this possible mass distribution is therefore indistinguishable from a point mass.
We have demonstrated that the data are fully compatible with a thin disk in keplerian rotation around a central mass condensation, at least within the inner 02-03. At larger distances, the signal-to-noise in our data decreases and, consequently, the error bars increase. The few points that appear to deviate from the keplerian rotation curve, do not provide enough information or weight to warrant the fit of more complex models, such as thick disks or sub-keplerian disks with outflows.
Can we rule out the alternative explanation that the observed rotation is due to an extended mass? A strong argument against this interpretation is that a mass of distributed within 3.5pc yields a mean density of pc-3, higher than the highest density encountered in the collapsed cores of galactic globular clusters. Moreover, the V band flux in a region 1616 pc2 of the nucleus yields a mass-to-light ratio M/LV110 /LV⊙ (LV⊙=0.113 ) which is far higher than those predicted for stellar clusters by evolution synthesis [Bruzual 1995]. The mass condensation in the nucleus of M87 can therefore not be a cluster of normally evolved stars. Even more exotic possibilities (e.g. massive clusters of neutron stars, other dark objects etc.) have been discussed by van der Marel et al. (1997a) in the case of M32 and found to be equally improbable. Therefore the most natural explanation for the central mass condensation of M87 is that it is due to the presence of a black-hole.
The data and the analysis presented by Harms et al. (1994) and Ford et al. (1996) indicated the presence of a velocity shear which could be consistent which the presence of a black-hole. Here we have demonstrated the existence of a keplerian rotation curve in the disk and we have also excluded the possibility that it might be due to a mass concentration more extended than our spatial resolution.
5 Conclusions
We have presented the first HST long-slit spectrum of a gaseous disk around a candidate supermassive black-hole. We have obtained a rotation curve in the 3736,3729 which extends up to 1″ from the nucleus. We have modeled the rotation curve in the case of a thin disk in circular orbits around a supermassive black-hole and we have derived a projected mass of M (M for a disk inclination, ) concentrated within a sphere whose radius is less than 005 (3.5 pc). We have shown that the observed characteristic of the data are well explained under the working hypothesis of circular keplerian orbits and that there is no substantial contribution from a mass distribution more extended than our spatial resolution. Given the inferred mass-to-light ratio M/LV110 /LV⊙ the most natural and likely explanation is that of a supermassive black-hole. In conclusion, with respect to previous determinations, we have improved the accuracy of the mass estimate, demonstrated its reliability by verifying the assumption of the thin disk in circular, keplerian rotation and excluded the possibility of a mass distribution more extended than the spatial PSF.
To make further progress there are a number of possibilities the easiest of which is to make a more comprehensive and higher signal-to-noise 2D velocity map of the disk to better constrain its parameters. The biggest limitation of the present data is that, even by observing with HST at close to its optimal resolution at visible wavelengths, some of the important features of the disk kinematics are subsumed by the central PSF. Until a larger space based telescope becomes available, the best we can do is to study the gas disk in Ly and gain the Rayleigh advantage in resolution by moving to the UV. This may be the only way to proceed because of the difficulty of detecting the high velocity wings which characterize the stellar absorption lines in the presence of a supermassive black-hole.
Acknowledgments
We thank M. Livio, S. Casertano and M. Stiavelli for useful discussion through the course of this work. We thank the referee, Dr. S. Sigurdsson, for his helpful comments on the paper. The results are based on observations with the NASA/ESA Hubble Space Telescope, obtained at the Space Telescope Science Institute. STScI provided partial support through a GO grant (A.M.). STScI is operated by the Association of Universities for Research in Astronomy, Inc., under contract to NASA.
References
- [Antonucci 1993] Antonucci R., 1993, ARA&A, 31, 473
- [Axon et al. 1989] Axon D. J., Unger S. W., Pedlar A., Meurs E. J. A, Whittle D. M. and Ward M. J., 1989, Nature, 341, 631
- [Binney & Mamon 1982] Binney J. and Mamon S., 1982, MNRAS, 200, 361
- [Blandford 1991] Blandford R.D., 1991, “Physics of AGN”, Proceedings of Heidelberg Conference, Springer-Verlag, eds. W.J. Duschl and S.J. Wagner, p. 3
- [Bruzual 1995] Bruzual G.A., 1995, “From Stars to Galaxies: the Impact of Stellar Physics on Galaxy Evolution”, Proceedings of Crete Conference, eds. C. Leitherer, U. Fritze-von Alvensleben and J. Huchra, ASP Conf. Series, vol. 98, p. 14
- [Capetti et al. 1996] Capetti A., Axon D.J., Macchetto F., Sparks W. B. and Boksenberg A., 1996, ApJ, 469, 554
- [Crane et al. 1993] Crane P., Stiavelli M., King I.R., Deharveng J.M., Albrecht R., Barbieri C., Blades J.C., Boksemberg A., Disney M.J., Jakobsen P., 1993, AJ, 106, 1371
- [Dressler & Richstone 1990] Dressler A., Richstone D.O., 1990, ApJ, 348, 120
- [Duncan & Wheeler 1980] Duncan M.J. and Wheeler J.C., 1980, ApJ, 237, L27
- [Ferrarese et al. 1996] Ferrarese L., Ford H.C., Jaffe W., 1996, AJ, 470, 444
- [Ford et al. 1994] Ford H.C., Harms R.J., Tsvetanov Z.I., Hartig G.F., Dressel L.L., Kriss G.A., Bohlin R.C., Davidsen A.F., Margon B., Kochhar A.K., 1994, ApJ, 435, L27
- [Ford et al. 1996] Ford H.C., Tsvetanov Z.I., Hartig G.F., Kriss G.A., Harms R.J., Dressel L.L., 1996, “Science with the HST – II”, Eds. P. Benvenuti, F. Macchetto and E. Schreier, p. 192
- [Harms et al. 1994] Harms R.J., Ford H.C., Tsvetanov Z.I., Hartig G.F., Dressel L.L., Kriss G.A., Bohlin R.C., Davidsen A.F., Margon B., Kochhar A.K., 1994, ApJL, 435, L35
- [Kormendy & Richstone 1995] Kormendy, J. and Richstone, D., 1995, ARA&A, 33, 581
- [Kormendy et al. 1996] Kormendy J., et al., 1996, ApJ, 459, L57
- [Jaffe et al. 1993] Jaffe W., Ford H.C., Ferrarese, L., van den Bosch, F.C., O’Connell R.W., 1993, Nature, 364, 214
- [Jarvis & Peletier 1991] Jarvis M., Peletier R.F., 1991, A&A, 247, 315
- [Macchetto 1996] Macchetto F., 1996, “Science with the HST – II”, Paris, Eds. P. Benvenuti, F. Macchetto and E. Schreier, p. 59
- [Macchetto et al. 1997] Macchetto F.D., Marconi A., Axon D.J., Capetti A., Sparks W., Crane P., 1997, ApJ, submitted
- [Nota, Jedrzejewski & Hack, 1995] Nota A., Jedrzejewski R., Hack W., 1995, Faint Object Camera Instrument Handbook Version 6.0, Space Telescope Science Institute
- [Rees 1997] Rees M. J. , 1997, in “Unsolved problems in astrophysics”, Princeton University Press, eds. J.N. Bachall and J.P. Ostriker, 181
- [Sargent 1978] Sargent W.L.W., Young P.J., Boksenberg A., Shortridge K., Lynds C.R., Hartwick F.D.A., 1978, ApJ, 221, 731
- [Sparks et al. 1996] Sparks, W.B., Biretta, J.A. and Macchetto F., 1996, ApJ, 473, 254
- [van der Marel 1994] van der Marel R.P., 1994, MNRAS, 270, 271
- [van der Marel et al. 1997a] van der Marel R.P., de Zeeuw P.T., Rix H.W., Quinlan G.D., 1997a, Nature, 385, 610
- [van der Marel et al. 1997b] van der Marel R.P., de Zeeuw P.T., Rix H.W., 1997b, ApJ submitted
- [Whittle et al. 1988] Whittle, D. M., Ward, M. J., Meurs, E. J. A., Pedlar, A., Unger, S. W. and Axon, D. J., 1988, ApJ, 326, 125
- [Wilkins & Axon 1992] Wilkins T.W. and Axon D.J., 1992, in Astronomical data analysis software and systems I, Ast. Soc. Pac. Conf. Ser. 25, p. 427
- [Young et al. 1978] Young P.J., Westphal J.A., Kristian J., Wilson C.P., Landauer F.T., 1978, ApJ, 221, 721
- [Young 1980] Young P.J., 1980, ApJ, 242, 1232