X-RAY OBSERVATIONS OF DISTANT LENSING CLUSTERS
S. Schindler
Max-Planck-Institut für extraterrestrische Physik,
Giessenbachstraße, 85740, Garching, Germany
Max-Planck-Institut für Astrophysik,
Karl-Schwarzschild-Straße 1, 85740, Garching, Germany
Abstract
X-ray observations of three clusters are presented: RXJ1347.5-1145, Cl0939+47, and Cl0500-24. Although these clusters are the in same redshift range (0.32 - 0.45) and act all as gravitational lenses, they show very different properties. RXJ1347.5-1145 seems to be an old, well relaxed system, with a relaxed morphology, high X-ray luminosity, high temperature, high metallicity and strong cooling flow. The other two clusters have the appearance of young systems with substructure and low X-ray luminosity. The optical and X-ray luminosity shows hardly any correlation. A comparison with nearby clusters shows that many properties – like e.g. the metallicity or the amount of subclustering – show a large scatter and no clear trend with time.
1 Introduction
Distant clusters are important objects to test cosmological models. A comparison of the properties of distant clusters with the ones of nearby clusters gives insight when and how the evolution took place.
Here we present the X-ray properties of three relatively distant clusters in the redshift range of 0.32-0.45. All show a gravitational lensing effect. RXJ1347.5-1145 and Cl0500-24 show bright arcs (Schindler et al. 1995; Giraud 1988), Cl0939+47 shows a weak lensing signal (Seitz et al. 1996). The presence of a gravitational lensing signal means that they must be all massive clusters.
From these characteristics one might expect that they are similar in other properties, too. But already the way how they are detected shows that they are by far not similar. While Cl0939+47 and Cl0500-24 were detected optically (Cl0939+47 is actually the most distant Abell cluster), RXJ1347.5-1145 was detected in X-rays in the ROSAT All Sky Survey. In the following we will show that also their X-ray properties are very different.
2 The most luminous X-ray cluster RXJ1347.5-1145
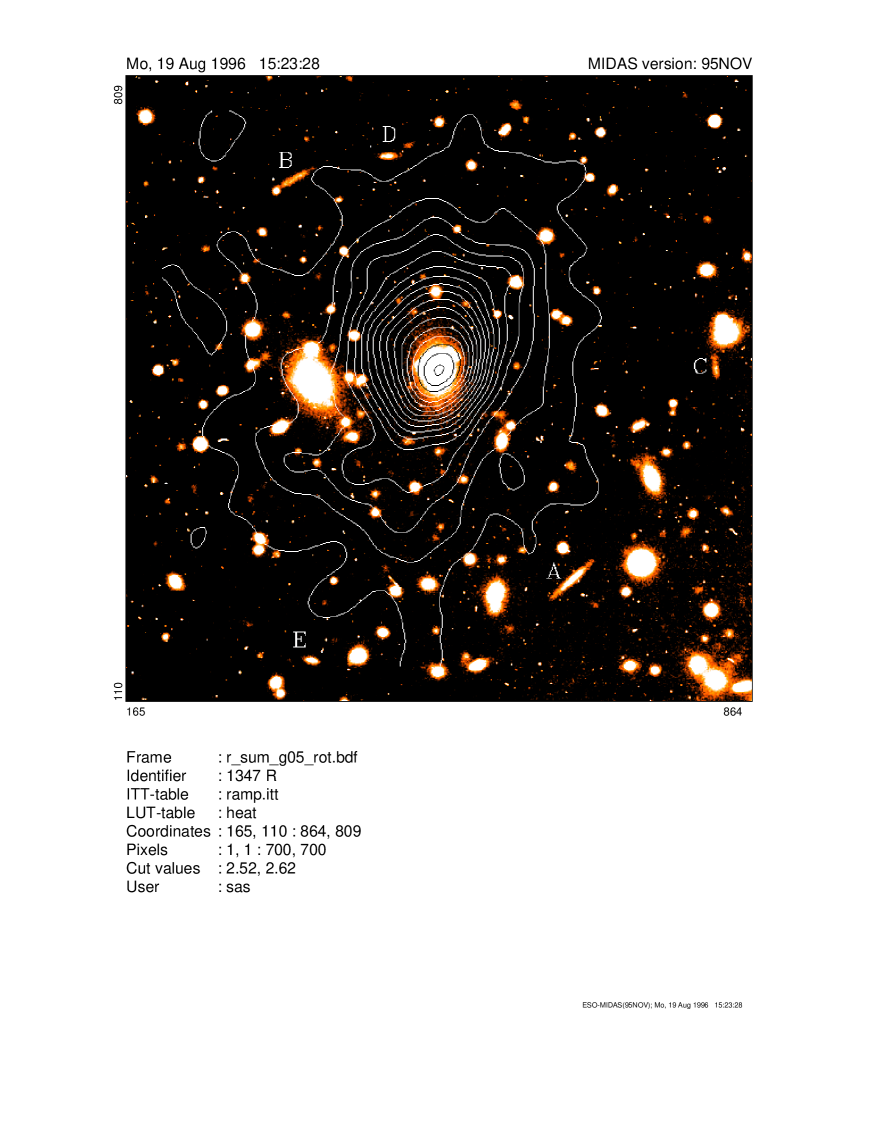
For the analysis of RXJ1347.5-1145 we use a ROSAT/HRI observation (see Fig. 1) of 15760 seconds and an ASCA observation of 58300 seconds. These data reveal several extreme cluster properties.
The X-ray luminosity of RXJ1347.5-1145 is with erg/s in the ROSAT band (0.1-2.4 keV) or erg/s bolometric the highest luminosity of a cluster found so far.
In the ASCA spectrum (Fig. 2) an Fe line can be detected. It corresponds to a metallicity of in solar units. As this is a typical value for nearby clusters, it is quite surprising to find it in such a relatively distant cluster. From the ASCA spectrum we can also determine the temperature. With keV RXJ1347.5-1145 is a relatively hot cluster.

The strongly peaked emission (see Fig.1) suggests the presence of a cooling flow. We find a central cooling time of yr. With the standard assumptions we derive a cooling flow radius of 29 arcseconds (200 kpc) and a mass accretion rate of more than 3000 /yr. Obviously, RXJ1347.5-1145 is also in terms of cooling flow an extreme. Such a strong cooling flow suggests that was no merging recently. Otherwise it would have disrupted the cooling flow or at least decreased the mass accretion rate.
For a comparison of lensing and X-ray masses we calculate the surface mass density from the X-ray data at the radius of the arcs, . The lensing mass is still preliminary because the redshift of the arcs are only estimated and the lens model is very simple. For a redshift range of z=0.7-1.2, we find a lensing mass of 4.4-7.8. This discrepancy can be removed with a better lens model.
Summarizing, although RXJ1347.5-1145 is a distant cluster, it shows the properties of a well evolved, old system: spherically symmetric morphology, high luminosity, high temperature, high metallicity, and obviously no merging in the recent past because of the huge cooling flow (see Table 1). For more details see Schindler et al. (1997).
3 The optically rich cluster Cl0939+47
Cl0939+47 is an extremely rich, optically well studied cluster (Dressler & Gunn 1992). For the X-ray analysis we use a ROSAT/PSPC observation of 14350 ksec.
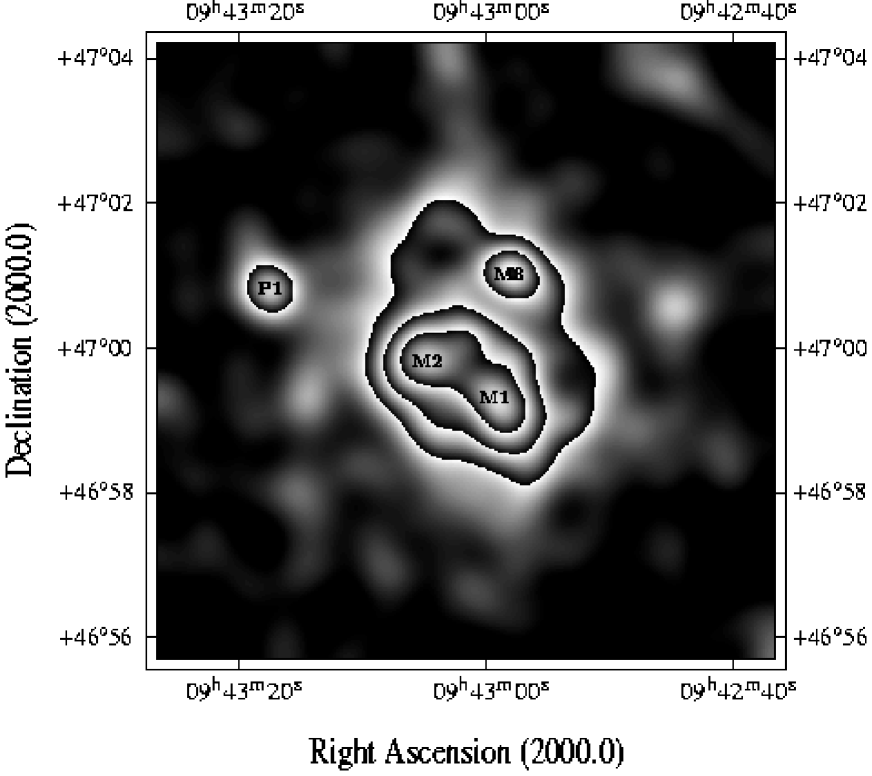
Fig. 3 shows the ROSAT/PSPC image of Cl0939+47. It has the appearance of a non-virialized cluster. It is not centrally peaked like RXJ1347.5-1145 but shows substructure. There are three maxima visible. Ellipse fits to different isophote levels yield ellipticities up to 0.75.
The X-ray luminosity is with erg/s (0.1-2.4 keV) rather on the low side for such a rich cluster. Also the temperature derived from the PSPC spectrum, keV, is relatively low.
A mass comparison is difficult for this cluster because, firstly, the weak lensing mass was determined only in the L-shaped region from an HST/WFPC observation (Seitz et al. 1996) and the X-ray mass estimate has a large error because spherical symmetry has to be assumed, which is not a good approximation for this cluster. But it seems that the X-ray mass is about a factor of three smaller than the lensing mass.
All the X-ray properties of Cl0939+47 (substructure, low X-ray luminosity, low temperature) as well as the large fraction of post-starburst galaxies (Belloni et al. 1995) point to a young, non-relaxed system (for details see Schindler & Wambsganss 1996).
4 Cl0500-24: a cluster with two subclusters in the line of sight
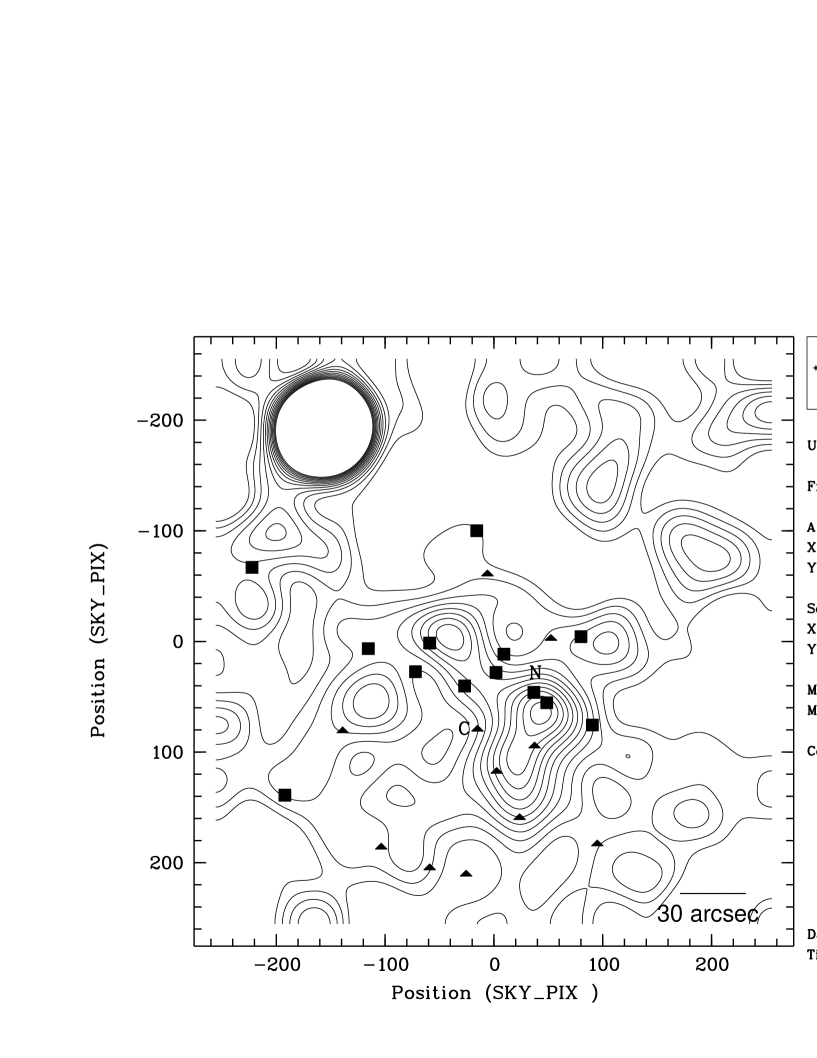
The cluster Cl0500-24 is similar to Cl0939+47 in many respects. It is also an optically rich cluster, which shows substructure. The substructure is not only found in the ROSAT/HRI image (Fig. 4), but also in the velocity distribution of the cluster galaxies (Infante et al. 1994): they found two subclusters with a relative velocity of about 3000 km/s.
A comparison of the spatial distribution of the subcluster galaxies and the X-ray emission (Fig. 4) suggests that only one of the subclusters is X-ray luminous, the subcluster around galaxy N. This is an indication that the N subcluster is massive. The C subcluster, however, must be massive as well, because the arc has its curvature towards galaxy C. Obviously, there are two components in this cluster which have a very different gas content.
The X-ray luminosity, erg/s, is surprisingly low for such a rich cluster. This fits well with the assumption that only part of the cluster is X-ray luminous.
An X-ray mass estimate yields a smaller mass than the lensing mass model by Wambsganss et al. (1989). With the new ASCA temperature (Ota et al. 1997; see also Mitsuda, this volume) the X-ray mass is at 22 arcmin while the lensing model gives a mass of at the same radius. This discrepancy can be explained easily if one assumes that the cluster consists of two subclusters, out of which only one is X-ray luminous. The X-ray measurement traces only the potential well filled with gas, while lensing is sensitive to all the mass along the line of sight. Furthermore, a discrepancy can arise because the two mass estimates have different centres: the X-ray mass is centred on the X-ray maximum (i.e. close to galaxy N) while the mass model is centred close to galaxy C.
Summarizing, Cl0500-24 shows the characteristics of a young system: it has substructure and a low X-ray luminosity (for more details see Schindler & Wambsganss 1997).
| RXJ1347.5-1145 | Cl0939+47 | Cl0500-24 | |
| redshift | 0.45 | 0.41 | 0.32 |
| (0.1-2.4keV)[erg/s] | |||
| [kpc] | 57 | 1100 | 30 |
| 1.9 | 0.36 | ||
| metallicity (solar) | - | - | |
| (Mpc) | 2.0 | 0.8 | 0.5 |
| (Mpc) | |||
| gas mass fraction (Mpc) | 30-40% | 25-50% | 12-25% |
| cooling flow radius | 200 kpc | - | - |
| central cooling time | yr | yr | - |
| mass accretion rate | /yr | - | - |
5 Conclusions
Although the presented clusters are all massive and at about the same distance, they are by far not similar. Some have the appearance of young systems, still far away from virial equilibrium (Cl0939+47, Cl0500-24), others seem to be already quite old systems (RXJ1347.5-1145). This difference is not only evident from the amount of substructure but also from the X-ray luminosity, the gas temperature or the metallicity (see Tables 1 and 2). These three clusters show hardly any correlation of optical and X-ray luminosity.
| nearby | Cl0500-24 | Cl0939+47 | RXJ1347 | Cl0016+16a | AXJ2019b | |
|---|---|---|---|---|---|---|
| redshift | 0.32 | 0.41 | 0.45 | 0.55 | 1.0 | |
| (bol)[erg/s] | 0.05-5 | 0.6 | 1.1 | 21 | 5.0 | 1.9 |
| metallicity | 0.2-0.5 | 0.0-1.5c | small | 0.33 | small | |
| temperature | 2-10 | 7.2c | 2.9 | 9.3 | 8.2d | 8.6 |
| substructure | in 25%e | yes | yes | no | yes | ? |
A comparison of the properties of several distant clusters with average properties of nearby clusters is shown in Table 2. Also the clusters Cl0016+16 (Neumann & Böhringer 1997) and AXJ2019 (Hattori et al. 1997) are included. The clusters are sorted according to their distance. The comparison shows that there is a large scatter in the properties but no clear evolutionary trend (see also Mushotzky & Loewenstein 1997). This result points to a very early evolution. Obviously, for studying evolutionary effects in clusters one has to observe large samples of clusters, which are even more distant.
It is a pleasure to thank Hans Böhringer, Makoto Hattori, Doris Neumann, and Joachim Wambsganss for inspiring collaborations. I acknowledge financial support by the Verbundforschung.
References
-
Belloni, P., Bruzual, A.G., Thimm, G.J., Röser, H.-J. 1995, A&A, 297, 61
-
Dressler, A., Gunn, J.E. 1992, ApJS, 78, 1
-
Hattori, M., Ikebe, Y., Asaoka, I., Takeshima, T., Böhringer, H., Mihara, T., Neumann, D.M., Schindler, S., Tsuru, T., Tamura, T. 1997, Nature, in press
-
Giraud, E. 1988, ApJ, 334, L69
-
Infante, L., Fouqué, P., Hertling, G., Way, M.J., Giraud, E., Quintana H. 1994, A&A, 289, 381
-
Mushotzky, R.F. & Loewenstein, M. 1997, ApJ, 481, L63
-
Neumann, D.M., Böhringer, H. 1997, MNRAS, 289, 123
-
Neumann, D.M. 1997, Ph.D. Thesis, Ludwigs-Maximilians-Universität, München
-
Ota, N., Mitsuda, K., Fukazawa, Y., 1997, preprint
-
Schindler, S., Guzzo, L., Ebeling, H., Böhringer, H., Chincarini, G., Collins, C.A., De Grandi, S., Neumann, D.M., Briel U.G., Shaver, P., Vettolani, G. 1995, A&A, 299, L9
-
Schindler, S., Wambsganss, J. 1996, A&A, 313, 113
-
Schindler, S., Wambsganss, J. 1997, A&A, 322, 66
-
Schindler, S., Hattori, M., Neumann, D.M., Böhringer, H. 1997, A&A, 317, 646
-
Seitz, C., Kneib J.-P., Schneider P., Seitz, S. 1996, A&A, 314, 707
-
Tsuru, T., Koyama, K., Hughes, J.P., Arimoto, N., Kii, T., Hattori, M. 1996, in UV and X-Ray Spectroscopy of Astrophysical and Laboratory Plasmas, ed. K. Yamashita K. and T. Watanabe (Tokyo: Universal Academic Press), 375
-
Wambsganss, J., Giraud, E., Schneider, P., Weiss, A. 1989, ApJ, 337, L73