Abstract
The CRONA project is a joint enterprise between Caltech and the astronomical observatory of Rome and Naples aimed to the photometric calibration of the Second Palomar Sky Survey (POSS-II) plates and to the construction of a complete photometric and astrometric catalogue of all objects present on the POSS-II. The calibrated final catalogues of objects will be made available to the community. We present here a comparison between the performances of the SKICAT and DAOPHOT packages applied to POSS-II images of the globular cluster M92.
The CRONA (Caltech-Roma-Napoli) project
1 Osservatorio Astronomico di Capodimonte, Naples, Italy 2 Observatorio Nacional de Rio de Janeiro, Brasil 3 Palomar Observatory, Caltech, USA 4 Osservatorio Astronomico di Roma, Monteporzio, Italy
![[Uncaptioned image]](/html/astro-ph/9706238/assets/x1.png)
1 Introduction
CRONA (Caltech-ROma-NApoli) is a recent extension of a lorg term project started at Caltech in 1993 (Djorgovski et al. 1992) and aimed at the construction of the so called Palomar Norris Sky Catalog (PNSC): i.e. a complete photometric and astrometric catalogue of all objects present on the Second Palomar Sky Survey (POSS-II) for an estimated number of stars and galaxies.
The data processing pipeline consists of three steps:
-
•
digitalization of the plates, performed at ST-ScI with 15 (=1 arcsec) pixels. STScI provides also the astrometric plate solution (within 0.5 arcsec accuracy);
-
•
plate processing and catalogs construction, performed with the SKICAT software (Weir et al. 1995a) developed at Caltech;
-
•
photometric calibration of the plates through the aquisition of CCD frames of galaxy rich fields.
Details on the expected scientific results and aims are given in Djorgovski et al. (1997); in this paper we shall focus on some aspects of the data quality and on some specific applications.
2 The data
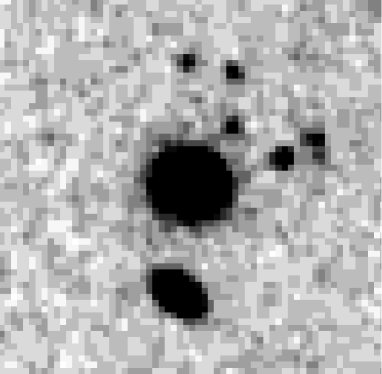
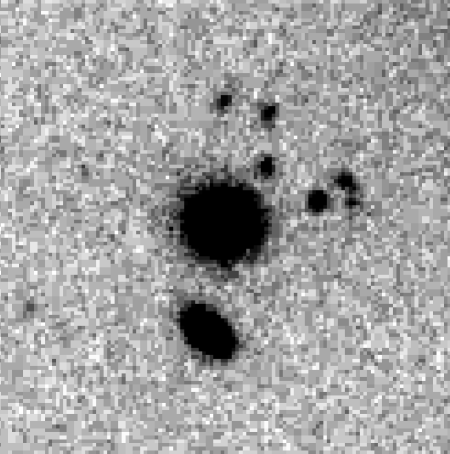
POSS-II (Reid et al. 1991) covers all the Northern Sky (including the celestial Equator) and consists of 894 plates (each sq. deg.) in three colors (, and ) spaced by 5 degree on the sky, i.e. with an overlap ( deg. on each side) between adiacent fields, much larger than for the POSS-I plates (which were taken only in two colors and with a spacing between plate centers of about 6 deg). The large overlap regions ensure several advantages: 40 % of the sky is registered at least twice in three colors; better photometric matching between adiacent plates can be obtained, and most of the sky is imaged in the central unvignetted part of the plates. Due to the improved sensitivity and resolution of the emulsion, to the use of hypersensitization and long exposure times, magnitude limits of the POSS-II material are typically 22.5, 20.8 and 19.5 in the , and respectively (Reid et al. 1991); i.e. about 1 mag fainter than for the POSS-I plates. Furthermore POSS-II plates are provided with calibration spots (missing on POSS-I), thus allowing density-intensity conversion of the data. Figure 1 gives a visual impression of the difference between POSS-I and POSS-II images for the same Coma cluster field.
Absolute photometric calibration of the plate material is obtained through CCD photometry of at least two fields per plate, taken in fair seeing conditions (better than 2 arcsec) in the , and bands of the Thuan–Gunn photometric system (Thuan & Gunn 1976, Kent 1985). Being CRONA mainly aimed to the study of the extragalactic universe, CCD fields are selected to contain a fairly large number of galaxies, in order to attain more accurate photometric calibration at low light levels, and to minimize color mismatch and reciprocity effects. Selection of target fields is performed either from the Abell and Zwicky catalogues (Abell 1958, Zwicky 1961-1968) and/or from the CRONA catalogues themselves.
There is some mismatch between the plate and CCD photometric systems: and response plates are reasonably matched by the an , while the is larger and bluer than the band and some color term correction needs to be taken into account. So far, CCD observations are made at the 1.5 m Palomar and Loiano (Bologna) telescopes, at ESO (an equatorial zone, degrees, 10 nights allocated) and soon at the new 1.5m TT1 telescope in Southern Italy. The achieved photometric accuracy, both across and within the plates and including both photometric and systematic errors, ranges from 0.05 mag at the bright end to 0.2 at for stellar objects (Djorgovski et al. 1997). For extended objects, photometric accuracy is typically 50 % worse than for stellar ones. Such low values result from both the proper managing of the plate data and from the strong requirements on the quality of CCD calibration images.
Plates are currently being reduced at three center, Caltech, Naples and Rome, with identical machines and software (SKICAT). After the arrival of one of us (RdC) to the Observatorio Nacional in Rio de Janeiro, also this institute will soon join in.
Due to vignetting, non linearity of the plate response, position dependence of the point spread function and large space disk occupation of the data (1 GB per plate), plate reduction is a tricky business. For detailed discussions, see Fayyad et al. (1996) and Weir et al. (1995a and b). Few items need however to be stressed here. The object detection algorithm in SKICAT is an improved version of FOCAS (Jarvis & Tyson 1979) which allows the use of a fixed flux detection threshold for fields in which the noise is not uniform. Star/galaxy classification is performed from the catalogues via decision trees trained on the CCD calibration frames (Weir et al. 1995a). In order to take into account the variation of the PSF shape as a function of the position on the plate, the object classification is performed locally - id est in each ”small” portion of the plate. At 20 mag in the galaxy catalogue is 90 % complete with a 20% contamination from stars (Weir et al 1995b).
The true bottle neck of the project is in the allocation of telescope time for the aquisition of the CCD calibration frames. It is reasonable to expect, however, that the whole set of plates will be calibrated before year 2000.
The main goals of the CRONA collaboration are, besides the completion of the PNSC itself, i) the study of large scale structure via the compilation of an objective catalogue of putative galaxy clusters; ii) the derivation of accurate lumnosity functions for a large sample of galaxy clusters; iii) the search for high redshift QSO’s (in the range of 3.8-4.3, Kennefick et al. 1995); iv) cross correlation of the CRONA catalogues with catalogues obtained at other wavelenghts. A variety of interesting results can however be obtained also in other fields of astrophysical research.

3 Color–magnitude diagram of M92
Some further indications on the quality of the POSS-II data can be inferred from the study of the color–magnitude diagram (CMD) of the globular cluster M92 (NGC 6341). In Fig. 2 we show the uncalibrated () diagram for the cluster M92 obtained from the and plates of the POSS-II field n. 278. The left and the central panels refer to an annular region comprised between 5 and 10 arcmin from the center of the cluster (the region below 5 arcmin is completely overexposed and overcrowded and no information can be extracted). The central and right panels show the CMD build from the SKICAT core magnitudes, defined as aperture photometry in a square box of . In order to evaluate the quality of the POSS-II data and of the SKICAT outputs we also derived a CMD of M92 using DAOPHOT (Stetson 1987) aperture photometry. The left panel in Fig. 2 gives the DAOPHOT CMD in the same radial range of the central panel ( arcmin). The DAOPHOT CMD required an interactive definition of the PSF for each plate after that the plates had been linearized using the density–intensity calibration curve provided by SKICAT. The positions of the objects fitted by ALLSTAR were then used to derive aperture magnitudes for each star. Since DAOPHOT calculates aperture magnitudes in circular spot, we used a circle having the same area of the square box used by SKICAT in deriving core magnitudes.
When comparing the left and central panel of Fig. 2, few points are worth noticing: first, the two CMDs appears to be almost similar with a scatter of the data 1 mag below the turnoff point (at ) identical for the two plots; second, there are more objects in the DAOPHOT plot; third, the SKICAT CMD appears to be cleaner than the DAOPHOT one. We have to stress that DAOPHOT magnitudes have been obtained after some interactive work and some fine tuning on images already linearized by SKICAT, whereas SKICAT magnitudes come from the stardard output of the automatic procedure.
The larger number of objects detected by DAOPHOT is mainly due to: contamination from galaxies (which are automatically removed by SKICAT), mismatching of stars (SKICAT matchs the plates using the ST-ScI astrometric solution of the plates whereas DAOPHOT data were matched in pixel space), a deeper detection threshold used for DAOPHOT, and a slightly better effectiveness of DAOPHOT in dealing with crowded fields. The cleaner apparence of the SKICAT CMD derives, instead, mainly by the lower contamination by mismatching and by the rejection of non-stellar object (galaxies, plate scratches, etc.).
The right panel of Fig. 2 shows the CMD for an annular region centered on the cluster and comprised between 50 and 60 arcmin. At such large distances from the center of the cluster, most objects are likely galactic stars with only a small fraction belonging to the cluster. The large statistics allows an accurate evaluation of the background and, therefore, permits the derivation of star counts up to large clustercentric radii as well as higher accuracy in deriving the outer isoplets and the tidal radius of the cluster.
A second hint on the quality of the data comes from the thickness of the cluster MS. Accordingly to Renzini and Fusi Pecci (1988) the intrinsic thickness of the MS is expected to be negligible and therefore the observed thickness ( mag at , i.e. mag below the turnoff point) may be attributed to galactic contamination and observational errors only. A third and last hint on the quality of the data comes from the comparison of the SKICAT CMD with those derived by other authors who have performed similar work. The SKICAT CMD of M92 is deeper and looks better defined and thinner than those derived for other nearby globular clusters by Grillmair et al. (1995) or by Lehmann and Scholz (1997) who used UKST and Tautenburg plates scanned with APM.
As it was to be expected the SKICAT CMD looks noiser and less deep than that of M 55, measured by Zaggia et al. (1997) who made use of a mosaic of CCD frames taken at the 3.5m ESO-NTT. These authors, however, could cover only a quadrant of the cluster and push their data only out to 1.5 times its tidal radius without reaching the background. This undermines the detection of those tidal tails and diffuse extra-tidal stars which were first discovered, for other clusters, by Grillmair et al. (1995).
POSS-II data extracted by SKICAT allow to circumvent the present CCD field of view limitations and a systematic study of the outer haloes of all globular clusters present on the POSS-II plates is under progress.
References
- [1] Abell G., 1958, Astroph. J. Suppl. Ser. 3, 211
- [2] Djorgovski S., Lasker B., Weir N., Potsman M., Reid I. and Leidler W., 1992, Bul. Amer. Astr. Soc., 24, 750
- [3] Djorgovski S, de Carvalho R., Gal R. et al. 1997, IAU Symp. 179, in press, eds. B. McLeon et al. (Dortrech:Kluwer), (astro-ph/9612108)
- [4] Fayyad, U., Djorgovski, S., and Weir, N. 1997, AI magazine, in press
- [5] Grillmair C., Freeman K., Irwin M., Quinn P., 1995, Astron. J. 109, 2553
- [6] Jarvis J., Tyson J., 1979, SPIE Proc. on Instrum. in Astron. 172, 422
- [7] Kennefick J., de Carvalho R., Djorgovski S., Wilber M., Dickson E., Weir N., 1995, Astron. J. 110, 78
- [8] Kent S., 1985, PASP 97, 165
- [9] Lehmann I., and Scholz R.D., 1997, Astron. & Astroph., in pubblication
- [10] Reid I., Brewer R., Brucato W., et al. 1991, PASP 103, 661
- [11] Renzini A., Fusi Pecci F., 1988, Ann. Rev. Astron. & Astroph. 26, 199
- [12] Stetson, P., 1987, PASP, 99, 191
- [13] Thuan T., Gunn J., 1976, PASP 88, 543
- [14] Weir N., Fayyad U., Djorgovski S., Roden J., 1995a, PASP 107, 1243
- [15] Weir N., Djorgovski S., Fayyad U., 1995b, Astron. J. 110, 1
- [16] Zaggia S., Piotto G., Capaccioli M., 1997, Astron. & Astroph., submitted
- [17] Zwicky F. et al., 1961-1968, Catalogue of Galaxies and Cluster of Galaxies, (Pasadena:Caltech)