Abstract
We present the kinematics of the ionized gas over the inner 140′′ (10 kpc) from observations with the HIFI Fabry-Perot interferometer. There is clear evidence for density wave streaming and bar-driven streaming across the field, with bi-symmetric arms that penetrate to within 200 pc of the nucleus. CO maps show linear structures along (although slightly offset from) the bar consistent with a strong shock. Along the spiral arms which encircle the bar, the H ii regions lie downstream of the CO gas in the rest frame of the bar, as do the dust lanes, only if the gas outruns the stellar bar. As a first step towards understanding the details of the gas kinematics, and attempting to determine the mass inflow rate towards the nucleus, we build a mass model for the central disk constrained by near-infrared images. We plan to use this model as gravitational background potential for hydro-dynamical simulations of the gas response to the bar. Comparing these with the data presented should enable us to constrain various quantities such as pattern speed, stellar mass-to-light ratio, central mass concentration, and gas fueling rate.
1 Introduction
The luminous Seyfert 2 galaxy NGC 1068111 Unless otherwise stated, global quantities for NGC 1068 are taken from the Ringberg Standard [Bland-Hawthorn et al. (1997)]. lies at the forefront of attempts to unify the broader class of “active galaxies” within a single physical framework [Antonucci & Miller (1985)]. Thus, it is surprising that so little is known of the large-scale gas motions in this nearby galaxy and, in particular, their connection with the nuclear activity.
2 Gas Kinematics
2.1 H Observations
NGC 1068 was observed on the night of Dec. 8, 1985 using the Hawaii Imaging Fabry-Perot Interferometer (HIFI) at the CFH 3.6m telescope. The observations were made using an etalon with 85Å free spectral range and a reflective finesse of 60. NGC 1068 was observed through two 50Å FWHM blocking filters with central wavelengths 6615 and 6585 to cover H and the neighbouring lines of [N ii]6548,6583. Observations were also taken for the [N ii] lines over the period Dec. 5-7, 1985 but cirrus and variable weather conditions have compromised these data. The Fabry-Perot system is placed at the f/8 Cassegrain focus and has an output beam of f/2 after focal reduction. At the time of the observations, the best available imaging detector was the TI 3-phase CCD whose 15 pixels subtend 0.43′′ on the sky giving a field-of-view. The data have a velocity resolution of 65 km s-1 FWHM. The H and blue [N ii] lines were sampled at 40 km s-1, while the red [N ii] line was sampled more coarsely at 78 km s-1. The etalon produces a total velocity coverage of 4000 km s-1 free of order confusion although only half this range was observed. The spatial resolution of the data is 1′′ in regions of high signal-to-noise ratio (e.g. the starburst ring), and roughly 2′′ in the diffuse gas.
2.2 Large-Scale Structure
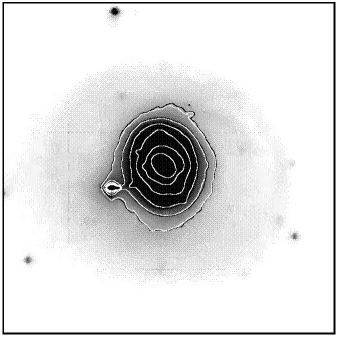
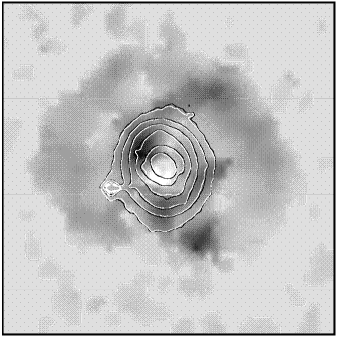
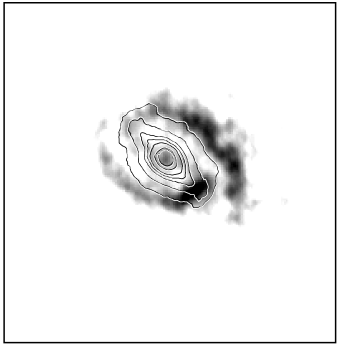
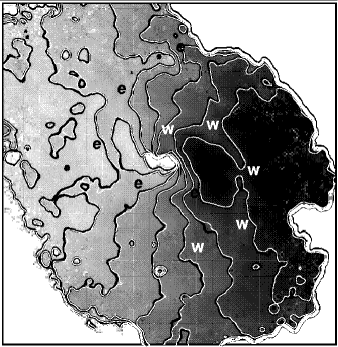
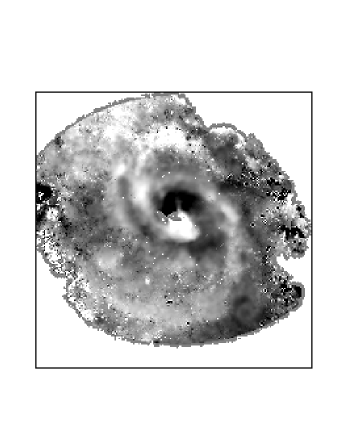
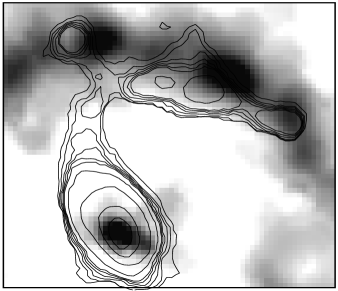
Deep optical and H i images of NGC 1068 (Fig. 1) show an outer shaped ring and a bright central disk with diameter 20 kpc oriented perpendicular to the outer ring. The innermost band contour has the same dimension as the stellar bar seen at (Fig. 2). In Fig. 3, we present the velocity field for the ionized gas over the inner disk. The velocity field is shown for a field of view of 100′′ and reveals a series of concentric “kinematic spiral arms” which appear superimposed on ordered, large-scale rotation. As shown in Fig. 5, the large-scale disk appears to undergo flat rotation beyond a radius of 1.5 kpc with a kinematic major axis that is consistent with the photometric position angle of the outer ring. Across the inner 40′′, the Z-symmetric velocity contours are the hallmark of highly radial orbits along a bar (e.g. Huntley 1978). Thus, the observed elliptic streaming is consistent with the presence of the stellar bar detected at near-infrared wavelengths [Scoville et al. (1988), Thronson et al. (1989)].
2.3 Observed Kinematics
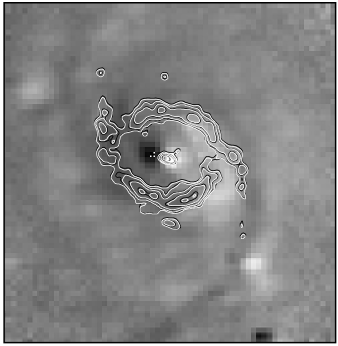
In Fig. 3, the velocity field of the ionized gas is derived from the weighted sum of the H and [N ii] kinematics. NGC 1068 has probably the most completely observed velocity field of any barred spiral galaxy due to a ‘diffuse ionized medium’ which pervades the inner disk [Bland-Hawthorn et al. (1991)]. The large-scale disk clearly undergoes ordered rotation. However, notice the bisymmetric streaming features to the east and west of the nucleus, which are particularly apparent in the residual velocity field (Fig. 3) after subtracting a rotating disk model. These are retarded with respect to the circular motion by 10 km s-1 on average reaching 30 km s-1 in places, which probably corresponds to 30 km s-1 up to 50 km s-1 in the plane of the galaxy. Additional kinematic spiral anomalies at larger radius are more diffuse. The characteristic Z-symmetry of an oval distortion (cf. Fig. 14 of Roberts et al., 1979) can be traced all the way into the nucleus from the southwest, where the southeastern spiral feature is less noticeable. To the north, the spiral feature exhibits continuity in velocity as it crosses the elliptic ring. The western kinematic feature has a counterpart in the H flux map (Fig. 4).
The H, H i (21 cm), and 12CO () rotation curves are presented in Fig. 5. There is good agreement between the CO [Helfer & Blitz (1995)] and the H kinematics although rather less agreement with the H i data (VLA observations supplied by H. Liszt). However, the H i data use a 15′′ beam and the data have yet to be corrected for beam smearing and absorption in the centre. The velocity field shows extensive evidence for strong density wave streaming on all scales. In the H data, there is a sharp transition region between 0′′ and 10′′ where the PA changes smoothly between 225∘ and 80∘ [Arribas et al. (1996)]. A similar effect is seen in the H i data between 70′′ and 100′′ where the PA changes smoothly from 91∘ to 106∘. For the H and CO ring fits, the adopted inclination was 40∘ although the orbit PA was a free parameter.
By subtracting the simple model of elliptic streaming overlayed on flat rotation, we have discovered bisymmetric spiral streamers in both the ionized line flux and kinematics that penetrate from 1 kpc to within 100 pc of the AGN. We find evidence for this effect in both the CO line flux and kinematics, albeit at lower spatial resolution [Kaneko et al. (1989)]. By implication, it is likely that the observed non-circular motions are confined to the galactic plane and arise from bar-driven density waves. In collaboration with Harvey Liszt (National Radio Astronomical Observatory), we find tentative evidence that, while the 21cm and CO kinematics are largely consistent, the H kinematics show substantial deviations from the cold phase at many positions within the inner disk away from the spiral streamers.

3 Mass Model
3.1 Why we need a Mass Model
Several studies of the gaseous response to rotating bar potentials can be found in the literature (e.g., Huntley et al., 1978; Athanassoula, 1992). One of the main results is the occurrence of shocks at characteristic positions. One of these is an often tightly wound, trailing, and bisymmetric spiral starting at both ends of the bar, exactly as observed for NGC 1068 (Fig. 2). Associated with the shock is dust and cool gas visible in CO emission as spiral arms in Fig. 2. Another place where shocks typically appear is along the bar usually somewhat offset from the major axis in the leading direction. For NCG 1068, Helfer & Blitz (1995) detected CO emission along the bar which indeed appears offset from the stellar bar’s major axis towards the leading edge (Fig. 2). Moreover, the models often have a central concentration of gas orbiting on near-circular, so-called x2-orbits, also evident in CO observations of NGC 1068. Thus, qualitatively, this fits nicely into the overall picture of the bar rotating prograde with respect to the disk.
However, theoretical studies also revealed a sensitive dependence of position and strength of the shocks to overall quantities such as pattern speed, bar strength, central mass concentration, and sound speed of the gas [Athanassoula (1992), Englmaier & Gerhard (1997)]. For a quantitative understanding of the gaseous morphology and kinematics in NGC 1068, a more detailed study is therefore highly desirable incorporating all information that is available on those quantities. In particular, the NIR light ought to be a good tracer of the underlying (stellar) mass distribution.
3.2 Creating a Mass Model
Using NIR light as mass tracer to construct the gravitational potential for barred galaxies is by now a common technique (e.g., Quillen et al., 1994). A little complication, which arises in the case of NGC 1068, is the presence of a central point source due to dust heated by the central AGN and emitting in the NIR. Here, we used three -band images, (a) a very high-resolution (02 FWHM) image of the centre, (b) a high-resolution image (04 FWHM) of the stellar bar, and (c) a low resolution image (2′′ FWHM) of the whole disk. The latter of these was supplied by H. Thronson [Thronson et al. (1989)], while images a and b where obtained with SHARP at the NTT (3.5m) using short exposures (0.1 and 0.5 seconds, respectively) in conjunction with a shift-and-add technique [Quirrenbach et al. (1997)].
A scaled PSF (an image of a star obtained under the same conditions) accounting for the point source was subtracted from image a, of which subsequently the azimuthally averaged luminosity profile was evaluated. To correct image b for the central point source, it was first split into non-axisymmetric and axisymmetric (azimuthally averaged) parts; second, inside 28 the latter was replaced by the profile obtained from image a; and finally, these were added back to the non-axisymmetric part. This procedure gave a high-resolution map of the stellar NIR emission inside 30′′. Finally, the map was extended with image c (though with lower resolution) to corresponding to .

From this map a mass model was derived as follows: (i) a spherical model for the central (apparently round) bulge was subtracted; (ii) the remaining disk was de-inclined assuming PA=106∘ and =40∘ [Bland-Hawthorn et al. (1997)]; (iii) the resulting surface density was vertically thickened by the profile with =200 pc; and (iv) the spherical model for the central bulge was added back. Similarly, dark mass components such as a central black hole222 Presumably, in studies of the gas kinematics, a central point mass can hardly be distinguished from a very dense star cluster. However, the latter possibility might be ruled out by physical arguments (e.g. lifetime of such a cluster). Additional constraints on the central potential are given by maser kinematics [Greenhill et al. (1996)], though their interpretation is not straightforward. and a halo may be added. The scale height of 200 pc is in agreement with a ratio of between scale height and length typical for disk galaxies in the infrared [Wainscoat et al. (1989), Barnaby & Thronson (1992)].
Clearly, many parameters entering the above procedure are a priori not very well determined, e.g., the scale height and black hole mass. In particular, the dominance of the hot dust in the centre causes considerable uncertainty in the central stellar light distribution. Here we have used a -model [Dehnen (1993)] for the bulge component, the volume density of which,
| (1) |
is proportional to for much smaller than the scale radius and falls off as at large radii. Our parameters, and , are not well constrained by the band photometry. For the future, we plan to improve on this point by taking into account also the and band which are less sensitive to emission from the hot dust in the centre. These data, in combination with the image, may also be used to correct for dust absorption along the bar, which can be a problem particularly near the shocks.
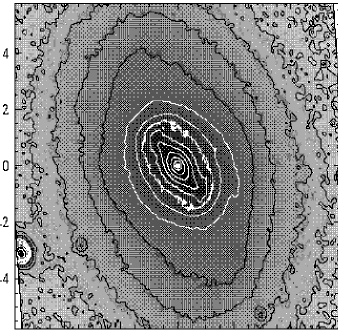
The volume density in the plane of the galaxy resulting from this procdure is shown in Fig. 6. As can be seen from the spacing of the contours, the scale length of the central bar is significantly smaller than that of the outer oval.
For gas kinematics and hydro-dynamical simulations, only the potential (and forces) in the plane are of interest. For the disk this has been evaluated from the expansion of the density in azimuthal harmonics up to order . The gravitational potential of the bulge model is given by
| (2) |
Fig. 6 shows isocontours of the potential due to disk and bulge.
In the future we plan to numerically evaluate the gaseous response to the mass model and compare the resulting gas distribution and kinematics with those observed (cf. the previous sections). Whether or not these data allow us to pin down all the unknown quantities (e.g., the central mass concentration) remains to be seen. However, the simulations published in the literature suggest that gas observation do – and thus must be used in order to – constrain these quantities.
4 Conclusions
In the context of standard spiral density waves, the expected large-scale shocks lead to a phase shift between the gas response and driving stellar bar. The resulting mass inflow may dominate standard viscous accretion. On much smaller scales, it is unlikely that such shocks can be sustained. Therefore, the shock mechanism is likely to be important at intermediate scales (0.1 to a few kpc). The mass inflow rate can then be computed in terms of the gas properties, the underlying mass distribution, and the pattern speed. In future we shall attempt a self-consistent fit to these parameters, particularly the shock strength, which will require gas dynamic modeling. Ultimately, we would like to address the implications of these observations for fueling nuclear activity. A mass model is a precursor to running a full hydro-dynamical simulation.
Acknowledgements.
We thank H. Liszt for allowing us to present unpublished VLA observations of the H i distribution, and B. García-Lorenzo who supplied the stellar velocities for Fig. 5. We would also like to thank H. Thronson for the large-scale band image.References
- Antonucci & Miller (1985) Antonucci R.R.J. & Miller J.S. 1985, ApJ, 297, 621
- Arribas et al. (1996) Arribas S., Mediavilla E. & García-Lorenzo B., 1996, ApJ, 463, 509
- Athanassoula (1992) Athanassoula E., 1992, MNRAS, 259, 345
- Barnaby & Thronson (1992) Barnaby D. & Thronson M.A., 1992, AJ, 103, 41
- Bland-Hawthorn et al. (1991) Bland-Hawthorn J., Sokolowski J. & Cecil G. 1991, ApJ, 375, 78
- Bland-Hawthorn et al. (1997) Bland-Hawthorn J., Gallimore J.F., Tacconi L.J., Brinks E., Baum S.A., Antonucci R.R.J. & Cecil G.N., 1997, this volume
- Dehnen (1993) Dehnen W., 1993, MNRAS, 265, 250
- Englmaier & Gerhard (1997) Englmaier P. & Gerhard O.E., 1997, MNRAS, 287, 57
- Friedli (1996) Friedli D., 1996, A&A, 312, 761
- García-Lorenzo et al. (1997) García-Lorenzo B. et al., 1997, this volume
- Greenhill et al. (1996) Greenhill L.J., Gwinn C.R., Antonucci R. & Barvainis R., 1996, ApJ, 472, L21; see also this volume
- Helfer & Blitz (1995) Helfer T.T. & Blitz L., 1995, ApJ, 450, 90
- Huntley (1978) Huntley J.M., 1978, ApJ, 225, L101
- Huntley et al. (1978) Huntley J.M., Sanders R.H. & Roberts W.W., 1978, ApJ, 221, 521
- Ichikawa et al. (1987) Ichikawa S-I., Okamura S., Kaneko N., Nishimura M. & Toyama K., 1987, PASJ, 39, 411
- Kaneko et al. (1989) Kaneko N. et al. 1989, ApJ, 337, 691
- Planesas et al. (1991) Planesas P., Scoville N. & Myers S.T., 1991, ApJ, 369, 364
- Quillen et al. (1994) Quillen A.C., Frogel J.A. & Gonzales R.A., 1994, ApJ, 437, 162
- Quirrenbach et al. (1997) Quirrenbach A. et al., 1997, this volume
- Roberts et al. (1979) Roberts W.W., Huntley J.M., & van Albada G.D., 1979, ApJ, 233, 67
- Sandage (1961) Sandage A., 1961, Hubble Atlas of Galaxies, Carnegie Institute of Washington
- Scoville et al. (1988) Scoville N.Z., Matthews K., Carico D.P. & Sanders D.B., 1988, ApJ, 327, L61
- Thronson et al. (1989) Thronson H.A. et al., 1989, ApJ, 343, 158
- Wainscoat et al. (1989) Wainscoat R.J., Freeman K.C. & Hyland A.R., 1989, ApJ, 337, 163