RXTE Observations of GRS 1915+105
Abstract
We report on extensive X-ray observations of the galactic superluminal motion source GRS 1915+105 with the RXTE satellite over the last year. More than 130 RXTE pointings have been performed on roughly a weekly basis.
GRS 1915+105 displays drastic X-ray intensity variations on a variety of time scales ranging from sub-seconds to days. In general, the intensity changes are accompanied by spectral changes on the same timescale. Three types of bursts with typical durations between 10–100 sec have been identified which have drastically different spectral properties and seem to occur in a fixed sequence. One of the most intense bursts has a bolometric X-ray luminosity of 51039 erg/s during the 25 sec maximum-intensity part.
Introduction
GRS 1915+105 was discovered on 1992 August 15 with the WATCH detectors on Granat (Castro-Tirado et al. 1992). A comparison of the BATSE ( keV) flux with that of ROSAT (1–2.4 keV) fluxes obtained during regularly performed pointings has shown that GRS 1915+105 has been active all the time, even during times of BATSE non-detections (Greiner et al. 1997). A variable radio source was found with the VLA (Mirabel et al. 1993a) inside the 10′′ X-ray error circle (Greiner 1993), which later was discovered to exhibit radio structures travelling at apparently superluminal speed (Mirabel & Rodriguez 1994) making GRS 1915+105 the first superluminal source in the Galaxy. Until then, apparent superluminal motion was only observed in AGN, the central engines of which are generally believed to be massive black holes. This similarity suggests that GRS 1915+105 harbors a stellar-sized black hole.
The X-ray spectrum as seen with ROSAT (Greiner 1993) and ASCA (Nagase et al. 1994) is strongly absorbed (N cm-2) consistent with the location in the galactic plane at 12.5 kpc distance (Mirabel & Rodriguez 1994).
Pointed RXTE Observations
The first two RXTE observations were performed on April 6 and 9, 1996. The surprising results of these observations and those of the daily RXTE ASM dwells triggered an unique sequence of RXTE pointings on GRS 1915+105 on a roughly weekly time scale. These data are publicly available and a number of papers have already appeared dealing with various aspects of the extremely rich variety of X-ray properties of GRS 1915+105: (Greiner, Morgan and Remillard 1996; Chen, Swank and Taam 1997; Belloni et al. 1997; Morgan, Remillard and Greiner 1997; Taam, Chen and Swank 1997).
Temporal characteristics
The X-ray light curves reveal a variety of features, one of which is large amplitude intensity variations. We identify the following properties in the light curves of GRS 1915+105:
-
•
In 15 of the pointed PCA observations, we find large, eclipse-like dips in the X-ray flux, which we call sputters. During these sputters the flux drops from 2–3 Crab to a momentary lull at about 100–500 mCrab and then shoots up again. The spectrum softens dramatically during the sputters, thus arguing against absorption effects.
-
•
On some occasions we see extremely large amplitude oscillations with an amplitude of nearly 3 Crab and periods of 30–100s.
-
•
Between the episodes of large-amplitude variations the X-ray flux variations are more regular, developing into clearly visible quasi-periodic oscillations which seem to be stable over several days.
-
•
The combination of the intense QPOs and the high throughput of the PCA enabled phase tracking of individual oscillations: the QPO arrival phase (relative to the mean frequency) exhibits a random walk with no correlation between the amplitude and the time between subsequent events. Furthermore, the mean ‘QPO-folded’ profiles are roughly sinusoidal with increased amplitude at higher energy, and with a distinct phase lag of 0.03 between 3 and 15 keV.
Spectral characteristics
We have started a comprehensive spectral investigation using PCA as well as HEXTE data of well-defined time stretches which are selected according to their different shapes in the lightcurve. While the work is still in progress we note the following, more general properties:
-
•
The spectra are complex and rapidly variable. Single component spectra like pure power law, bremsstrahlung, synchrotron or comptonisation models do not fit these spectra. In general, the spectra are composed of at least two components: one soft component extending up to about 15–20 keV, and a flat, hard component extending up to 200 keV which is well represented by a power law of photon index 2.5–3.5. The hardness ratios demonstrate that the spectrum varies on timescales of seconds!
-
•
The soft component can be well described by either an exponentially cut-off power law, a bremsstrahlung model, or disk blackbody models. Given typical X-ray luminosities during most of the April to November 1996 activity state of 1039 erg/s, and an upper limit for the size of the emission region defined by the observed spectral changes on timescales of seconds, the bremsstrahlung model is physically excluded (emissivity is too low). We therefore use a multicolor disk blackbody spectrum (DISK in XSPEC).
-
•
The spectrum of the X-ray emission during the lulls is softer than during the high-intensity states, i.e. these lulls are not caused by absorption or any low-energy cut-off. We have selected photons (for individual layers and single PCA units) at different time intervals corresponding to these two intensity states. The gross energy distribution of the high-intensity emission can be described by a disk blackbody temperature of 1.9 keV and a power law with photon index . The spectrum during the lulls is well represented by a disk blackbody with a temperature of 1.1 keV plus a power law of photon index .
-
•
As can be inferred from the hardness ratios, there are no major spectral changes during the decay phase between lulls before the onset of the large-amplitude oscillations. But during these oscillations the temperature oscillates on the same time scale as the intensity. The power law model has a photon index of –2.6, and nothing can be said on rapid variability of this component due to low statistics on these 1–2 sec timescales.
-
•
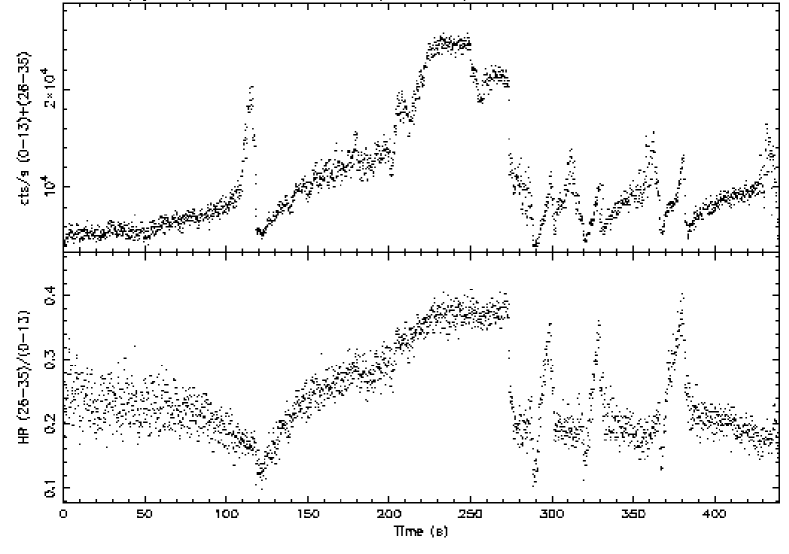
We identify three burst-like events with completely different spectral behaviour (see Fig. 1). First, bursts with a typical disk temperature of 1.1 keV and little changes along the burst (though a slight, smooth softening seems possible; see Fig. 1 at t=110–120 sec). However, at the end of these type 1 bursts the spectrum changes abruptly and starts hardening. Second, bursts with generally longer timescale and larger amplitude (see lower panel of Fig. 1 at t=150–280). They show a smooth hardening despite more erratic intensity variations on top of the general flare profile. Third, bursts with a temperature variation proportional to the intensity (see lower panel of Fig. 1 at t=290–300, 325–335 or 370–380 sec) and a maximum temperature of 2 keV (three bursts). In general, we find the following sequence: one type 1 burst preceding a major flare (type 2 burst), followed by a series of alternating type 1 and type 3 bursts. We have identified at least 6 such sequences during the October 13–25, 1996 period. It is interesting to note that the type 1 bursts are similar to those occuring during or at the end of prolonged lulls like those of May 26, 1996 (see Fig. 4 of Greiner et al. 1996) and April 6 (ibid. Fig. 3) or Oct. 7, 1996 (Fig. 1 of Belloni et al. 1997).
-
•
The major flare (type 2 burst) on October 13, 1996 (Fig. 1) is the most intense emission we have detected from GRS 1915+105 so far. The nearly flat-top main peak has a duration of nearly 30 sec., and integrating over the 2 keV disk blackbody plus the –2.6 power law up to 100 keV results in an unabsorbed luminosity (at the adopted distance of 12.5 kpc) of 51039 erg/s.
Discussion
The lack of coherent pulsations, the strong variability during the high-intensity states on time scales well below one second and the impossibility of a bremsstrahlung interpretation indicate that the emission originates in an accretion disk.
The drastic intensity variations were interpreted as an inherent accretion instability, rather than absorption effects, since there was spectral softening during these dips. The repetitive, sharp variations and their hierarchy of time scales are entirely unrelated to the phenomenology of absorption dips (Greiner et al. 1996). The nature of these astonishing X-ray instabilities is currently a mystery though attempts have been made to both interprete these as accretion disk instabilities leading to an infall of parts of the inner accretion disk (Greiner et al. 1996, Belloni et al. 1997) and relate them to radio flares (Greiner et al. 1996, Pooley & Fender 1997).
At photon energies above 10 keV, the high amplitudes and sharp profiles of the QPOs are inconsistent with any scenario in which the phase delay is caused by scattering effects. Alternatively, it appears that the origin of the hard X-ray spectrum itself (i.e. the creation of energetic electrons in the inverse Compton model) is functioning in a quasiperiodic manner. These results fundamentally link X-ray QPOs with the most luminous component of the X-ray spectrum in GRS 1915+105.
Taam et al. (1997) have investigated PCA data of October 15, 1996 and found that type 1 and type 3 bursts always occur together. Our finding confirms this behaviour with the addition that such sequences are always preceded by one pair of type 1 and 2 burst.
The maximum (during a flare on Oct. 13, 1996) unabsorbed X-ray luminosity is 51039 erg/s. This is well above the Eddington luminosity for a neutron star with any reasonable mass, suggesting that the system contains a black hole. Assuming that the emission is near (but slightly below) the Eddington luminosity, the inferred mass (35 ) is compatible with that derived from the stable 67 Hz QPO (Morgan et al. 1997).
Acknowledgements: JG is supported by the German Bundesministerium für Bildung, Wissenschaft und Forschung (BMBW/DARA) under contract Nos. 50 QQ 9602 3 and is grateful to DFG for a substantial travel grant (KON 1088/1997 and GR 1350/6-1).
References
- (1) Belloni T., Mendez M., King A.R., van der Klis M., van Paradijs J., 1997, ApJ 479, L145
- (2) Castro-Tirado A.J., Brandt S., Lund N., 1992, IAU Circ. 5590
- (3) Chen X., Swank J.H., Taam R.E., 1997, ApJ 477, L41
- (4) Greiner J., 1993, IAU Circ. 5786
- (5) Greiner J., Morgan E.H., Remillard R.A., 1996, ApJ 473, L107
- (6) Greiner J., Harmon, B.A., Paciesas W.S., Morgan E.H., Remillard R.A., 1997, in Accretion Phenomena and Associated Outflows, Proc. of IAU Coll. 163, Port Douglas, July 1996, PASA (in press)
- (7) Mirabel I.F., Rodriguez L.F., Marti J., Teyssier R., Paul J., Auriere M., 1993a, IAU Circ. 5773
- (8) Mirabel I.F., Rodriguez L.F., 1994, Nat. 371, 46
- (9) Morgan E.H., Remillard R.A., Greiner J., 1997, ApJ (in press)
- (10) Nagase F., Inoue H., Kotani T, Ueda Y., 1994, IAUC 6094
- (11) Pooley G.G., Fender R.P., 1997, MNRAS (subm.)
- (12) Taam R., Chen X., Swank J., 1997, ApJ (in press)