Constraining the Abundances and Ages of Early-type Galaxies
Abstract
We consider the extent to which broadband mid-UV (2000 - 3000 Å) colors can give superior constraints on the ages and abundances of old stellar populations than can their optical counterparts. The ultraviolet colors directly measure the turnoff component of old populations. They vary much more strongly with and and give much tighter constraints for a given degree of observational precision than do optical-band indices. We present an analysis of the permitted range of () arising from observational uncertainties in observations of early-type galaxies.
Introduction
Am important problem in the study of stellar populations is that of deriving ages and abundances for early-type galaxies. These are the most massive galaxies in the universe and thought to be amongst the oldest. In principle, therefore, their study offers one of the best probes of the early star formation history and chemical evolution of the universe.
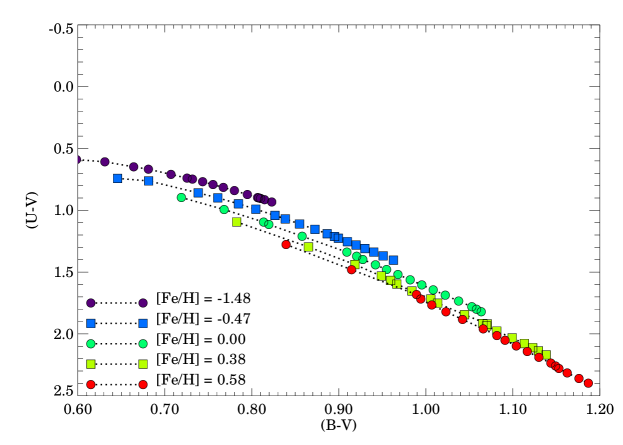
In this study, a progress report on our continuing exploration (see dro93 ; dor95 ) of old stellar populations at ultraviolet wavelengths, we investigate the usefulness of mid-UV/optical broadband colors. A well-known problem in population synthesis is the “age-metallicity degeneracy,” (oc86 ; worthey94 and references therein) by which populations of different age and abundance can have nearly indistinguishable light measures (viz. colors, absorption line strengths). Broadband optical colors are particularly susceptible to this problem. Figure (1) shows that observed integrated colors of, for example, are consistent with a wide range of both ages and metallicities for typical observational uncertainties.
However, broadband colors have several important advantages over narrower band measures, in particular
-
•
Since they are influenced mainly by regions of low atmospheric optical depth, they are easier to model theoretically than are individual features — which are often subject to poorly modeled effects;
-
•
It is easier to achieve high S/N ratios in broader indices;
-
•
They are not strongly affected by factors such as velocity dispersion or emission features.
In the absence of young stellar components and the hot component that gives rise to the ‘UV-upturn’ or ‘UVX’ phenomenon dor95 ; b3fl , the mid-UV flux is dominated by the light of main sequence turnoff stars. The turnoff light is much more sensitive to age than is the light of red-giant stars, which dominate at optical and IR wavelengths. The UV is also more sensitive to stellar temperature and line blanketing than are longer wavelengths. Hence, we expect indicators derived from the mid-UV to be considerably better probes of population characteristics. We show that this is true for mid-UV broad-band colors, and we then address the question of how much photometric precision is necessary to draw conclusions from these such measurements.
Mid-UV/Optical Colors
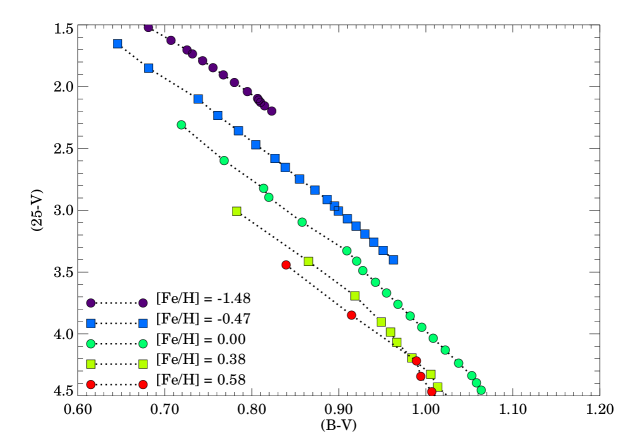
We have used the HST/WFPC2 filters F218W, F255W, and F300W to exemplify the behavior of broadband mid-UV indices. These filters have central wavelengths and effective widths defined in WFPC2 as follows F218W – F255W – F300W (the “wide U” used in the Hubble Deep Field exposures) The potential utility of mid-UV broadband colors is illustrated by Figure 2. The two-color separation between model sequences at different is seen to be much greater in than in In particular, the model pair (6 Gyr, 3) and (16 Gyr, ), cited by Worthey worthey94 as indistinguishable at optical wavelengths, is well separated in the UV/optical colors (a full difference spectrum is shown in dor97b ). Some ranges of metallicity, or significant minority fractions thereof, are excluded altogether by existing broadband observations of E galaxies. For example, for the galaxies presented in Table 1 of dor95 , this excludes most of the models with [Fe/H] . An even greater separation between models is present in the two-color plane.
However, note that the model sequences for constant age or constant still overlap in color—implying that the “degeneracy” problem is still present, if less serious than in the optical. In addition, UV fluxes cannot yet be measured with the same precision as optical fluxes due to remaining calibration problems and the faintness of galaxies in the UV.
The Degeneracy Problem
In this section we formulate a criterion for the distinguishability of stellar population parameters from a given set of observations. Let be some measure of a galaxy spectral energy distribution (SED) such as a color or absorption line index. Suppose the light-weighted mean age and abundance of its population are and The range of models that produce a value of within a given observational uncertainty, , is the set of where
| (1) |
For a set of indices the range of models consistent with the observation is the error ellipse in the plane defined by the r.m.s. differences in colors between theory and observation is determined by
| (2) |
Using the partial derivatives of with respect to and we obtain an expression for in terms of the relative sensitivity of the colors to these parameters:
| (3) |
where the derivatives are both positive in the age range of interest (colors become redder with both and 111This is not always true of absorption indices, which may peak at a given owing to line saturation. In this case equation (3) must be modified to include higher-order derivative terms.). Worthey worthey94 has defined “metallicity sensitivity” indices in terms of the ratios (i.e. relative sizes) of the partial derivatives in this expression. However, it is important to note from equations (1) and (3) that separation also depends on the absolute size of the partial derivatives and on the available observational precision (which determines the size of the error ellipse).
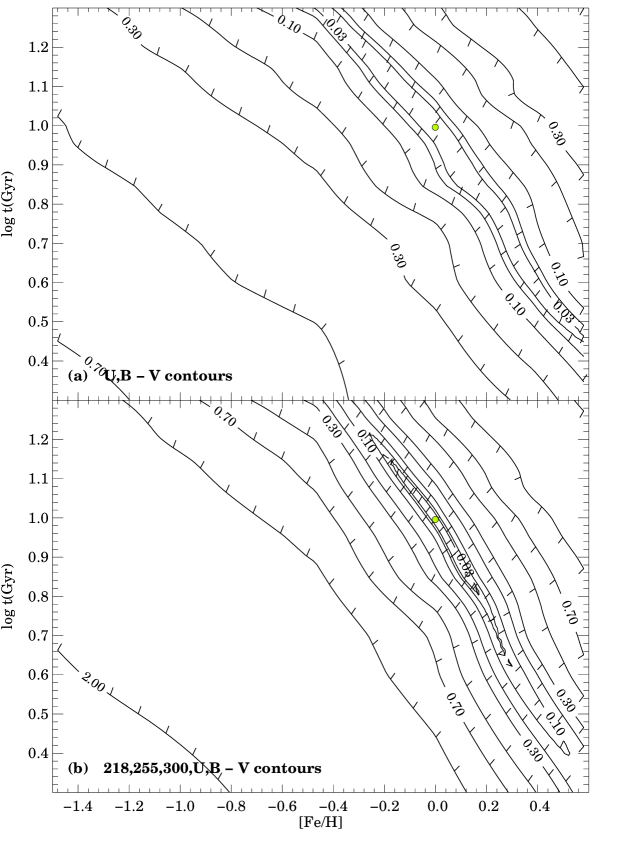
Figure 3 shows the error ellipse contours of as defined in equation (2). To construct this plot, we have selected a model (10 Gyr, [Fe/H] = 0, indicated by the filled circle) and determined its rms separation from other models in various colors222Note that this analysis addresses a different question than the uncertainty analysis recently provided by cwb96 , who addressed instead the systematic uncertainties inherent in the models themselves (i.e., how the contours in these diagrams would change with different authors). Needless to say, both contribute to the uncertainty of the results from population synthesis.. In panel (a) the contours are derived using only while panel (b) is constructed using mid-UV/optical colors in addition.
Even for the highest precision plotted, there is a “valley of degeneracy” running diagonally across both figures wherein separation is impossible. This is the “3/2” band discussed by Worthey worthey94 . It is much broader in the optical than in the UV bands. The innermost contour plotted in both panels is 0.03 mag, a precision that can be routinely achieved for nearby galaxies in the optical but not currently in the UV. However, note that for optical bands, as stressed by Worthey and his collaborators, the degree of observational precision required to separate models is much better than 0.03 mag. The UV colors yield better separation for than do the optical colors at .
Discussion
The age-abundance degeneracy problem is difficult and persists at some level in all wavelength regimes which have been studied. In the case of the mid-UV colors we discussed here, degeneracy is much smaller at a given level of observational precision than at optical wavelengths. If there is independent information on abundance, constraints on age from mid-UV colors are strong (see Fig. 3).
It is clear from this discussion that the usefulness of various spectral indices must be judged in terms of both their sensitivities (i.e. partial derivatives) to the basic parameters and the likely observational precision possible in practical applications. We doubt that robust separation is possible for old stellar populations without excellent observational precision in multiple spectral indices or colors over a long wavelength baseline (including the mid-UV) oc96 . It is also essential to evaluate the systematic errors introduced by modeling uncertainties cwb96 . We will discuss these issues further in our forthcoming paper dor97a .
This work has been partially supported by grants NASA grants NAG5-700 and NAGW-4106.
References
- (1) Dorman, B., Rood, R. T. & O’Connell, R. W. 1993, ApJ 419, 596
- (2) Dorman, B., O’Connell, R.W. and Rood, R.T., 1995 ApJ 442, 105
- (3) O’Connell, R. W. 1986, in Stellar Populations, eds. C. Norman, A. Renzini, and M. Tosi (Cambridge: Cambridge University Press), 167
- (4) Worthey, G. S. 1994,ApJS 95, 107
- (5) Kurucz, R. L. 1992, Rev. Mex. Astr. Ap., 23, 45
- (6) Dorman, B., O’Connell, R.W. and Rood, R.T., 1997, in preparation
- (7) Burstein, D., Bertola, F., Buson, L.M., Faber, S.M. and Lauer, T.R., 1988 ApJ 328, 440
- (8) The WFPC2 Instrument Handbook ed. J. Biretta (Baltimore:STSci) and http://www.stsci.edu/ftp/instrument_news/WFPC2/Wfpc2_hand/wfpc2_handbook.html
- (9) Worthey, G. S., Dorman, B., & Jones, L. A. 1996, AJ, 112, 948
- (10) Dorman, B. in The Nature of Elliptical Galaxies eds. M. Arnobaldi, G. S. Da Costa, & P. Saha (San Francisco:ASP), 195
- (11) Charlot, S., Worthey, G. S., & Bressan, A. 1996, ApJ 457, 625
- (12) O’Connell, R. W. in From Stars to Galaxies: The Impact of Stellar Physics on Galaxy Evolution eds. C. Leitherer, U. Fritze-von Alvensleben, & J. P. Huchra (San Francisco:ASP), 3