Supernova 1994aj: a probe for pre-supernova evolution and mass loss from the progenitor. ††thanks: Based on observations collected at ESO-La Silla (Chile)
Abstract
Extensive photometric and spectroscopic observations of SN 1994aj until 540d after maximum light have been obtained. The photometry around maximum suggests that the SN belongs to the Type II Linear class, with a peak absolute magnitude of (assuming ). The spectra of SN 1994aj were unusual with the presence of a narrow line with a P-Cygni profile on the top of the broad Balmer line emission. This narrow feature is attributed to the presence of a dense superwind surrounding the SN. At 100-120 days after maximum light the SN ejecta starts to interact with this CSM. The SN luminosity decline rates slowed down ( mag (100d)-1), becoming less steep than the average late luminosity decline of normal SNII ( mag (100d)-1). This dense ( g/cm) wind was confined to a short distance from the progenitor ( cm), and results from a very strong mass loss episode (), which terminated shortly before explosion ( yr).
keywords:
Supernovae and Supernova Remnants: general – Supernovae and Supernova Remnants: 1994aj1 Introduction
The massive progenitors of SN II experience, during their life times,
strong mass loss. In different phases of its evolution an star, a typical range for the initial mass of a SN II
progenitor, may eject several solar masses of material with different
velocities and mass loss rates. Therefore in the neighbourhood of Type II
SNe dense circumstellar material (CSM) may be expected to be distributed
according to the detailed mass loss history of the progenitor.
In many cases there is not observational evidence of this material,
whereas in others this material determines its observed photometric and
spectroscopic properties [1997].
In particular a subclass of SN II has been identified showing narrow emission lines in the spectrum (e.g. SN 1988Z; Turatto et al., 1993, 1997), and therefore called IIn [1990]. Probably, these are normal type II explosions occurring in a dense CSM which is confined very close to the SN so that the ejecta-CSM interaction began shortly after explosion [1994].
In addition, a number of SN II, SN 1970G (Fesen 1993), 1979C (Fesen &
Matonick 1993), 1980K (Leibundgut 1991, Fesen & Matonick 1994)
and 1986E (Cappellaro et al. 1995a), all of the Linear subclass, have
been recovered a few years after explosion at a luminosity greatly
exceeding that expected from the normal radioactive decay and again
explained by enhanced ejecta-CSM interaction beginning 1-2 years after
explosion.
An outstanding and so far unique case was that of SN 1984E whose
spectral features showed an unusual profile with a narrow P-Cygni
component on top of the usual broad feature. The narrow feature was
attributed to a superwind with a velocity of
km sec-1
[1984]. Unfortunately only a couple of spectra near maximum were
obtained for this SN.
Here we present and discuss the case of SN 1994aj which shows at early phases the double P-Cygni line profile similar to SN 1984E, and at late phases the enhanced H luminosity similar to other SN IIL.
2 Observations
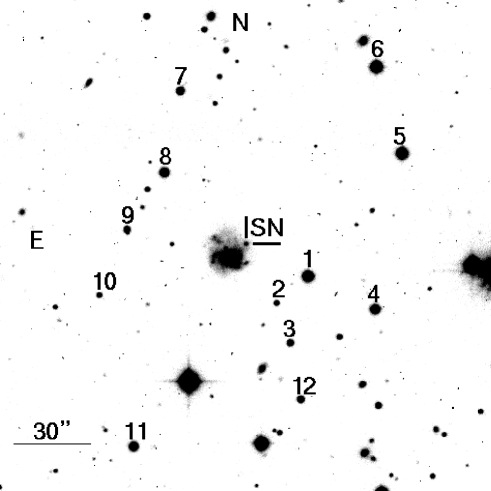
The SN 1994aj was found by Pollas [1994] on two films obtained on Dec. 12.16 and 13.14 UT respectively in a late type ( Sc) anonymous galaxy, at R.A. = 9h03m46s.12, Decl. = -10o27’56”.2 (equinox 1950.0). The SN was located 5”. 2W, 5”. 1N of the galaxy nucleus, superimposed on an external spiral arm (Fig. 1). The first spectrum, obtained several days after discovery [1994], indicated that the SN was of type II because of the presence of hydrogen Balmer lines which showed an unusual double peak profile. As with SN 1984E a narrow P-Cyg profile appeared to be superimposed on a much broader component.
This prompted an intense observational effort which, despite the relative faintness of the SN, about 18 mag at maximum, allowed photometric and spectroscopic monitoring for over 1 year.
2.1 Photometry
V and R-band photometry of SN 1994aj were obtained at ESO-La Silla on 22 nights using five different telescopes. Photometric nights were used to calibrate, through observations of photometric standard stars [1992], a sequence of stars around the SN. In turn, the local sequence was used to calibrate the observations obtained during non-photometric nights. The magnitudes of the local standards, labeled in Fig. 1, are reported in Tab. 1.
| star | V | R |
|---|---|---|
| 1 | ||
| 2 | ||
| 3 | ||
| 4 | ||
| 5 | ||
| 6 | ||
| 7 | ||
| 8 | ||
| 9 | ||
| 10 | ||
| 11 | ||
| 12 |
The SN magnitudes have been measured by point spread function fitting using the Romafot package in MIDAS. This technique, allowing a good subtraction of the background gives reliable results even when the SN fades. The resulting magnitudes with the estimate of the internal errors are reported in Tab. 2.
| date | J.D. | V | R | instr. |
|---|---|---|---|---|
| 2400000+ | ||||
| 31/12/94 | 49717.7 | 2.2 | ||
| 3/1/95 | 49720.8 | 3.6 | ||
| 8/1/95 | 49725.7 | 3.6 | ||
| 10/1/95 | 49727.7 | NTT+S | ||
| 13/1/95 | 49730.8 | NTT+S | ||
| 15/1/95 | 49732.8 | NTT+E | ||
| 16/1/95 | 49733.8 | NTT+E | ||
| 28/1/95 | 49745.7 | Dutch | ||
| 30/1/95 | 49747.7 | NTT+E | ||
| 4/2/95 | 49752.7 | 2.2 | ||
| 20/2/95 | 49768.7 | D1.54 | ||
| 28/2/95 | 49776.6 | NTT+E | ||
| 2/3/95 | 49779.6 | NTT+E | ||
| 6/3/95 | 49782.6 | Dutch | ||
| 29/3/95 | 49805.5 | 3.6 | ||
| 20/4/95 | 49827.6 | Danish | ||
| 29/4/95 | 49837.5 | 3.6 | ||
| 29/5/95∗ | 49866.5 | NTT+E | ||
| 14/11/95 | 50035.3 | NTT+E | ||
| 17/03/96 | 50159.6 | 3.6 | ||
| 10/05/96 | 50214.5 | NTT+E | ||
| 11/05/96 | 50215.5 | NTT+E |
for this epoch is available also an estimate
2.2 = ESO/MPI 2.2m telescope + EFOSC2
3.6 = ESO 3.6m telescope + EFOSC1
NTT+S = ESO NTT + SUSI
NTT+E = ESO NTT + EMMI
Dutch = Dutch 0.90m + CCD Camera
Danish = ESO/Danish 1.5m telescope + CCD camera
The V and R light curves of SN 1994aj are shown in Fig. 2, including the discovery estimate by Pollas [1994] and the measurement of Suntzeff [1994].
Patat et al. [1994] have shown that SNII can be separated on the basis of the parameter , which quantifies the luminosity decline rate in the first 100 days after maximum light. For SN 1994aj we measure mag (100d)-1 which is typical of the Linear subclass, very similar for instance to SNe 1980K and 1990K. The fit of the light curves of SN 1994aj to the template light curve of SNIIL is shown. The best fit is obtained if we accept that the maximum occurred weeks prior to discovery with an uncertainty of week and hereafter we will assume (Nov 19, 1994) as reference epoch. Note that this is a conservative choice adopted to reduce the variance of SN 1994aj photometry compared with that of other SNII. With this choice we can estimate that the SN reached a maximum magnitude . However, we are aware that the above values are subject to considerable uncertainty, since the maximum was not observed and Type II SNe sometimes show odd photometric behavior.

After 100-120 days the luminosity decline, both in V and R, suddenly slowed down: in particular the R light curve from 100 to 535d appears, considering the photometric error, remarkably linear with mag (100d)-1.
Qualitatively, this linear decline is reminiscent of “normal” SN IIL where, however, the late luminosity decline is significantly steeper, being on the average mag (100d)-1 [1990]. This last value is in good agreement with the expectation of the models predicting that, at this phase, the optical light curve is powered by the thermalization of the -rays and positrons from the radioactive decay of 56Co into 56Fe. If a fraction of the -rays escapes from the ejecta without being thermalized the luminosity decline rate may be steeper than the decay rate (this is thought to occur in SN Ia). Instead, the case of SN 1994aj, where the observed decline rate is slower than the radioactive decay input, is one which requires some additional energy input. In the following we will argue that this probably results from the interaction of the ejecta with a dense CSM.
Apart from the moderate galactic reddening, according to Burstein & Heiles [1978], there is no evidence of additional extinction to SN 1994aj. The SN is projected on an external spiral arm, close to a very faint HII region, whose narrow emission lines are seen in the long slit spectra (see next section). The heliocentric radial velocity at the SN location was obtained by averaging the measurements of the narrow H of different spectra. The result, , has been adopted throughout the present work. After correction for the solar motion relative to the background radiation (, RC3) and assuming , we obtain for the distance modulus of the parent galaxy.
With the above assumptions for extinction and distance, we obtain for the SN absolute magnitude at maximum which, assuming that the color index at maximum is close to 0, is intermediate between the values for “regular” and “bright” SNII Linear (respectively and [1994].
2.2 Spectroscopy
The journal of the spectroscopic observations reported in Tab. 3 gives for each spectrum the date (col.1), the phase (relative to the adopted maximum, cfr. Sect. 2.1) (col.2), the equipment used (col.3), the exposure time (col.4), the wavelength range (col.5) and the resolution derived from the average FWHM of the night-sky lines (col.6). In order to have good wavelength coverage sometimes exposures obtained with different grisms were merged. In these cases the cumulative exposure time is reported.
| Date | phase∗ | inst.∗∗ | exp. | range | resol. |
|---|---|---|---|---|---|
| (days) | (min) | (Å) | (Å) | ||
| 31/12/94 | +43 | 2.2 | 60 | 4500-7100 | 11 |
| 3/1/95 | +46 | 3.6 | 15 | 3700-6900 | 15 |
| 8/1/95 | +51 | 3.6 | 105 | 3700-9800 | 20 |
| 15/1/95 | +58 | NTT+E | 40 | 3800-8350 | 8 |
| 16/1/95 | +59 | NTT+E | 60 | 3800-8350 | 8 |
| 30/1/95 | +73 | NTT+E | 120 | 3800-8900 | 10 |
| 4/2/95 | +78 | 2.2 | 120 | 5850-8450 | 11 |
| 28/2/95 | +102 | NTT+E | 120 | 3850-8900 | 10 |
| 3/3/95 | +105 | NTT+E | 60 | 3850-8900 | 10 |
| 29/3/95 | +131 | 3.6 | 120 | 3700-9800 | 16 |
| 30/4/95 | +163 | 3.6 | 225 | 3700-9800 | 20 |
| 29/5/95 | +192 | NTT+E | 60 | 3850-8400 | 8 |
| 14/11/95 | +361 | NTT+E | 120 | 3850-8400 | 8 |
| 17/03/96 | +485 | 3.6 | 180 | 6000-9850 | 18 |
| 11/05/96 | +540 | NTT+E | 120 | 3400-9000 | 14 |
* relative to the estimated epoch of maximum JD=2449675
** See note to Table 2 for coding
The spectra have been calibrated with He-Ar arcs and flux calibrated
using standard stars from the list of Oke [1984],
Stone [1977], and Oke & Gunn [1983].
The absolute flux
calibration of the spectra has been verified against the V and R
photometry. The agreement was generally fair, except for a few cases
in which the spectra were scaled to match the V photometric
measurements.
Figure 3, which shows a selection of the spectra listed in
Tab. 3, illustrates the spectroscopic evolution of SN 1994aj
from phase +43d to +540d.
In Fig. 4 we compare our best S/N spectrum of SN 1994aj, obtained at phase 51d, with spectra of the two Linear SNe 1979C and 1980K, and of SN 1987A of similar phases. The distinctive feature of SNII, the line, dominates the spectra in all cases, but in SN 1994aj the line has two components, a broad emission component (FWHM = 170 Å) on the top of which is a narrow line with a P-Cygni profile (FWHM = 25 Å for the emission). Whereas the profile of the line will be discussed in more detail later, let us note that there is no evidence of broad P-Cygni absorption although the line is asymmetric with a more extended red wing. This is similar to the case of SN 1979C and other Linear SN II and has been attributed to the fact that the H feature originates only partially through redistribution of the continuum light from the photosphere; there is also a net H emission due to collisional excitation of H [1981]. The effect is usually stronger in H because of the lower energy required compared, for instance, to H and owing to the large optical depth of this line.

The spectrum of SN1994aj has a continuum temperature of about 6500 K, slightly higher than that of SN 1987A at the same phase, but similar to that of SN 1979C.
As is the case in SN 1979C, other lines present in the spectrum of
SN 1994aj show the broad P-Cygni absorption, in particular the NaID,
CaII infrared triplet and possibly the two FeII lines of multiplet 42,
5018Å and 5169Å, all usually quite strong in the
spectrum of SNII at this phase.
It should be noted that the expansion velocity derived from the
minimum of the P-Cygni absorptions, , is smaller than
that of SN 1979C, , but instead very close to that
measured for other Linear SN II, e.g. 1980K and 1990K, and for
SN 1987A around this phase [1991].
At a phase 100-200d after maximum, the emission lines grow in strength relative to the continuum (see Fig. 5). The spectrum appears dominated by the Balmer line of H and the NaID lines is also conspicuous. At these phases, H shows a hint of broad P-Cyg absorption, from which an expansion velocity of km/s is derived. The FeII lines of multiplet 42 and 49 and the CaII] 7291-7324 Å lines are present, although the latter is weaker than is normally observed in SNII. The [OI] 6300-6364 Å lines, are completely absent.
One year after maximum only a strong H emission is detected in the spectrum (see Fig. 6). The complete absence of forbidden line emission, in particular [OI], [OII] and CaII] in the late spectra of SN 1994aj should be noted: at phase 485d we can put a lower limit to the ratio of the H to CaII] 7291-7324 Å doublet instead of typical value of 0 to (e.g. Cappellaro et al. 1995b). A possible explanation of this characteristic is that the density in the line emitting region is much higher than the typical value for SNII at this phase, that is (Branch at al. 1981; Spyromilio & Pinto 1991). The absence of oxygen emission lines may also point to an underabundance of this element in the SN envelope.
2.3 The profile of H emission
In Fig. 7 the spectra of SN 1994aj are expanded to show the evolution of the complex profile of the H line. In Table 4 are reported the main H parameters as measured with the ALICE package in MIDAS, which allows for multiple Gaussian fitting of complex line profiles.
The H profile at 51d consists of the broad component () which is clearly asymmetric with the red wing zero intensity velocity of km/s (see Tab. 4), significantly larger than the corresponding velocity of the blue wing, 6500 km/s. On top of this feature is a relatively narrow P-Cygni feature whose emission component is centered at the same wavelength as the peak of the broad component. The blue wing of the absorption indicates a maximum velocity of km/s (see Tab. 4) whereas the minimum of the trough corresponds to km/s.
It is important to note that the narrow P-Cygni feature appears also on the other Balmer lines visible in the spectra, namely H and H. Although, the S/N and resolution are not good enough to analyze in detail the profiles of these latter lines, the positions of the absorption minima are consistent with the same expansion velocity as the H line. Concerning the narrow P-Cygni feature of H we note that for the first 200d, its profile remains symmetric (the intensity of the absorption is similar to that of the emission, see Tab. 4) suggesting that it is produced by scattering of the photons coming from the SN photosphere, by the hydrogen atoms of the CSM. The intensities gradually decrease and in the latest spectra, corresponding to 1.3 and 1.5 yr after maximum, the narrow absorption feature is barely visible. The velocity corresponding to the minimum of the absorption maintains an almost constant value of about 900 km/s, for the first 100d then decreases to about 500 km/s at 200d.

| Phase | Total | Flux narrow | Em/Ab | |||
|---|---|---|---|---|---|---|
| flux | broad comp. | broad comp. | comp. (Em) | (narrow) | narrow abs. | |
| (days) | () | (Å) | (Å) | () | (Å) | |
| +43 | 70.6 | 6594 | 6962 | 7.8 | 0.88 | 6704 |
| +46 | 90.0 | 6604 | – | 7.3 | 1.07 | 6712 |
| +51 | 83.9 | 6617 | 7010 | 6.2 | 1.19 | 6700 |
| +59 | 94.7 | 6616 | 7000 | 5.9 | 1.02 | 6699 |
| +73 | 97.3 | 6620 | 7004 | 5.5 | 0.95 | 6711 |
| +78 | 76.4 | 6626 | 7001 | 4.5 | 1.02 | 6720 |
| +102 | 68.7 | 6630 | 6990 | 3.8 | 1.09 | 6726 |
| +105 | 76.0 | 6636 | 6996 | 4.0 | 0.98 | 6728 |
| +131 | 71.0 | 6633 | 6957 | 3.5 | 0.97 | 6728 |
| +163 | 70.9 | 6640 | 6957 | 5.1 | 1.13 | 6731 |
| +192 | 83.0 | 6653 | 6887 | 4.4 | 1.02 | 6726 |
| +361 | 40.0 | 6681 | 6850 | 3.8 | 4.75: | 6718 |
| +485 | 11.0 | 6679 | 6856 | 1.1 | – | – |
| +540 | 14.5 | 6686 | 6846 | – | – | – |
Wavelength in the observer rest frame
With time, the broad component became progressively more symmetric until in the spectra of one year or later it shows a roughly rectangular profile with a FWZI 6000 km/s (See Tab. 4), which is consistent with emission from a shell of gas whose thickness is much less than the radius of the shell. Actually in the latest spectra there is a hint of a double peak structure for the broad component which could indicate that the interaction between the SN ejecta and CSM is asymmetric.
Narrow P-Cygni features have been noted in the early spectra of two other SNII Linear, namely 1979C and 1984E. In SN 1979C [1981] the feature is present as the spectra evolve, but its relative strength is never as strong as in SN1994aj, whereas in SN 1984E the feature is quite strong only near discovery, and has already disappeared one month later [1987], indicating that the CSM was confined close to the progenitor. Moreover, in SN 1984E the P-Cygni emission component is significantly stronger than absorption [1984], whereas in SN 1994aj they have comparable strength.
For all these SNe the narrow P-Cygni features can be attributed to a super-wind episode suffered by the SN precursor some time before explosion. From the observations presented here we can derive some constraints for the wind characteristics:
-
1.
the wind has an inner boundary, or at least a density peak, at velocity km/s and extends with a negative density gradient up to a maximum velocity of km. We suggest that at early phases the minimum of the absorption corresponds to a velocity higher than that of the density peak both because of large optical depth of the line and because of a shallow density gradient of the circumstellar wind as demonstrated by Jeffery & Branch [1990].

Figure 5: Average of the four spectra between phase +102d and +163d with the line identifications. In the figure some lines normally present in type II supernovae at this phase, but not in SN 1994aj are also marked with dashed lines. -
2.
It is expected that the burst of UV radiation that occurs when the shock emerges at the surface is strong enough to completely ionize the circumstellar matter surrounding the SN (Fransson & Lundquist 1989; Nadyozhin 1994). Since we observe narrow P-Cyg absorption in the HI lines a significant fraction of the H must have recombined on a time scale shorter than a few weeks. This requires that the density of the super-wind at the outer edge of the emitting region must be . Of course this does not exclude that a low density wind is present at larger radii, since this wind will not have strong lines in the optical region.
-
3.
As we will see in the next section there is evidence of interaction between the ejecta and the circumstellar matter starting 100d after maximum. Since the maximum expansion velocity of the ejecta was seen to be we derive an inner radius for the wind cm. Given the wind velocity, this means that the superwind episode terminated only a few years, , before explosion. On the other hand the interaction is still strong up to the last available spectrum (540d) which indicates that the wind has not yet been swept up completely. This means that the outer edge of the wind has a radius cm. Assuming a steady superwind (with a constant terminal outflow speed and a constant mass loss rate ), i.e. a density varying with , we can obtain a lower limit for the mass of the super-wind:

Figure 6: Comparison of the late time spectra of SN 1994aj, SN 1980K (Uomoto & Kirshner, 1986), SN 1987A (ESO database). The spectra have been corrected by the redshift of the parent galaxy and for extinction

2.4 Flux
In Fig. 8 we compare the absolute H light curve of SN 1994aj (the observed H fluxes are also given in Tab. 4) with that of the Linear Type SN 1990K, SN 1980K and SN 1979C, and of SN 1987A. There is agreement amongst this sample up to past maximum, but at later phases SN 1994aj declines at a much slower rate than the others except for SN 1979C. In the figure are also shown the predicted behavior of models in which the late input energy derives only from radioactive decay of Co to Fe [1991]. Two models with different ejecta mass, namely 5 and 20 M⊙, are shown.
The differences between SNe 1980K, 1990K and 1987A can be understood in terms of different ejecta masses. Linear SNII are fitted by a model with a small mass of the ejecta (5 M⊙) which is consistent with the interpretation of the early light curve and with evidence from the spectra [1995b]. A much higher mass of the ejecta, 10-15 M⊙, is instead required to fit the late H emission of SN 1987A which is consistent with the early light curve.
The early V and R light curves and spectra of SN 1994aj are very similar to those of other Linear SNII, in particular 1980K and 1990K. This implies that the ejecta mass is similar, even though the late H luminosity is higher than for SN 1987A. Since there is evidence of a dense circumstellar medium around SN 1994aj it is natural to attribute the excess of luminosity to the conversion of kinetic energy into radiation when the ejecta interacts with the circumstellar medium. Evidence of a similar phenomenon are now available for a number of SNII, SN 1988Z [1994], which shows the most powerful and long lasting emission in H ever seen in a supernova (Turatto et al. 1993, 1997); SN 1978K [1995] and in particular two more recent objects which are now under intensive studies: SN 1996L [1997] and SN 1996al [1996]. We can estimate the amount of energy released in the interaction, by subtracting, from the observed luminosity, the contribution due to the radioactive decay of Co in Fe which we assume is well represented by the 5 M⊙ model of Chugai (the result does not change significantly if we assume a mass of 10 M⊙). We found that the excess of luminosity is more or less constant with phase and of the order of erg/s, for phases .

We can give a rough estimates of the density and mass loss rate for the wind by using the equation
where is the efficiency for converting kinetic energy into
H radiation, is the mass loss rate, the wind
velocity, the velocity at the shell-wind contact
discontinuity. is not well known, but of the order of
[1990].
By adopting for the mean value of the half-width at zero
intensity of the H line for the last three spectra, km/s we derive g/cm.
Similar values are reported by Chugai for two linear SNe 1970G and SN
1980K, and this is four times smaller than the value derived for SN
1979C. In all these cases however the interaction began a few years after
the explosion.
For a normal stellar wind with km/s this would imply a mass loss rate M⊙/yr. However, most likely the interaction is occurring with the material of the circumstellar shell which gave rise to the narrow P-Cyg feature in the early phases. If this is true, then the velocity is of the order of km/s, and the mass loss rate should therefore be M⊙/yr.
3 Conclusions
From the observations presented in this paper we conclude that SN 1994aj was
a type II SN with linear light curve.
It is generally believed [1993, 1994] that Linear SNII
result from the explosion of
stars with main sequence masses which have lost
most of their envelope via stellar winds. At the time of explosion the
mass of the progenitor is of the order of and the star is
surrounded by several solar masses of circumstellar matter. The
explosion produces about Ni which powers the light curve via
radioactive decay.
While for SNII-L the low mass of the ejecta causes the rapid
luminosity decline of the light curve, the detailed SN output depends
on the distribution of the circumstellar material at the time of
explosion.
The observations of SN 1994aj may
then correspond to the following scenario at the time of the explosion.
A dense ( g/cm) wind, resulting from the late evolution of the progenitor, is confined to a relatively short distance from the star ( cm). The circumstellar material is completely ionized by the burst of hard radiation, but because of the high density it rapidly recombines. The re-radiation of the UV photons created at shock break-out may give rise to a very high optical luminosity at maximum observed for instance in the case of SN 1979C (Branch et al. 1981; SN 1994aj was not observed near maximum). While cooling, the shell becomes visible through Balmer line scattering, for which the P-Cygni profiles indicate a large velocity field (from a few km/s to 2000 km/s for SN 1994aj and similar values for SN 1984E and 1979C). In the case of SN 1979C and for some weeks after explosion, UV emission lines from highly ionized atoms (e.g. NV, SiIV, CIV) have been observed with even larger maximum velocity (up to 4000 km/s). These lines probably originate in the outer regions of lower density [1981].
Some time after explosion the ejecta impacts upon the shell and its kinetic energy is converted into radiation, slowing down the decline of H (and R) luminosity. In the case of SN 1994aj this begins about 100-150 days after maximum and is still active at 540 days. The observed excess of luminosity is consistent with the wind parameters (density and velocity) reported above if we accept an episode of very strong mass loss rate () which terminated shortly before explosion ( yr).
There is evidence (linear light curves and the absence of [OI]
6300-6364 Å emission lines in the nebular spectra) for a lower mass
of the SN 1994aj ejecta (), which would indicate an origin
of this supernova from a main sequence star with a mass about [1994].
Chugai & Danziger suggest a similar mass range for the progenitor of
the peculiar type IIn SN 1988Z, for which they find that less than 1
M⊙ was ejected in the explosion. The photometric and
spectroscopic differences between SN 1988Z and SN 1994aj might then be
explained by differences in the mass loss history along the
progenitor’s evolution, and differences in the density and distribution
of the ISM in which the two progenitors were embedded at the time of
their evolution and explosion.
Given the CSM characteristics of SN 1994aj, an expected radio luminosity between at 6cm is derived (Chevalier 1982; Van Dyk 1996). Such luminosity, given the distance of SN 1994aj, would be beyond the detection limit of current radio telescopes. The difficult detection of another Type IIL supernova, SN 1986E, an object much closer than SN 1994aj, at 0.304 mJy by Montes et al. [1997] reinforces this conclusion.
The X-ray luminosity depends on the square of () [1990], and for SN 1994aj this is erg/s, placing the supernova (given its distance) far below the detection limit of existing X-ray instruments. Coronal lines have not been detected in the optical spectra.
Another possible scenario that may explain some of the SNII-properties
is given by Nomoto et al. [1997]. In this scenario the Fe core
collapse of massive () stars in close binary systems is
invoked. The variety of Type II supernovae (II-L, IIb and IIn, and
conceivably also Ib and Ic supernovae) are explained with the merging
of the two stars in a non-conservative mass transfer scenario. During
the merging of the stars a significant fraction of the common envelope
is lost due to frictional heating. The difference in the SN types
originates from the difference in the mass of the H-rich envelope. In
this scenario the CSM would consist of the material ejected during the
spiraling-in and the RSG wind material, where the structure of the CSM
originated from spiraling-in, is likely to be asymmetric. This could
naturally explain asymmetries in the ejecta - CSM interaction such as
the one possibly seen from the evolution of the H profile of SN
1994aj (see Sect. 2.3). Intensive mass loss such as that seen in
SN 1994aj might be better explained in this last “dynamic”
scenario.
In any case, any model interpreting SNII-L properties should be able
to account for the strong mass loss experienced by these SNe just
before explosion.
ACKNOWLEDGMENTS We thank L. Koesterke and R. Gilmozzi for giving us part of their telescope time.
References
- [1993] Benetti, S., 1993, PhD Thesis, Padua University
- [1994] Benetti, S., 1994, IAUC 6122
- [1996] Benetti, S., Neuhauser, R., 1996, IAUC 6438
- [1997] Benetti, S. et al., 1997, in preparation
- [1993] Blinnikov, S.I., Bartunov, O.S., 1993, A&A 273, 106
- [1981] Branch, D., Falk, S.W., McCall, M.L., Rybski, P., Uomoto, A.K., Wills, B.J., 1981, ApJ 244, 780
- [1978] Burstein, D., Heiles, C., 1978, ApJ 225, 40
- [1995a] Cappellaro, E., Danziger, I.J., Turatto, M., 1995a, MNRAS 277, 106
- [1995b] Cappellaro, E., Danziger, I.J., Della Valle, M., Gouiffes, C., Turatto, M., 1995b, A&A 293, 723
- [1985] Chevalier, R.A., & Fransson, C. 1985, in Supernovae as Distance Indicators, ed. N. Bartel (Berlin:Springer), 123
- [1991] Chugai, N.N., 1991, MNRAS 250, 513
- [1990] Chugai, N.N., 1990, SA 16, L457
- [1994] Chugai, N.N., Danziger I.J., 1994, MNRAS 268, 173
- [1995] Chugai, N.N., Danziger, I.J., Della Valle, M., MNRAS 276, 530
- [1991] Danziger, I.J., Bouchet, P., Lucy, L.B., 1991, in SN 1987A and other Supernovae, eds. I.J. Danziger, Kjär, K., ESO Workshop and conference Proceedings No. 37, p.217
- [1984] Dopita, M., Evans, R., Cohen, M., Schwartz, R., 1984, ApJ 287, L69
- [1993] Fesen, R.A., 1993, ApJ 413, L109
- [1993] Fesen, R.A., Matonick, D.M., 1993, ApJ 407, 110
- [1994] Fesen, R.A., Matonick, D.M., 1994, ApJ 428, 157
- [1989] Fransson, F., Lundquist, P., 1989, ApJ 341, L59
- [1991] Hanuschik, R.W., 1991, in Supernovae ed. S.E. Woosley, Springer-Verlag, New York, p. 26
- [1987] Henry, R.B., Branch, D., 1987, PASP 99, 112
- [1990] Jeffery, D., Branch, D., 1990, Supernovae , eds. J.C. Wheeler, T. Piran & S. Weinberg, World Scientific Publishing Co., Singapore, p.149
- [1992] Landolt, A.U., 1992, AJ 104, 340
- [1991] Leibundgut, B., 1991, in SN 1987A and other Supernovae, eds. I.J. Danziger, Kjär, K., ESO Workshop and Conference Proceedings No. 37, p. 363
- [1997] Montes, M.J, Van Dyk, S.D., Weiler, K.W., Sramek, R.A., Panagia, N., 1997, ApJL, in press
- [1994] Nadyozhin, D.K., 1994, Supernovae , eds. Bludman, S.A., Mochkovitch, R., Zinn-Justin, J., Elsevier Science B.V., p. 569
- [1997] Nomoto, N., Iwamoto, K., Young, T., Nakasato, N., Susuki, T., 1997, Thermonuclear Supernovae , eds. R. Canal, P. Ruiz-Lapuente, J. Isern, Proceedings of NATO Advanced Study Institute, Vol. 486, p.839
- [1984] Oke, J.B., 1984, ApJS 27, 21
- [1983] Oke, J.B., Gunn, J.E., 1983, ApJ 266,713
- [1994] Patat, F., Barbon, R., Cappellaro, R., Turatto, M., 1993, A&A 282, 731
- [1994] Pollas, C., 1994, IAUC 6121
- [1990] Schlegel, E.M., 1990, MNRAS 244, 269
- [1991] Spyromilio, J., Pinto, P.A., 1991, SN 1987A and other Supernovae, eds. I.J. Danziger, Kjär, K., ESO Workshop and Conference Proceedings No. 37,p.423
- [1977] Stone, R.P.S., 1977, ApJ 218, 767
- [1994] Suntzeff, N.B., 1994, IAUC 6121
- [1990] Turatto, M., Cappellaro, E., Barbon, R., Della Valle, M., Rosino, L., 1990, AJ 100, 771
- [1993] Turatto, M., Cappellaro, E., Danziger, J., Benetti, S., Gouiffes, C., Della Valle, M., 1993, MNRAS 262, 128
- [1997] Turatto, M., Benetti, S., Cappellaro, E., Danziger, J., Mazzali P.A., 1997, in SN 1987A: Ten years After, Fifth CTIO/ESO/LCO Workshop, eds. Phillip M.M. and Suntzeff N.B., in press
- [1986] Uomoto, A., Kirshner, R.P., 1986, ApJ 308, 685
- [1996] Van Dyk, S.D., Weiler, K.W., Sramek, R.A., Schlegel, E.M., Filippenko, A.V.; Panagia, N., Leibundgut, B., 1996, AJ 111, 1271