Maximum-Entropy analysis of EGRET data
Abstract
EGRET data are usually analysed on the basis of the Maximum-Likelihood method ma96 in a search for point sources in excess to a model for the background radiation (e.g. hu97 ). This method depends strongly on the quality of the background model, and thus may have high systematic uncertainties in region of strong and uncertain background like the Galactic Center region.
Here we show images of such regions obtained by the quantified Maximum-Entropy method. We also discuss a possible further use of MEM in the analysis of problematic regions of the sky.
I The method
Scientific data analysis means using our data to make inferences about various hypotheses. However, what the data give us is the likelihood of getting our specific data set as a function of the hypothesis. To reverse the conditioning Bayes’ theorem can be used which invokes a prior probability distribution for the hypotheses as additional input. The prior probability distribution can be fairly simple, for example a scaling of a known behaviour in a system to its subsystem.
The consequence of this is that the ”best” hypothesis can be derived by maximising the entropy (for an extensive introduction see gs84 )
| (1) |
under the constraint of a likelihood argument. Here is the hypothesis in pixel and is our prior expectation.
An implementation of this method is given by the MEMSYS5-package, which further allows us to derive a posterior probability bubble and thus the uncertainty of the ”best” hypothesis.
II The influence of the prior expectation
From the definition it is clear that the prior expectation of the analyst has a strong influence on the result. This implies also that without information on what kind of prior was used the results of a MEM run have to be taken with care.
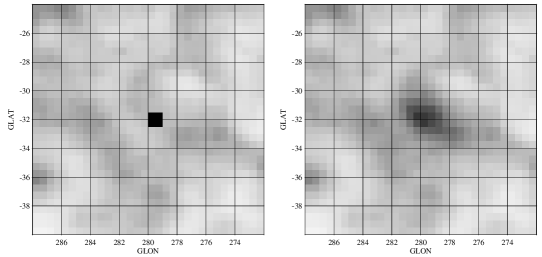
It is often argued that MEM is advantageous for the analysis of diffuse emission or extended structure. In Fig.1 we show the region around the Large Magellanic Cloud (LMC) twice. One image is derived without having LMC included into the prior expectation, and the second is the result of adding a point source to the prior expectation based the flux and best position of LMC th95 . Though the prior distribution is different only in an area of 1 square degree, the final image is influenced over roughly 20 square degrees. This implies that a) the appearance of LMC depends strongly on the prior expectation, and b) any source of unknown extent, which is not accounted for in the prior distribution, may result in a fuzz of a few degrees extent. So with MEM we do find sources, but it is hard to distinguish point sources from structure like that in the sky distribution of galactic diffuse emission.
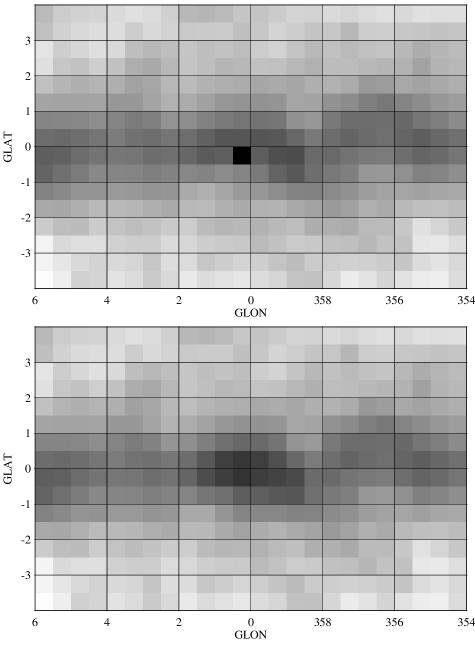
A similar effect is seen in crowded regions like the Galactic Center, as shown in Fig.2. Here we have restricted ourselves to -ray energies above 300 MeV so that the smaller extent of the point-spread function can be used to advantage. The second EGRET catalogue th95 lists a highly significant source right at the position of the Galactic Center, but notes potential problems of the likelihood analysis in this region. In the MEM analysis we again see a strong influence of the prior model on the resulting image, however on smaller scale. This is due both to our restriction to higher energies and to the better statistic than in case of LMC.
When we now artificially increase the flux of the galactic center source in the data, but still use the catalogue flux in our prior distribution, then the additional intensity will be spatially distributed like in the case of no point source in the prior, i.e. the lower panel of Fig.2.
III Discussion
We have shown that on small scales the MEM images tend to be influenced strongly by the prior expectation. Thus point sources can not be easily distinguished from structure in the diffuse emission. Also, in single viewing periods the prior distribution is likely to be dominant of the likelihood statistic and thus the final image. Thus MEM can not be used in a simple way to deduce the light curve of point sources in regions of high confusion level. However, what we can do is to use MEM to improve the background model for the likelihood analysis of known point sources in crowded regions of the -ray sky.
Despite our concerns about the limited reliabity of individual structure in the MEM output, it is still true that MEM produces images which are highly reliable on larger scales. As an example we show an allsky image in Fig.3. Please note that the grey scale here is logarithmic and spans more than two orders of magnitude in integrated intensity above 100 MeV. The point sources stick out very clearly. None of the point sources is in the prior distribution, so that all of them have an extent of a few degrees in the image.
![[Uncaptioned image]](/html/astro-ph/9706152/assets/x3.png)
The EGRET Team gratefully acknowledges support from the following: Bundesministerium für Bildung, Wissenschaft, Forschung und Technologie (BMBF), Grant 50 QV 9095 (MPE); NASA Cooperative Agreement NCC 5-93 (HSC); NASA Cooperative Agreement NCC 5-95 (SU); and NASA Contract NAS5-96051 (NGC).
References
- (1) Mattox J.R. et al. 1996, ApJ, 461, 396
- (2) Hunter S.D. et al. 1997, ApJ, 481, 205
- (3) Gull S.F., Skilling J.: 1984, IEEE Proceedings 131(F), 646
- (4) Thompson D.J. et al. 1995, ApJS, 101, 259